4202
Amide proton transfer weighted and intravoxel incoherent motion imaging in evaluation of prognostic factors for rectal adenocarcinoma
Juan Li1, cheng jingliang1, and Lin Liangjie2
1Department of MRI, The First Affiliated Hospital of Zhengzhou University, Zhengzhou, China, 2Philips Healthcare, Beijing, China
1Department of MRI, The First Affiliated Hospital of Zhengzhou University, Zhengzhou, China, 2Philips Healthcare, Beijing, China
Synopsis
This study explored the application of APT and IVIM in evaluation of prognostic factors for rectal adenocarcinoma. Parameters of APT signal intensity (APT SI), pure diffusion coefficient (D), pseudo-diffusion coefficient (D*), perfusion fraction (f), and apparent diffusion coefficient (ADC) were measured. The results showed that APT SI was significantly lower in low- than high-grade adenocarcinoma. The D value was significantly higher in low- than high-grade adenocarcinoma. The D value was significant lower in positive than in negative extramural vascular invasion (EMVI). This suggests that APT and IVIM were helpful to assess rectal adenocarcinoma, including histopathological grade and the EMVI status.
Introduction
Colorectal cancer is a common malignancy of the digestive tract [1]. Many factors are associated with therapeutic schedule and prognosis of rectal cancer, including tumor grade, T stage, N stage, and related imaging indicators based on MRI, such as circumferential resection margin (CRM), and extramural vascular invasion (EMVI) statuses [2,3]. Magnetic resonance imaging (MRI) is the first choice for preoperative diagnosis and staging of rectal cancer. Functional MRI methods have become increasingly used for clinical applications in recent years. Among them, IVIM provides diffusion and perfusion information within tissue through the biexponential modelling of images acquired by multiple b values [4]. Amide proton transfer (APT) weighted imaging is a noninvasive molecular imaging technique based on the effect of chemical exchange saturation transfer (CEST). It indirectly measures the endogenous moving proteins and peptides by detecting the reduction in bulk water intensity, which reflects changes of the internal metabolism [5,6]. In this study, we analyze the value of APT weighted and IVIM imaging in evaluation of prognostic factors for rectal adenocarcinoma, thereby to evaluate their reference values for assessing the malignant degree and predicting tumor aggressiveness, compared with diffusion weighted imaging (DWI)Methods
Preoperative pelvic MRI data of 93 patients with surgical pathologically confirmed diagnosis of rectal adenocarcinoma were retrospectively evaluated. MRI were performed on a 3T scanner (Ingenia CX, Philips Healthcare, Best, the Netherlands) with a 32-channel phase array coil. All patients underwent high-resolution T2-weighted imaging (T2WI), APT, IVIM, and DWI. The APT parameters were: TR/TE = 6540/8.3 ms; FOV = 230×181 mm2; scan matrix = 116×90; voxel size = 2×2×5mm3; 9 slices; TSE factor = 174; acquisition time = 6 min 0 sec. The IVIM parameters were: TR/TE = 4888/90ms; FOV = 240×240 mm2; scan matrix = 72×67; voxel size = 3.3×3.58×5mm3; 24 slices; b=0,10,20,50,100,200,400,800,1200; acquisition time = 4 min 53 sec. Parameters including APT signal intensity (APT SI), pure diffusion coefficient (D), pseudo-diffusion coefficient (D*), perfusion fraction (f), and apparent diffusion coefficient (ADC) were measured in different histopathologic grades, stages, and structure invasion statuses. Receiver operating characteristic (ROC) curves were used to evaluate the diagnostic efficacy, and the corresponding area under the curves (AUCs) were calculated. DeLong test was used to compare the differences of ROC curves. The forward model of binary logistic regression was applied for parameter fusion. Differences with a P<0.05 were considered statistically significant.Results
The APT SI and D values showed significant differences between low- and high-grade rectal adenocarcinomas ([2.226±0.347%] vs. [2.668±0.638%], and [0.842±0.148×10⁻³ mm2/s] vs. [0.777±0.178×10⁻³ mm2/s], respectively, both P<0.05). Figures 1-2 show image examples from low and high-grade patients. A significant difference of the D value was observed between positive and negative extramural vascular invasion (EMVI) tumors ([0.771±0.175×10⁻³ mm2/s] vs. [0.858±0.151×10⁻³ mm2/s], P<0.05). No significant difference of APT SI, D, D*, f or ADC was observed in different T stages, N stages, perineural and lymphovascular invasions (all P>0.05) (Table 1). The AUCs of APT SI and D values in distinguishing low- from high-grade adenocarcinomas were 0.737 and 0.663, respectively. The AUC was increased to 0.806 thought the combination of APT SI and D values (Fig. 3). The AUC of the D value for evaluating EMVI involvement was 0.646 (Fig. 4).Discussion
In our study, we performed a comprehensive investigation of correlations of APT and IVIM parameters with rectal cancer prognostic factors, in comparison with results by DWI. We demonstrated that the APT SIs of low-grade adenocarcinomas were significantly lower compared to those of high-grade adenocarcinomas. Therefore, APT weighted imaging may be helpful to identify the pathological grade of rectal cancer. The higher APT SIs in high-grade tumors can be due to the abundant proteins production, rapid cell proliferation and angiogenesis. In present study, lower D values were observed in high-grade than those of low-grade rectal adenocarcinomas. The D value, that represents the pure diffusion of free water molecules, was decreased with the increasing cellularity, tight cellular structure in high-grade tumors. Parameters derived from APT and IVIM showed no significant differences between pT1-2 and pT3-4 stages, or between pN1-2 and pN0 stages, further study is needed to evaluate the significance. In addition, the D value was observed to be lower in the positive EMVI group than in the negative group in this study. The high-resolution T2WI images should be combined to improve the diagnosis accuracy of EMVI, which was considered positive if vessel wall irregularity, abnormal extension, suspected the empty signal was replaced by tumor tissue. Additionally, no significant difference of APT and IVIM parameters were found in groups with and without different types of structure invasion in our study, which may be because the tumor microenvironment reflected by APT or IVIM parameters is insufficient to cause significant changes in perineural and lymphovascular invasion.Conclusion
APT SI and D values were helpful to differentiate the low- and high-grade of rectal adenocarcinoma, and their combination could improve the diagnostic performance. The D value can help determine EMVI status. However, it is still debatable whether APT or IVIM can help distinguish stage, perineural invasion, and lymphovascular invasion. In conclusion, APT and IVIM were helpful to assess tumor grade and EMVI status of the rectal adenocarcinoma.Acknowledgements
We sincerely thank the participants in this study.References
[1] Siegel RL, Miller KD, Goding Sauer A, et al. Colorectal cancer statistics, 2020. CA Cancer J Clin. 2020;70(3):145-164. [2] Glynne-Jones R, Wyrwicz L, Tiret E, et al. Rectal cancer: ESMO Clinical Practice Guidelines for diagnosis, treatment and follow-up. Ann Oncol. 2017;28:22-40. [3] Wilkinson N. Management of Rectal Cancer. Surg Clin North Am. 2020;100(3):615-628. [4] Le Bihan D. What can we see with IVIM MRI?. Neuroimage. 2019;187:56-67. [5] Zhou J, Heo HY, Knutsson L, et al. APT-weighted MRI: Techniques, current neuro applications, and challenging issues. J Magn Reson Imaging. 2019;50(2):347-364. [6] Wu Y, Chen Y, Zhao Y, et al. Direct radiofrequency saturation corrected amide proton transfer tumor MRI at 3T. Magn Reson Med. 2019;81(4):2710-2719.Figures
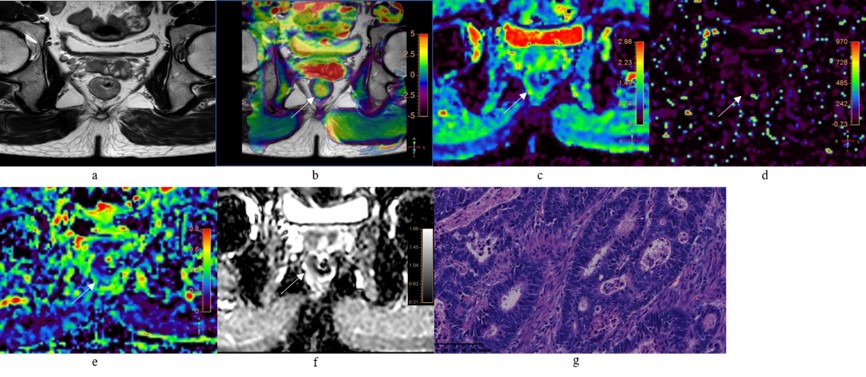
Figure 1. A 52-year-old male with low-grade rectal
adenocarcinomas. a: Oblique axial T2-weighted image showed a mess
with slightly high intensity in the rectum. b: APT-T2 merged image showed the
mess with a mean APT SI of 2.1%. c-e: D, D* and f maps showed the mess with
values of 0.81×10⁻³ mm2/s, 7.74×10⁻³ mm2/s
and 0.19, respectively. f: The mass showed low intensity (1.03×10⁻³
mm2/s) on the ADC map. g: HE staining revealed moderately
differentiated adenocarcinoma. (×200)
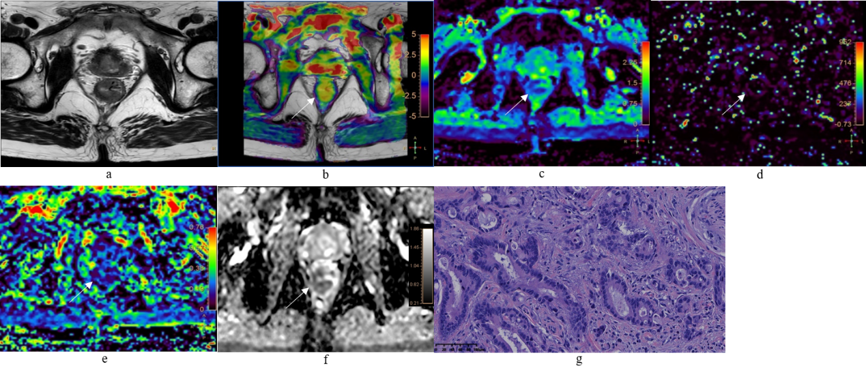
Figure 2. A 78-year-old male with high-grade rectal
adenocarcinomas. a: Oblique axial T2-weighted image showed a mess with
slightly high intensity in the rectum. b: APT-T2 merged image showed the mess
with a mean APT SI of 2.8%. c-e: D, D* and f maps showed the mess with values
of 0.79×10⁻³mm2/s, 9.40×10⁻³mm2/s
and 0.17, respectively. f: The mass showed low intensity (0.93×10⁻³mm2/s)
on the ADC map. g: HE staining revealed poorly differentiated adenocarcinoma.
(×200)
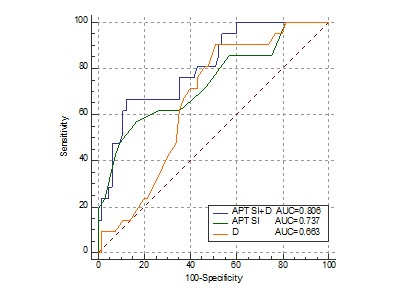
Figure 3. A comparison of the ROC curves for
distinguishing low- from high-grade AC between APT SI, D, and APT SI combined
with D.
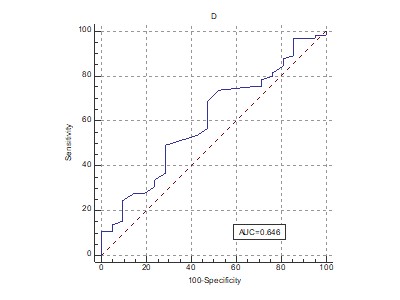
Figure 4. The ROC curve for distinguishing positive EMVI from
negative EMVI using the D value.
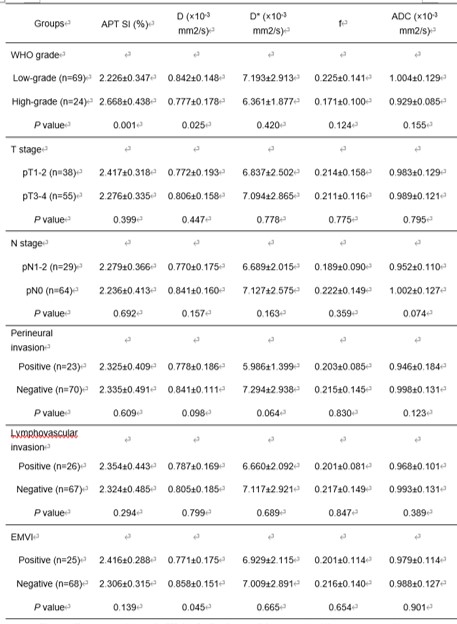
Table1. The comparison of APT SI, D, D*, f and ADC
values in different groups of rectal
adenocarcinoma
DOI: https://doi.org/10.58530/2022/4202