4199
The Diagnostic Value of Extracellular Volume Fraction in Different Pathological Types of Lung Cancer – a preliminary study1Shandong Provincial Hospital Affiliated to Shandong First Medical University, Jinan, China, 2Shandong Provincial Hospital Affiliated to Shandong University, Jinan, China, 3MR Scientific Marketing,Diagnostic Imaging, Siemens Healthineers Ltd., Shanghai, China, 4The People's Hospital of LaoLing, LaoLing, China
Synopsis
Chest scans were performed on 42 lung cancer patients using MRI and CT scanners to calculate ECV. Using one-way analysis of variance, the ECV calculated based on CT is statistically different between SCLC and NSCLC, there is no statistical difference between squamous cell carcinoma and adenocarcinoma, and the ECV calculated based on MRI is statistically different among the three.It can be seen that ECV can be accurate and non-invasive assessment of the pathological type of lung cancer, and MRI-ECV has a higher diagnostic efficiency than CT-ECV, can provide some help for the choice of clinical treatment options.
Introduction
Different pathological types of lung cancer have different treatment options[1]. Before treatment, the puncture is usually required to determine the pathological type, which is more likely to cause complications such as pneumothorax and bleeding. The occurrence and development of solid tumors are accompanied by changes in the extracellular microenvironment and the quantification of extracellular matrix can be expressed in extracellular volume fraction, i.e. extracellular volume (ECV). Imaging technology as a non-invasive tool can help cancer diagnosis nowadays. Relevant studies have confirmed that the correlation between imaging ECV and pathological ECV, which provides a new method for disease assessment [2-4]. In this study, we used CT and MRI to investigate the ECV in distinguishing pathological type of lung cancer.Methods
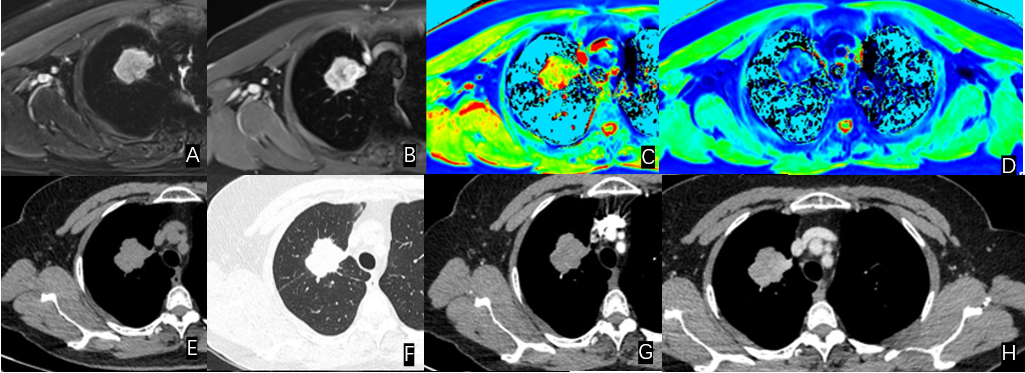
42 patients(age:mean±std) with pathological diagnosis of lung cancer were enrolled, including 24 cases of adenocarcinoma, 10 cases of squamous cell carcinoma, and 8 cases of small cell lung cancer (SCLC). All cases received CT and MRI enhanced scanning. CT(Force, Siemens) scan parameters were following: tube voltage: Care Kv, tube current: Care dose 4d, matrix:512×512, layer thickness:1.0mm, layer spacing:0.7mm. MRI (MAGNETOM Prisma, Siemens healthcare, Erlangen, Germany )examination: 18-channel phased-array body surface coil and spine coil are used. T1-mapping technology is used for scanning, the scanning parameters are as follows: TR:5.01ms, TE:2.3ms, FOV:380×69.6mm², layer thickness:2.5mm, number of layers:48, TA: 14s. All images were post-processed via Siemens Syngovia workstation. Calcification, blood vessels, necrosis, and artifacts were avoided when annotating the region of interest (ROI) of the lung cancer. T1 values and CT values were estimated for both pre-contrast and post-contrast phases. Red blood cell build-up was collected for the simulation of ECV as the following formula: $$$ECVCT(%)=ΔR1lung/ΔR1aorta ×(100-hematocrit),where $$$ΔR1lung = CT value lung postcontrast – CT value lung precontrast$$$ and $$$ΔR1aorta = CT value aorta postcontrast –CT value aorta precontrast$$$, $$$ECVMRI(%)=ΔR1lung/ΔR1aorta ×(100-hematocrit)$$$, where $$$ΔR1lung = 1/T1lung postcontrast – 1/T1lung precontrast$$$ and $$$ΔR1aorta = 1/T1aorta postcontrast – 1/T1aorta precontrast$$$. The ECV of lung occupied lesions of different pathological types was tested by using ANOVA and ROC curve via SPSS (IBM, Armonk, NY).Results
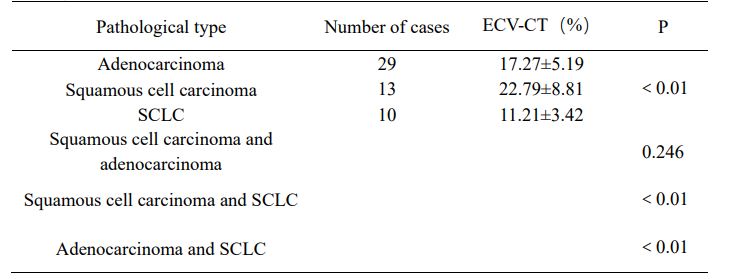
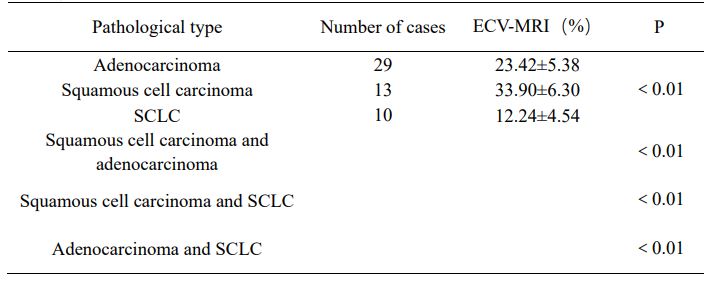
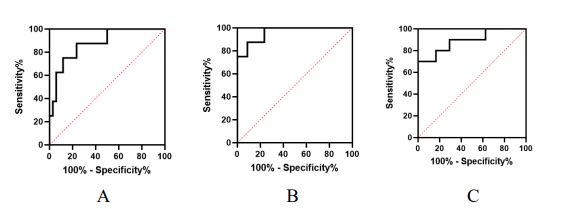
CT image results were as follows. The ECV of adenocarcinoma, squamous cell carcinoma, and SCLC were (17.27±5.19)%, (22.79±8.81)%, (11.21±3.42)%. There was a significant difference between SCLC and NSCLC (P<0.05). The area under the curve (AUC) was 0.875 (95% confidence intervals (Cis) = 0.747 - 1.000) for using the ECV as the threshold. The sensitivity and specificity achieved 76.5% and 87.5% with a cut-off of 14.07%. The difference between squamous cell carcinoma and adenocarcinoma was not statistically significant (P>0.05). MRI results were as follows. The ECV of adenocarcinoma, squamous cell carcinoma, and SCLC were (23.42±5.38)%, (33.90±6.30)%, (12.24±4.54)%, respectively. There was a significant difference between SCLC and NSCLC (P<0.05). The AUC achieved 0.960 (95% Cis = 0.896 -1.000), A cutoff value of 17.05% could be used as a threshold to distinguish SCLC and NSCLC with a sensitivity of 87.5% and a specificity of 91.2%. Also, MRI could be used to distinguish adenocarcinoma and squamous cell carcinoma significantly (P<0.05). The AUC achieved 0.892 (95% Cis = 0.760 - 1.000). And the sensitivity and specificity achieved 70% and 95.8% with a cut-off value of 32.43%, respectively.Discussion
Different pathological types of lung cancer have different occurrence and growth patterns, such as the ECV fraction. In this group of studies, ECV calculated based on MRI images can show this difference between all three lung cancer types, while CT images can only show the difference between small cell lung cancer and non-small cell lung cancer. This is due to the higher resolution of MRI soft tissue than CT, and as a multiparameter imaging method, MRI can provide more biological information when delineating ROI. It can better avoid necrosis, degeneration, and other non-tumor material parts, and get more accurate calculation results.Conclusion
MRI can provide a more refined structure of the lung and the ECV from MRI can accurately and non-invasively evaluate the pathological type of lung cancer, which can help for the selection of clinical treatment options.Acknowledgements
We sincerely thank the participants in this study.References
[1]Wang S, Zimmermann S, Parikh K, et al. Current Diagnosis and Management of Small-Cell Lung Cancer. Mayo Clin Proc. 2019 Aug;94(8):1599-1622.
[2]Robinson AA, Chow K, Salerno M. Myocardial T1 and ECV Measurement: Underlying Concepts and Technical Considerations[J]. JACC Cardiovasc Imaging,2019,12(11 Pt 2):2332-2344.
[3] Adams L C, Jurmeister P, Ralla B, et al. Assessment of the extracellular volume fraction for the grading of clear cell renal cell carcinoma: first results and histopathological findings[J]. Eur Radiol,2019,29(11):5832-5843.
[4] Fukukura Y, Kumagae Y, Higashi R, et al. Extracellular volume fraction determined by equilibrium contrast-enhanced multidetector computed tomography as a prognostic factor in unresectable pancreatic adenocarcinoma treated with chemotherapy[J]. Eur Radiol,2019,29(1):353-361.
Figures