4198
MR fingerprinting for liver tissue characterization in a single breath-hold scan: A histopathological correlation study1Department of Radiology, Juntendo University, Tokyo, Japan, 2Department of Radiology, The University of Tokyo, Tokyo, Japan, 3Department of Biomedical Engineering, School of Biomedical Engineering and Imaging Sciences, King’s College London, London, United Kingdom, 4Department of Human Pathology, Juntendo University, Tokyo, Japan, 5MR Clinical Science, Philips Japan, Tokyo, Japan, 6Department of Gastroenterology, Juntendo University, Tokyo, Japan
Synopsis
Magnetic resonance fingerprinting (MRF) has been proposed for simultaneous T1, T2, T2*, and fat-fraction mapping of the liver, which is suitable for the diagnosis and monitoring of liver diseases. We evaluated the repeatability of liver MRF measurements and correlated it with reference standard imaging in patients with diffuse liver disease. Furthermore, we validated MRF-derived measurements against histological grading of liver biopsies. Liver MRF provided repeatable multi-parametric maps with high agreement with measurements of separate conventional quantitative mapping as well as histological grading of liver biopsies. This approach may enable objective and non-invasive hepatic tissue characterization in a single breath-hold scan.
Introduction
Quantitative T1, T2, T2* and fat-fraction (FF) maps are promising imaging biomarkers for the assessment and follow-up of diffuse liver diseases1,2. Liver magnetic resonance fingerprinting (MRF)3 enables simultaneous co-registered quantification of T1, T2, T2*, and FF in a single breath-hold scan, suitable for non-invasive liver tissue characterization4. To progress along the pathway to imaging biomarker development, such techniques should be validated against standard techniques in patients and their measurement tied to pathological changes5.Here we (i) evaluated the agreement between multi-parametric liver MRF-derived metrics and reference standard imaging in patients with diffuse liver disease, (ii) evaluated the scan-rescan repeatability of the liver MRF measurement, and (iii) validated MRF-derived measurements for histological grading of liver biopsies.
Methods
Study populationThis prospective study was approved by the local institutional review board. Written informed consent was obtained from each subject prior to scanning. A total of 46 patients (19 men and 27 women; age, 59.8±15.0 [28–85] years) with diffuse liver disease undergoing MRI were enrolled in this study.
MR imaging and reconstruction
Liver MRF acquisition is based on a 9-echo, golden-angle radial gradient-echo (GRE) acquisition with bipolar readouts and varying inversion recovery and T2 preparation pulses, allowing simultaneous liver T1, T2, T2*, and FF mapping in a single ~20-s breath-hold scan4,6. Each patient was imaged with a 9-echo liver MRF sequence and individual conventional mapping acquired in three separate breath-holds (T1 modified Look-Locker inversion recovery [MOLLI], T2 gradient spin echo [GraSE], and multiecho GRE, for T1, T2, T2*/FF estimation, respectively). Rescan of the 9-echo liver MRF was also performed at the end of the same session. All measurements were performed on a 1.5-T scanner (Ingenia; Philips Healthcare, Best, The Netherlands) with a 32 channel body coil. Offline reconstruction was performed in MATLAB (MATLAB2019a; MathWorks, Natick, MA) using dictionary-based sparse and locally low rank regularized reconstruction7.
Liver histology
Of the 46 patients, 10 patients (4 men and 6 women; age, 46.1±9.4 [29–58] years) underwent liver biopsy. Liver biopsies were percutaneously performed by a gastroenterologist through the intercostal space in the midaxillary line. Formalin-fixed biopsy specimens were stained with hematoxylin and eosin (for overall assessment), Azan trichrome stain (to assess fibrosis), and Berlin blue stain (to assess iron deposition). Biopsy specimens were evaluated by a hepatic pathologist (23 years of experience) blinded to both the MRF and conventional maps. Biopsies were scored using the NASH Clinical Research Network NAFLD activity score and fibrosis score8.
Analysis
For each parameter map, a total of ten circular regions of interest (ROIs) were manually drawn in the liver (four different areas avoiding large vessels), erector spinae muscle (one on each side), subcutaneous fat (one on each side), and the spleen (two different areas) by two board-certified radiologists (7 and 20 years of experience) blinded to the pathology. Median value was recorded for each ROI and compared to its corresponding reference measurements. Scan-rescan repeatability of each MRF parameter map was assessed using the coefficient of variation (CV), defined as the standard deviation (SD) of the quantitative maps derived from the scan and rescan over the mean of both maps. Welch's t-test with Bonferroni correction was used to compare MRF-derived metrics among the histological grades. The degree of association between continuous variables was calculated using the Pearson’s correlation coefficient.
Results
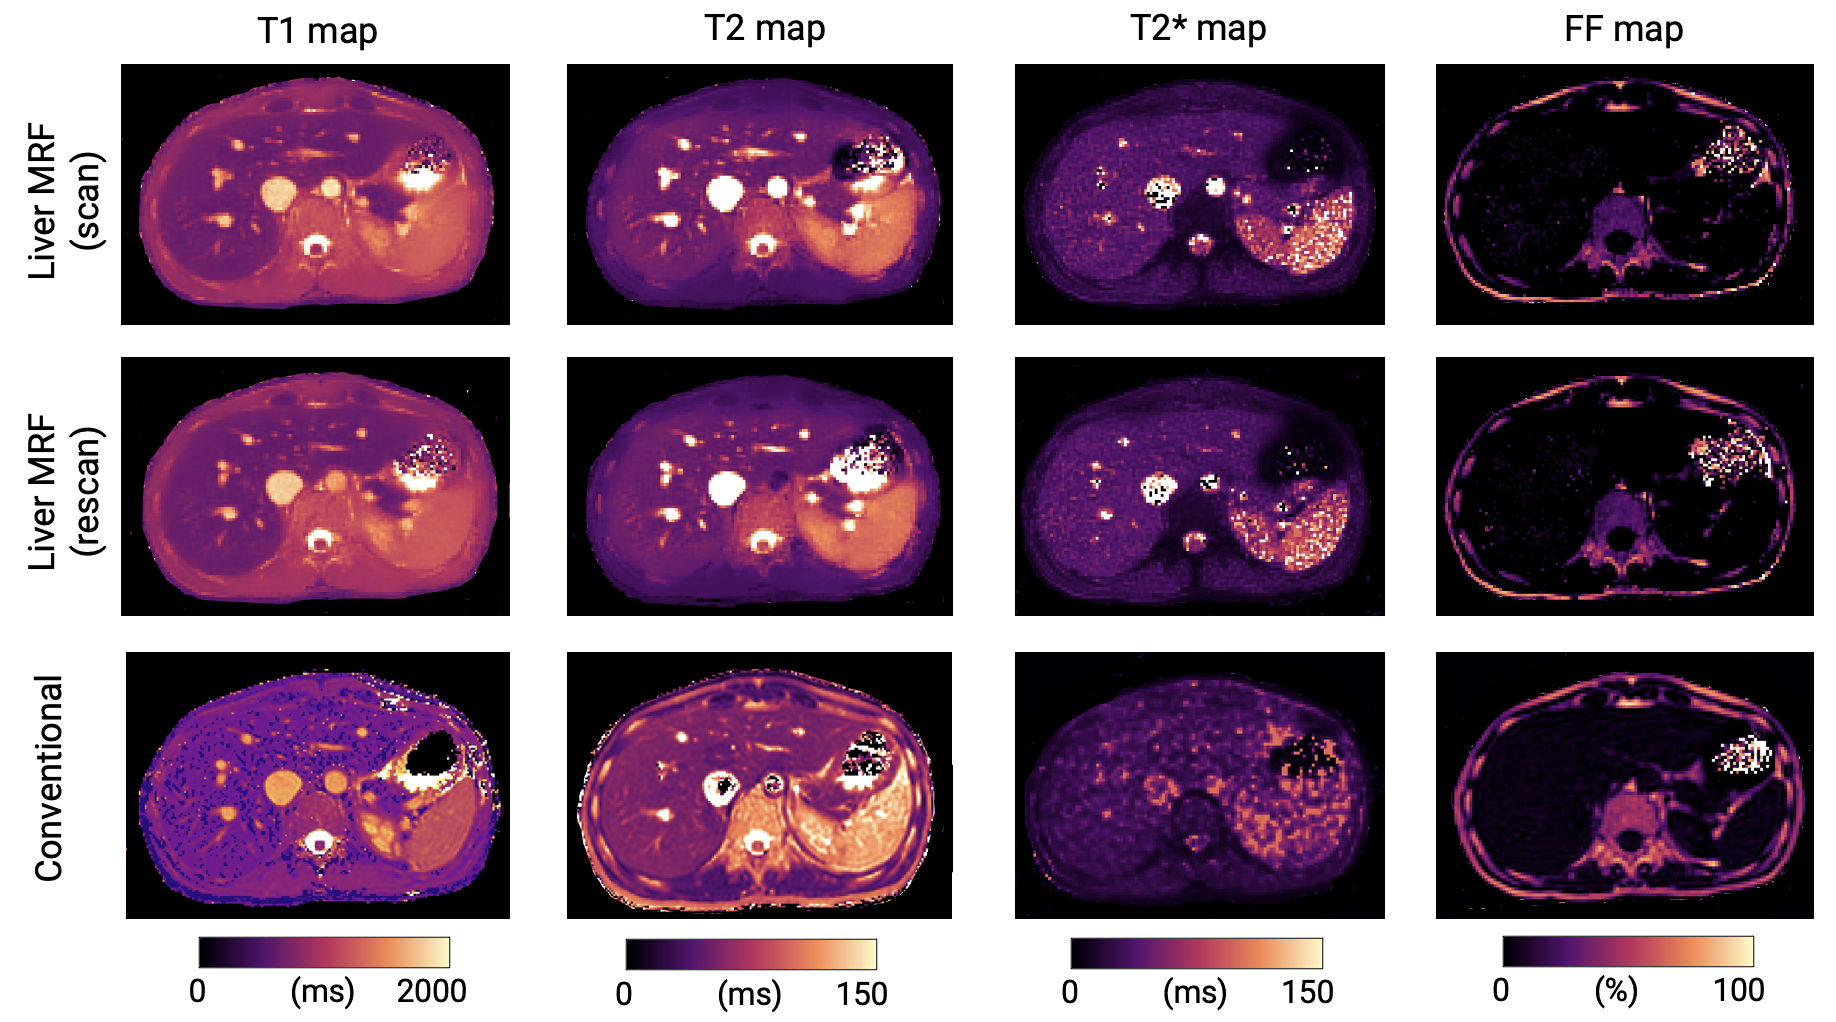
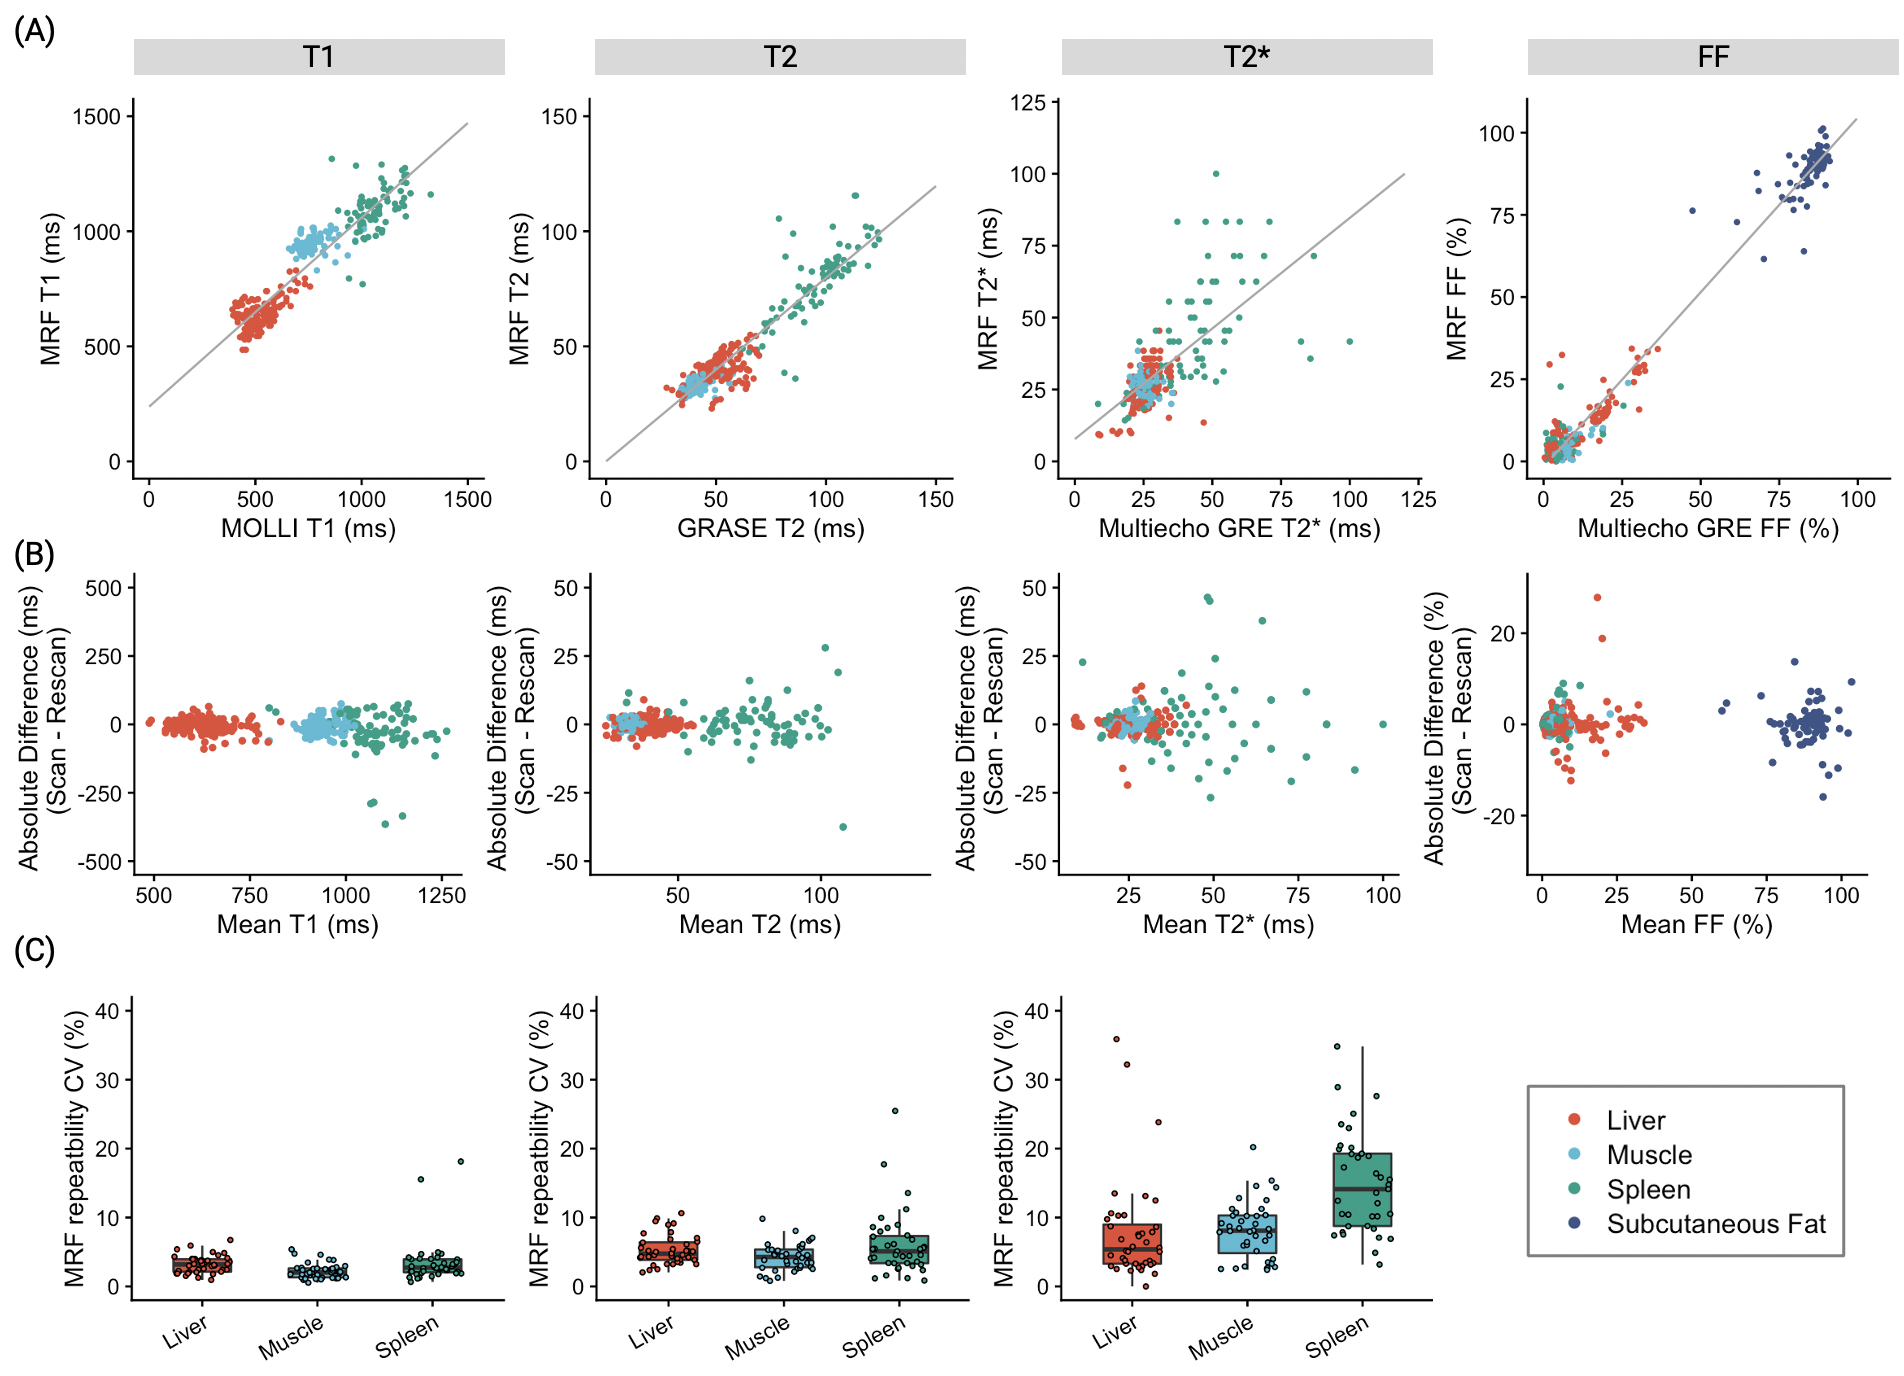
Comparison with reference standard imaging and repeatability of MRF metricsFigure 1 shows representative MRF maps and conventional T1, T2, T2*, and FF maps of a patient with diffuse liver disease. Agreement with reference standard measurements in patients with diffuse liver disease is shown in Figure 2A (r=0.93, r=0.93, r=0.69, and r=0.99 for T1, T2, T2*, and FF, respectively). A slight T1 overestimation compared to MOLLI and underestimation of T2 were consistent with previous MRF findings6. The scan-rescan repeatability of each parameter acquired with MRF is shown in Figures 2B and 2C. The overall CVs for repeatability in the liver were 4%, 9%, and 10% for T1, T2, and T2*, respectively. Note that this repeatability includes errors due to poor breath-holding and patient movements.
Histopathological correlation
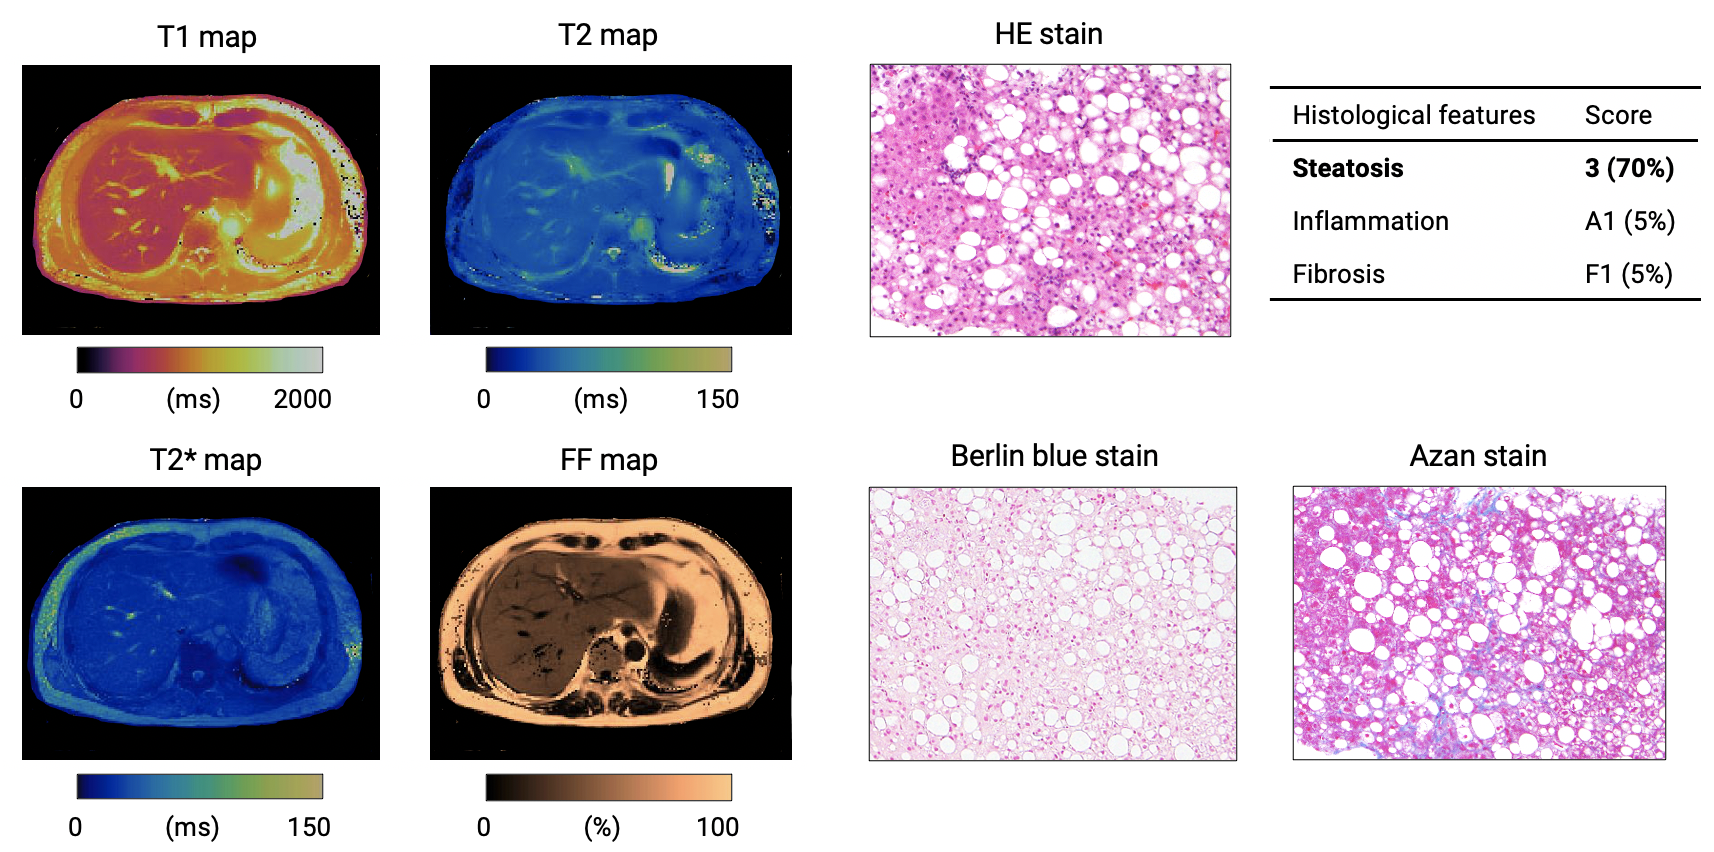
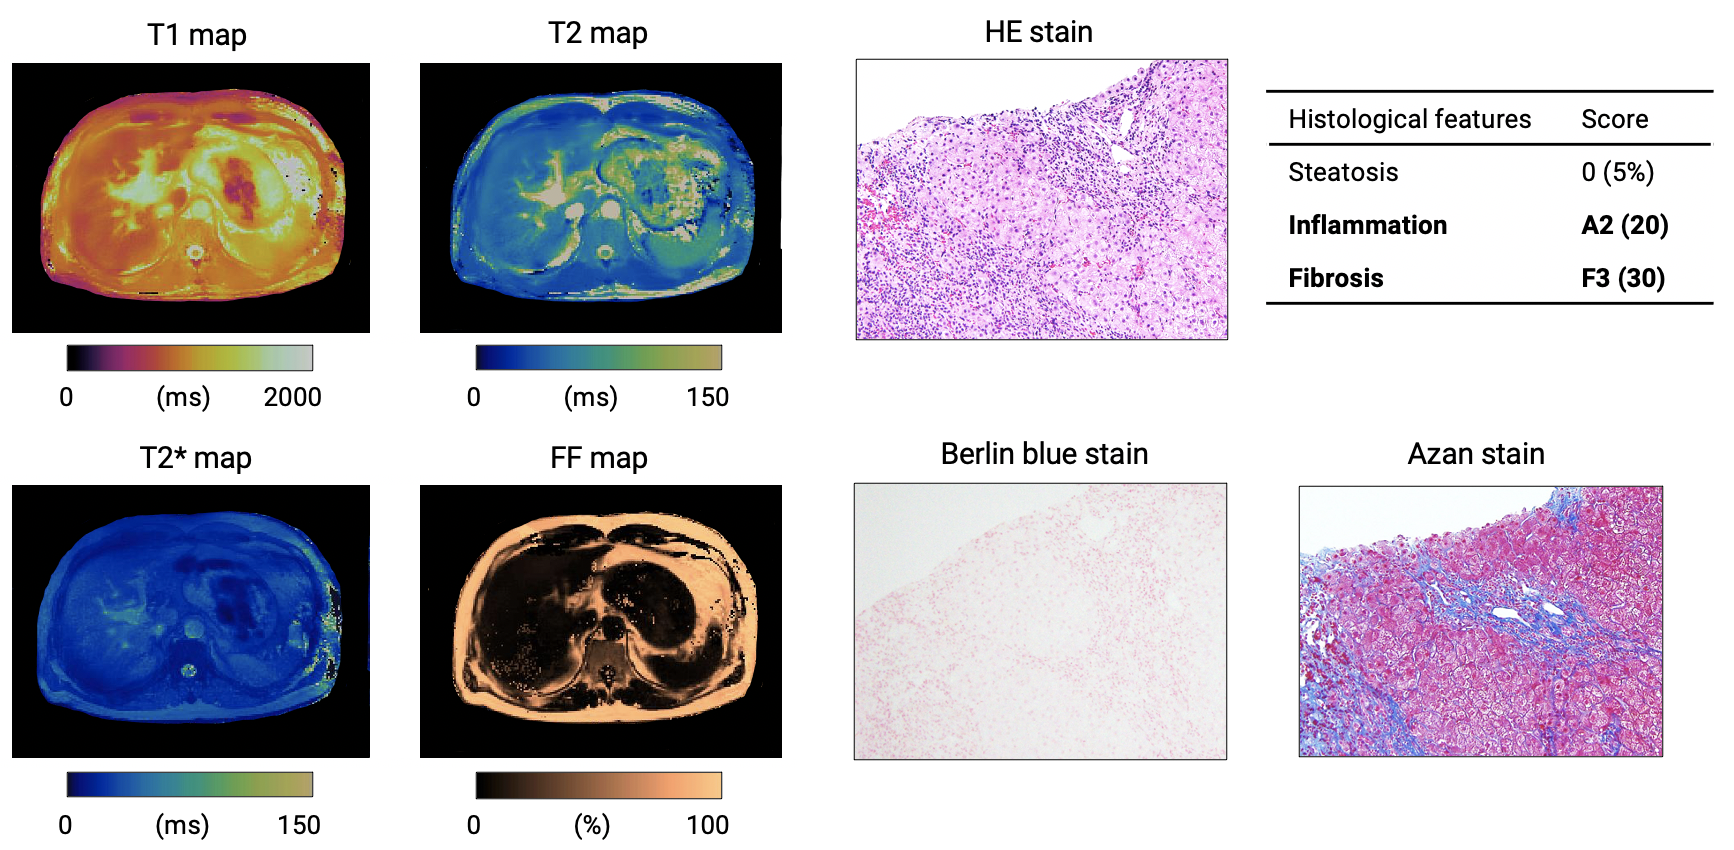
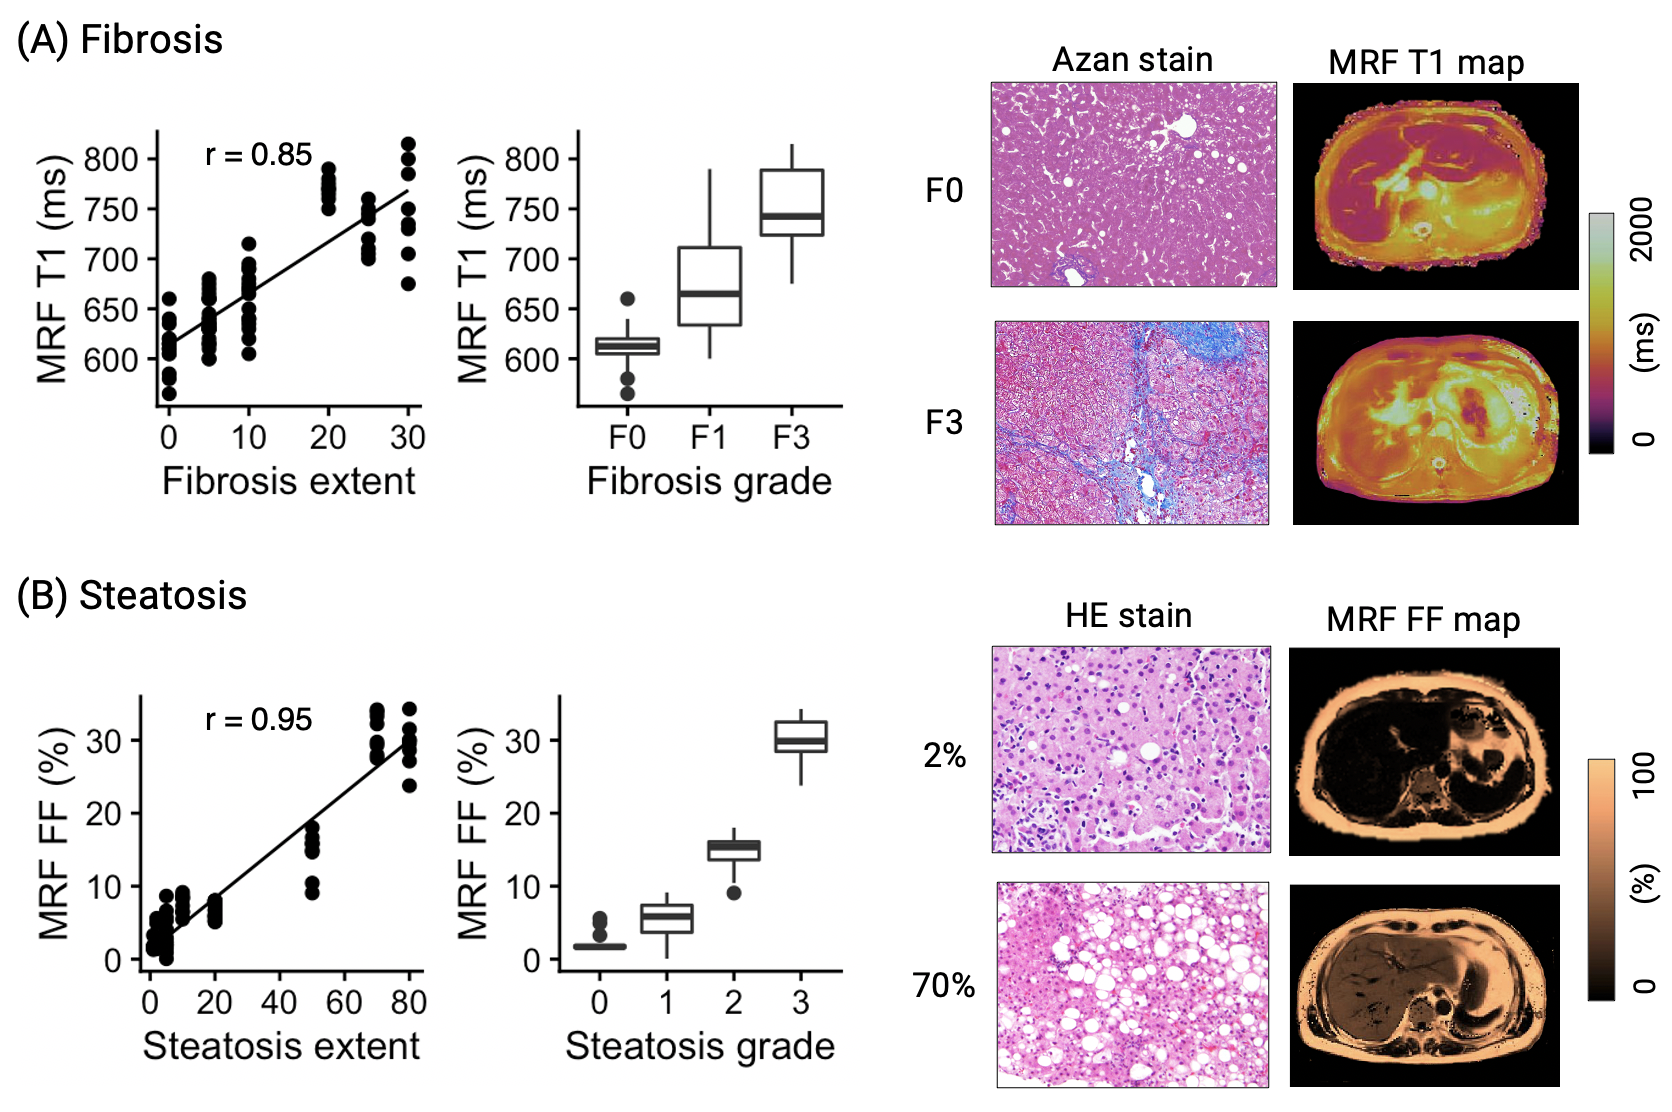
Representative maps and histology images of patients with severe steatosis and fibrosis are shown in Figures 3 and 4, respectively. MRF-derived metrics showed good agreement (r=0.85, r=0.95, and r=0.62 for fibrosis, steatosis, and inflammation, respectively) between histological evaluation of liver biopsies from patients with diffuse liver disease (Figure 5). After correcting for multiple comparisons, MRF showed significantly higher T1 values in patients with histologically proven fibrosis (P<0.01 for all combinations), higher FF in steatosis (P<0.01 for all combinations), and higher T1 values in inflammation (P<0.01 except for Grade 0 vs. 1, P=0.78).
Conclusion
Multi-parametric liver MRF provided repeatable T1, T2, T2*, and FF maps with high agreement with measurements of separate conventional quantitative mapping in patients with diffuse liver disease. Furthermore, measurements of liver MRF showed good agreement between the pathological grades of the liver biopsies. Future work will aim to increase the number of subjects with liver biopsy including siderosis as well as to assess longitudinal changes to monitor treatment response and disease progression.Acknowledgements
This work was supported by EPSRC (EP/V044087/1) and Fondecyt (1210637). We thank Masahiro Abe and Kazumasa Adachi for data handling.
References
- Curtis, William A et al. Quantitative MRI of Diffuse Liver Disease: Current Applications and Future Directions. Radiology vol. 290,1 (2019): 23-30.
- Banerjee, R. et al. Multiparametric magnetic resonance for the non-invasive diagnosis of liver disease. Journal of Hepatology 60, 69–77 (2014).
- Ma, D. et al. Magnetic resonance fingerprinting. Nature 495, 187–92 (2013).
- Jaubert O, Arrieta C, Cruz G, et al. Multi-parametric liver tissue characterization using MR fingerprinting: Simultaneous T1 , T2 , T2 *, and fat fraction mapping. Magn Reson Med. 2020;84(5):2625-2635.
- Seiberlich N, Gulani V, Campbell-Washburn A et al. Quantitative Magnetic Resonance Imaging, Volume 1 – 1st Edition. 2020.
- Jaubert O, Cruz G, Bustin A, et al. Water–fat Dixon cardiac magnetic resonance fingerprinting. Magn Reson Med. 2020;83:2107-2123.
- Lima da Cruz, Gastão et al. “Sparsity and locally low rank regularization for MR fingerprinting.” Magnetic resonance in medicine vol. 81,6 (2019): 3530-3543.
- Kleiner, David E et al. “Design and validation of a histological scoring system for nonalcoholic fatty liver disease.” Hepatology (Baltimore, Md.) vol. 41,6 (2005): 1313-21.
Figures