4197
Differentiation between rectal mucinous and common adenocarcinoma by amide proton transfer weighted and intravoxel incoherent motion imaging
Juan Li1, cheng jingliang1, and Lin Liangjie 2
1Department of MRI, The First Affiliated Hospital of Zhengzhou University, Zhengzhou, China, 2Philips Healthcare, Beijing, China
1Department of MRI, The First Affiliated Hospital of Zhengzhou University, Zhengzhou, China, 2Philips Healthcare, Beijing, China
Synopsis
Rectal mucinous adenocarcinoma (MC) is a typical subtype of rectal adenocarcinomas, which has a poor prognosis and it is not sensitive to neoadjuvant chemoradiotherapy thus associated with significantly different individualized treatments as those for rectal common adenocarcinoma (AC). The amide proton transfer (APT) weighted and intravoxel incoherent motion (IVIM) imaging were investigated in this study for differential diagnosis between MC and AC. Results indicated that APT signal intensity and the D value by IVIM can be used in discriminating between MC and AC, slightly inferior to the performance of apparent diffusion coefficient by conventional diffusion weighted imaging.
Introduction
Colorectal cancer is a common malignancy of the digestive system, 30-35% are occurred in the rectum, and 90% are classified as adenocarcinoma [1]. Rectal mucinous adenocarcinoma (MC) is a typical subtype of rectal adenocarcinomas, which has a poor prognosis and it is not sensitive to neoadjuvant chemoradiotherapy [2], and thus the selection of individualized treatment options for MC can be significantly different from those for rectal common adenocarcinoma (AC). Intravoxel incoherent motion (IVIM) provides diffusion and perfusion information within tissue through the biexponential modeling of images acquired by multiple b values [3]. Previous studies showed the ability of IVIM for the differential diagnosis of malignant and benign tumors, as well as reflect the biological behavior and predict prognosis [4]. Amide proton transfer (APT) weighted imaging is a noninvasive molecular imaging technique based on chemical exchange saturation transfer (CEST). It evaluates the endogenous moving proteins and peptides by detection of the reduction in bulk water intensity, which indirectly reflects changes of the internal metabolism [5]. This study aims to investigate the ability of APT and IVIM in differential diagnosis between MC and AC, compared with results by conventional diffusion weighted imaging (DWI).Methods
Preoperative pelvic MRI data of 110 patients (mean age: 60.31±10.84 years) with surgical pathologically confirmed diagnosis of rectal adenocarcinoma were retrospectively evaluated, including 17 MC cases and 93 AC cases. MRI scans were performed on a 3T scanner (Ingenia CX, Philips Healthcare, Best, the Netherlands) with a 32-channel phase array coil. Patients were instructed to empty the rectum before examination. To suppress intestinal movement artifacts, 20 mg raceanisodamine hydrochloride injection (Suicheng Pharmaceutical Co, Ltd.) was given intramuscularly 5-10 min before examination. The scanning sequences included T2WI, T1-weighted imaging (T1WI), DWI, APT, IVIM, and dynamic contrast-enhanced T1WI. Detailed parameters for the sequences were listed in Table 1. APT weighted images were acquired by using a 3D turbo spin echo (TSE) sequence for optimized signal-to-noise ratio. The continuous RF saturation for a duration of 2 seconds (each RF coil was turned on and off for 500 msec to generate four block RF pulses at 2 μT amplitude). Data were acquired with seven different saturation frequency offsets with respect to the water resonance (±3.5, ±3.42, ±3.58, −1560 ppm). A B0 map was derived from three echo acquisitions at +3.5 ppm for B0 correction. IVIM (with b values of 0, 10, 20, 50, 100, 200, 400, 800, 1200 s/mm2) were performed in the oblique axial plane using a single-shot echo planar imaging (ss-EPI) sequence with comparable parameters. The diffusion gradients were applied simultaneously along with three orthogonal directions. DWI (with b values of 50, 800 s/mm2) was also performed using the ss-EPI sequence. Parameters including APT signal intensity (APT SI), pure diffusion coefficient (D), pseudo-diffusion coefficient (D*), perfusion fraction (f), and apparent diffusion coefficient (ADC) were measured in different histopathologic types. Receiver operating characteristic (ROC) curves were used to evaluate the diagnostic efficacy, and the corresponding area under the curves (AUCs) were calculated. The t-test for independent samples was used to compare APT SI, D, D*, f and ADC parameters between pathological types (MC vs. AC). MedCalc v20.0 (MedCalc Software, Ostend, Belgium) was used to draw ROC curves, and the AUCs were calculated to evaluate its diagnostic efficiency. Differences with P<0.05 were considered statistically significant.Results
APT SI, D and ADC values of rectal mucinous adenocarcinoma (MC) were significantly higher than those of rectal common adenocarcinoma (AC) (Figures 1-2 and Table 2, all P<0.001). The ROC curves showed that the AUCs of APT SI, D and ADC values for distinguishing MC from AC were 0.921, 0.893 and 0.995 (Table 3), respectively. The comparison among these AUCs showed no significant difference (APT SI vs. D: Z=0.352, P=0.725; APT SI vs. ADC: Z=2.457, P=0.140; and D vs. ADC: Z=1.607, P=0.108; respectively).Discussion
The histopathologic type is an important prognostic factor for rectal cancer. In our study, we observed that APT SIs were significantly higher in MC than AC. According to the literature, APT SI was mainly contributed by the endogenous cellular proteins and peptides, and affected by intercellular pH environment. Otherwise, cell density, mucin and angiogenesis also have significant effects on APT SI [5]. MC is characterized by tumor cell hypersecretion, with more than 50% of mucus content in the tumor parenchyma [2], which may have contributed to the higher APT SIs. D is the pure diffusion coefficient representing pure molecular diffusion, D* is the pseudo-diffusion coefficient representing microperfusion related diffusion, while f is the perfusion fraction related to microcirculation. Our study also found that D and ADC values of MC were significantly higher than those of AC, which was in accordance with previous research [6]. Mucinous adenocarcinoma cells float on a layer of mucus in a relatively loose arrangement, which may decrease the cellularity and facilitate water molecule movement. The D* and f values showed no significant difference for distinguishing MC from AC, which may indicate the similar microperfusion component in these two types of lesions. In conclusion, APT SI and the D value by IVIM can be used in discriminating between MC and AC, slightly inferior to ADC.Acknowledgements
We sincerely thank the participants in this study.References
[1] Siegel RL, Miller KD, Goding Sauer A, et al. Colorectal cancer statistics, 2020. CA Cancer J Clin. 2020;70(3):145-164. doi:10.3322/caac.21601 [2] Reynolds IS, O'Connell E, Fichtner M, et al. Mucinous adenocarcinoma of the colon and rectum: A genomic analysis. J Surg Oncol. 2019;120(8):1427-1435. doi:10.1002/jso.25764 [3] Le Bihan D. What can we see with IVIM MRI?. Neuroimage. 2019;187:56-67. doi:10.1016/j.neuroimage.2017.12.062 [4] Lecler A, Duron L, Zmuda M, et al. Intravoxel incoherent motion (IVIM) 3 T MRI for orbital lesion characterization. Eur Radiol. 2021;31(1):14-23. doi:10.1007/s00330-020-07103-1 [5] Zhou J, Heo HY, Knutsson L, et al. APT-weighted MRI: Techniques, current neuro applications, and challenging issues. J Magn Reson Imaging. 2019;50(2):347-364. doi:10.1002/jmri.26645 [6] Lu B, Yang X, Xiao X, et al. Intravoxel Incoherent Motion Diffusion-Weighted Imaging of Primary Rectal Carcinoma: Correlation with Histopathology. Med Sci Monit. 2018;24:2429-2436. doi:10.12659/msm.908574Figures
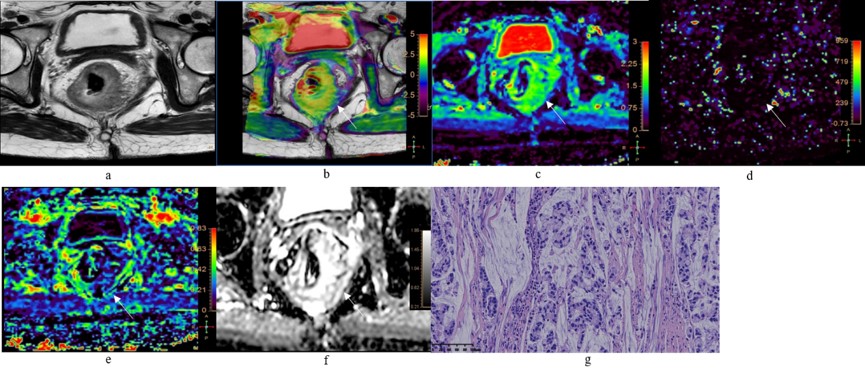
Figure
1. A 51-year-old female with MC. a: Oblique axial T2-weighted
image showed a mess with high intensity in the rectum. b: APT-T2 merged image showed
the mess with a mean APT SI of 3.4%. c-e: D, D* and f maps showed the mess with
values of 1.42×10⁻³ mm2/s, 5.00×10⁻³ mm2/s
and 0.22, respectively. f: The mass showed high intensity (1.87×10⁻³mm2/s)
on the ADC map. g: HE staining revealed mucinous adenocarcinoma. (×200)
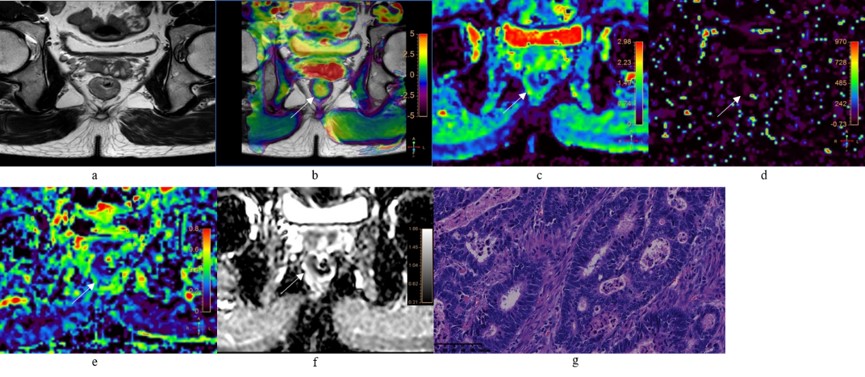
Figure 2. A 52-year-old male with AC of grade 2. a:
Oblique axial T2-weighted image showed a mess with slightly high
intensity in the rectum. b: APT-T2 merged image showed the mess with a mean APT
SI of 2.1%. c-e: D, D* and f maps showed the mess with values of 0.81×10⁻³
mm2/s, 7.74×10⁻³ mm2/s and 0.19, respectively.
f: The mass showed low intensity (1.03×10⁻³ mm2/s) on the
ADC map. g: HE staining revealed moderately differentiated adenocarcinoma.
(×200)
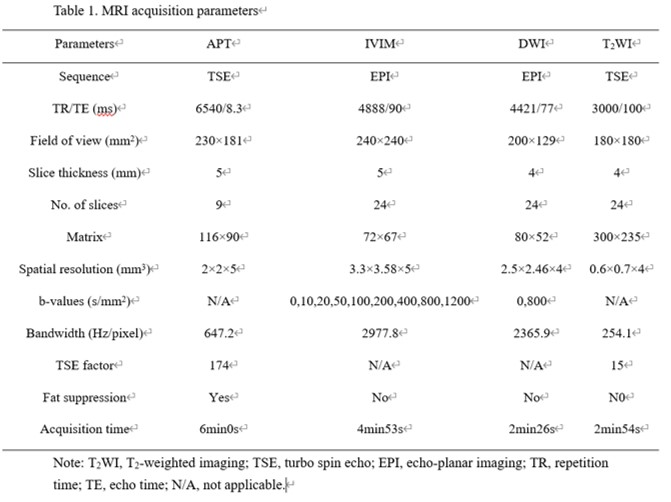
Table 1. MRI acquisition
parameters
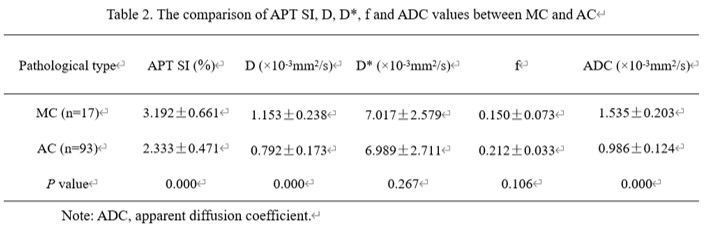
Table 2. The comparison
of APT SI, D, D*, f and ADC values between MC and AC
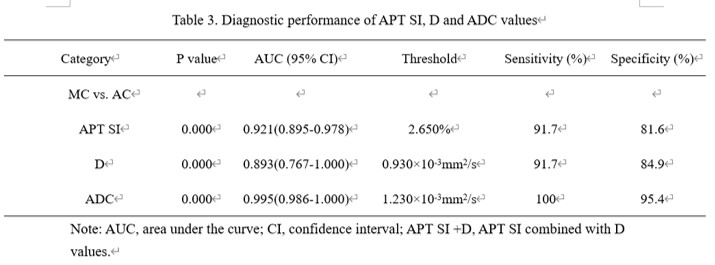
Table 3.
Diagnostic performance of APT SI, D and ADC values
DOI: https://doi.org/10.58530/2022/4197