4193
Noninvasive Diagnosis of Portal Hypertension and Detecting High Risk Gastroesophageal Varices in Chronic Liver Disease Patients with 4D Flow MRI1Biomedical Engineering, Center for Biomedical Imaging Research, Tsinghua Univ., Beijing, China, 2Radiology, Department of Radiology, The Fifth Medical Centre of Chinese PLA General Hospital, Beijing, China, 3First Liver Cirrhosis Diagnosis and Treatment Center, The Fifth Medical Center of Chinese PLA General Hospital, Beijing, China, 4CHESS Center, Institute of Portal Hypertension, The First Hospital of Lanzhou University, Lanzhou, China, 5Department of Radiology, First Center Hospital of Tianjin, Tianjin, China
Synopsis
Chronic liver disease patients commonly suffer from portal hypertension (PH), which could lead to gastroesophageal varices. Noninvasive methods to diagnose PH and to detect high risk varices are urgently needed. 4D Flow MRI is an advanced technique which could provide visualization and quantification of blood flow. In the study, we observed significant hemodynamic differences in portal vein between PH patients and controls. Similar differences were observed between patients with high risk and low risk varices. The performance of diagnosing PH/detecting high risk varices using the single hemodynamic parameter and the logistic regression model was acknowledged by the ROCs.
Introduction
Patients with chronic liver disease commonly suffer from portal hypertension (PH)1. Hepatic venous pressure gradient (HVPG) is the clinical standard for PH diagnosis, by which clinically significant portal hypertension (CSPH) is defined when HVPG is over 10mmHg2. However, HVPG is invasive, costly and not available in primary medical centers. Severe PH could lead to gastroesophageal varices. It’s a lethal complication and the timely clinical intervention of high risk varices is crucial1,3. Therefore, repetitive gastroscopy is needed to monitor the risk of variceal bleeding, which pose risks to patients4. Consequently, noninvasive methods to diagnose CSPH and detect high risk varices are urgently needed. 4D Flow MRI provides time-resolved, three-dimensional, three-directionally velocity-encoded flow information5. With this technique, visualization of blood flow and quantification of various hemodynamic parameters could be achieved. We hypothesize that the hemodynamic condition in the portal vein (PV) evaluated by 4D Flow MRI could help diagnose CSPH and detect high risk varices. The aims of the study are to: 1) utilize 4D Flow MRI to help diagnose CSPH; 2) utilize 4D Flow MRI to detect high risk varices.Materials and Methods
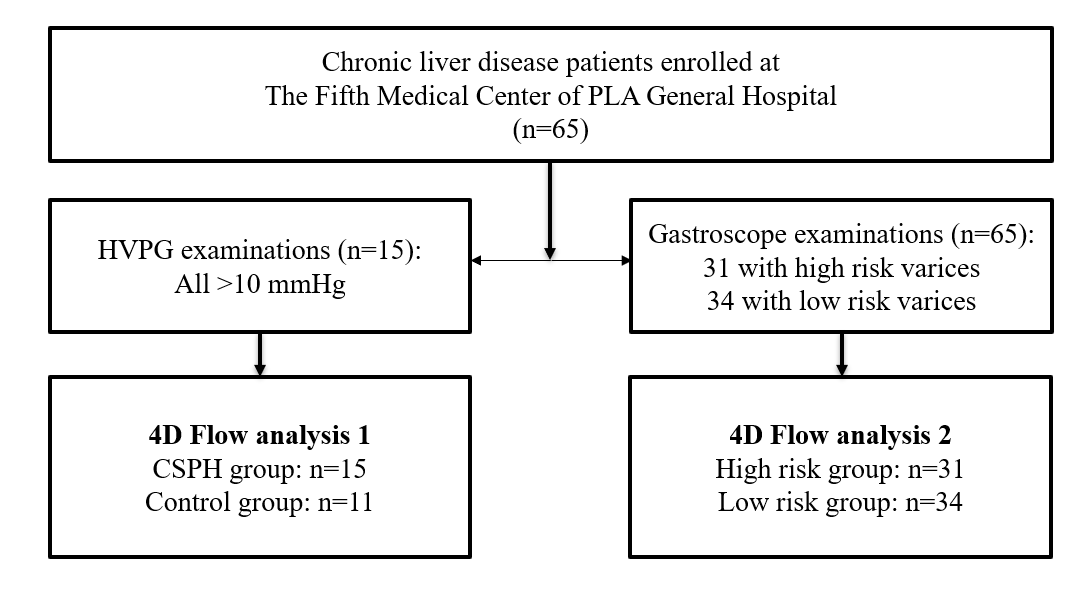
The study was approved by the local ethics review board. Written informed consent was obtained from all subjects.A total of 65 chronic liver disease patients were recruited at The Fifth Medical Center of Chinese PLA General Hospital. Among them, 15 patients underwent HVPG examinations according to clinical recommendation and all the 15 patients were diagnosed as CSPH (HVPG>10mmHg). All of the 65 chronic liver disease patients underwent gastroscopy to screen varices. And 31 patients were identified to have high risk varices by experienced doctors. Meanwhile, 11 healthy volunteers with no history of liver disease were recruited. All the subjects above underwent abdominal 4D Flow MRI scan with the same protocol. For patients, the scans were scheduled 1 week within the gastroscopy. Process of the subject recruitment is displayed in Figure 1.
The MRI examinations were performed on a 3T MR scanner (Philips Ingenia CX, Philips Healthcare, The Netherlands). The 4D Flow protocol was a free-breathing, respiratory navigator and peripheral pulse gated multi-shot TFE sequence with three-directionally velocity encoding. The Venc was 50/75/150 (RL/AP/FH) cm/s. With a SENSE (P, 1.5) acceleration, the nominal scan time is about 8 minutes.
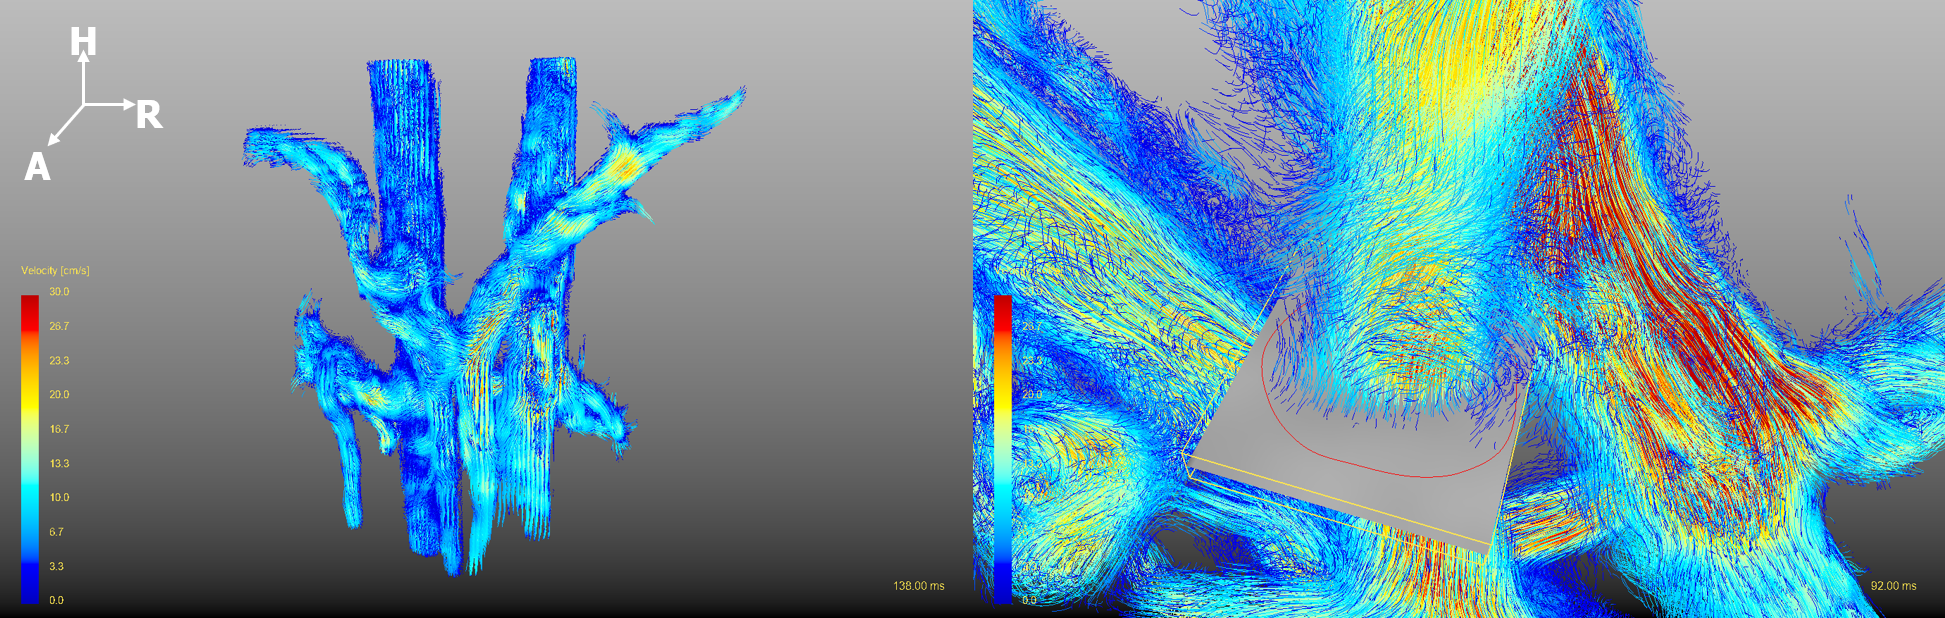
The pre-processing, visualization, and quantification of 4D Flow MRI data were performed with a commercial software GTFlow (GyroTools, Zurich, Switzerland). The pre-processing procedure included the correction of eddy current effect & velocity aliasing and the application of velocity & signal intensity masks. A vessel wall structure was segmented using the velocity mask, a visible path-line graph was generated from the velocity field. To quantify the hemodynamic parameters, a plane was created perpendicular to PV at liver hilum. A contour was drawn manually inside the plane to cover all the blood flow, as shown in Figure 2. Inside the contour, the flow volume in one cardiac cycle (Qcyc), the average velocity of the flow (Vmean), the peak velocity (Vmax) and the regurgitant fraction (R%) were measured. Specially, Qcyc was divided by body weight to be normalized for the following analysis (denoted as Qnormal).
For aim1, a set of Student t-tests of the parameters measured from 4D Flow MRI were operated between the 15 CSPH patients and 11 healthy volunteers. A logistic regression (LR) model with L1 penalty including all the parameters was applied to help recognize CSPH patients. The diagnostic performance of CSPH using the single parameter and the LR model was evaluated by the receiver operating characteristic curves (ROC) respectively. For aim2, a set of Student t-tests of the parameters were operated between the 31 patients with high risk varices and 34 patients with low risk varices. An LR model with L1 penalty including all the parameters was applied to help recognize patients with high risk varices. The performance of detecting high risk varices using the single parameter and the LR model was evaluated by the ROCs respectively.
Results
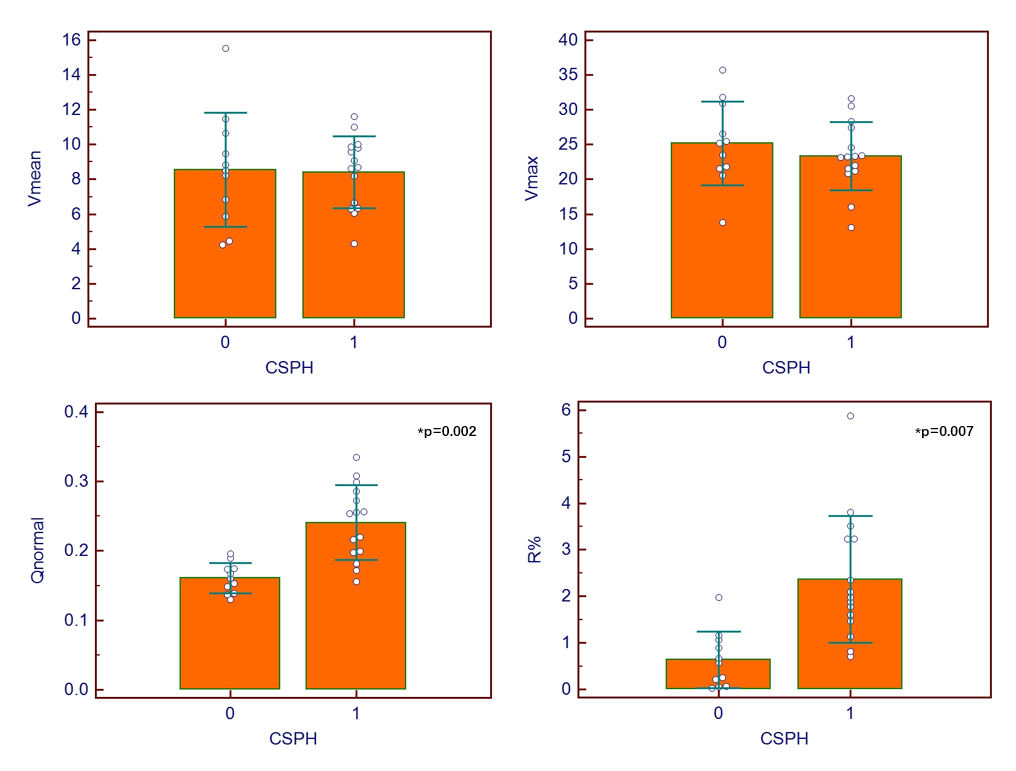
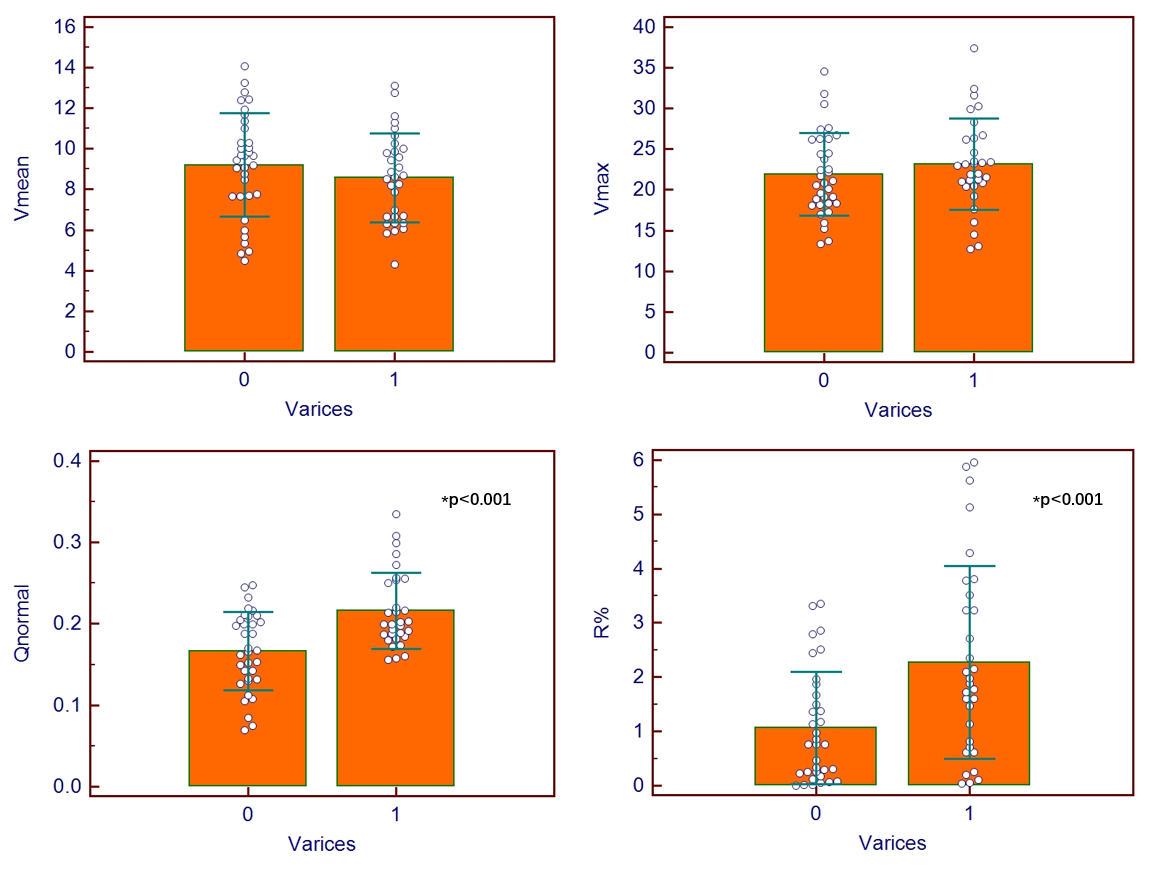
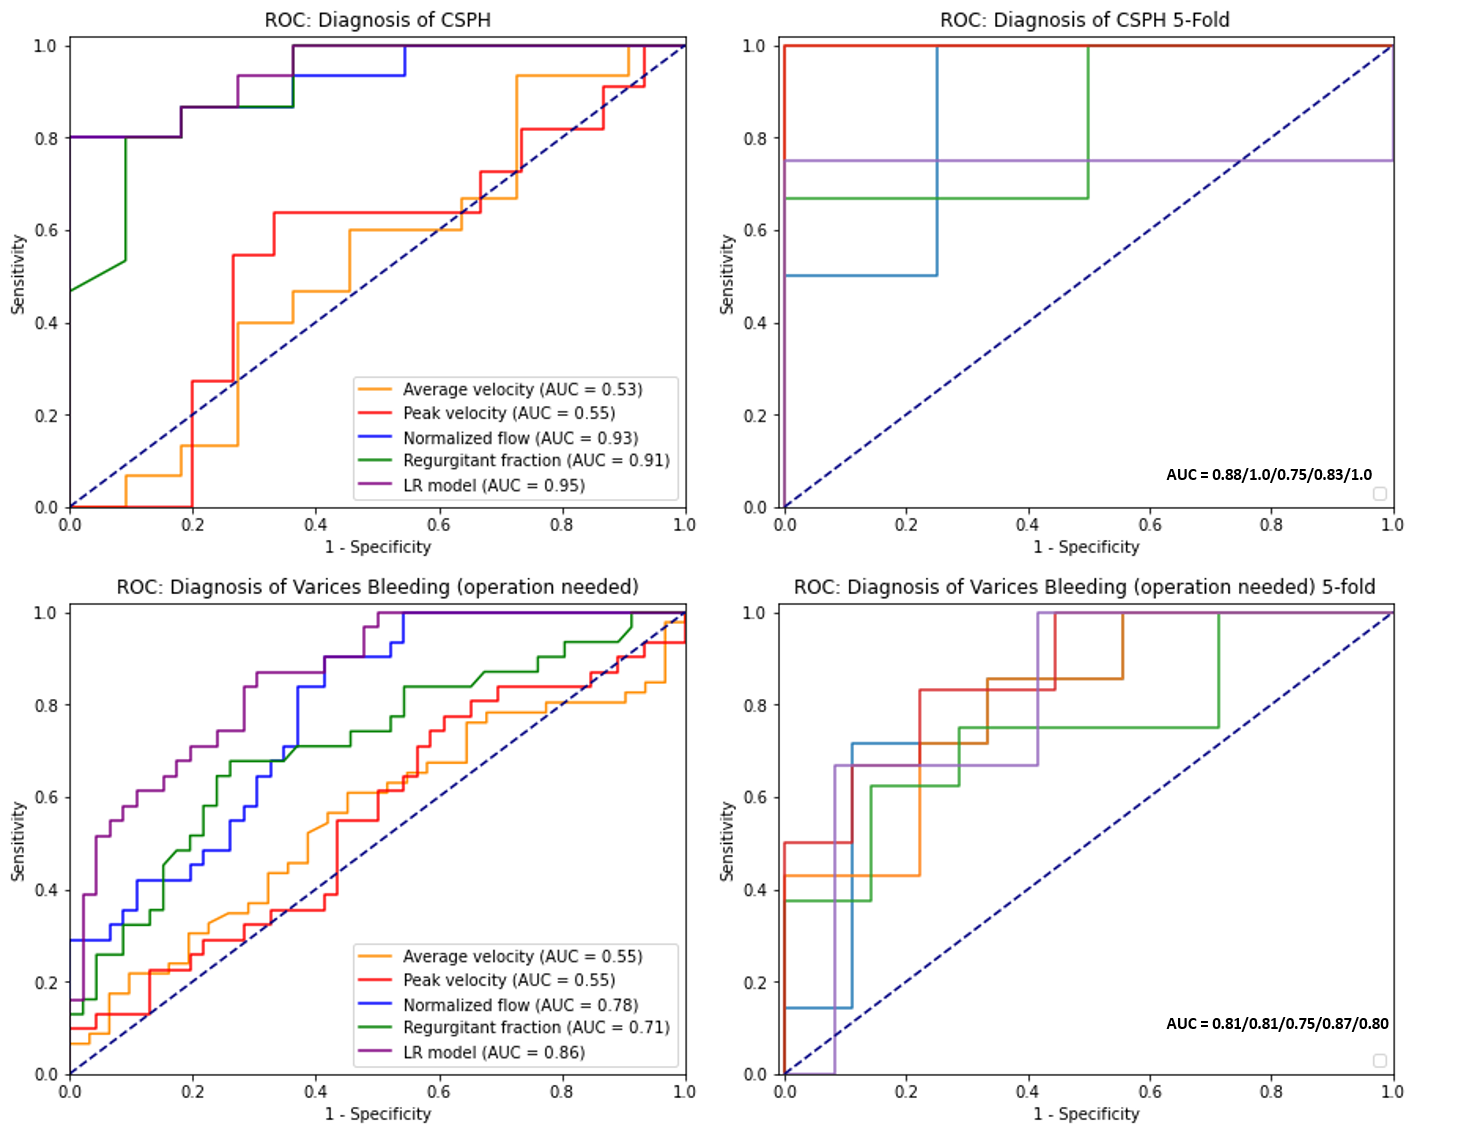
The reproducibility of the measurement of the parameters has been verified in the pilot study6. As shown in Figure 3 and 4, CSPH patients have significantly higher Qnormal and R% than healthy volunteers, patients with high risk varices also have significantly higher Qnormal and R% than patients with low risk varices. The 2 hemodynamic parameters and the LR model showed good performance in the diagnosis of CSPH and the detection of high risk varices, as the ROCs displayed in Figure 5.Discussion and Conclusion
The results indicated significantly higher normalized flow volume in PV of CSPH patients and patients with high risk varices. This phenomenon could be explained by the systematic vasodilatation and hypervolemia of PH patients7. We also observed significantly higher regurgitant fraction in CSPH patients, which could result from the elevated resistance to the blood from the liver. The hepatofugal flow is a risk factor of gastroesophageal varices8, which could explain the higher R% in patients with high risk varices. The great performance of CSPH diagnosis and high risk varices detection with flow information from 4D Flow MRI indicate that, as a noninvasive imaging modality, we could expect 4D Flow MRI to become a potential biomarker in diagnosing CSPH and detecting high risk varices.Acknowledgements
No acknowledgement found.References
1. Tsochatzis EA, Bosch J, Burroughs AK. Liver cirrhosis. Lancet 2014;383(9930): 1749–1761.
2. De Franchis R; Baveno VI Faculty. Expanding consensus in portal hypertension: report of the Baveno VI Consensus Workshop—stratifying risk and individualizing care for portal hypertension. J Hepatol 2015;63(3):743–752.
3. Garcia-Tsao G. Management of Varices and Variceal Hemorrhage in Cirrhosis[J]. New England Journal of Medicine, 2010, 362(9):823-832.
4. Leffler DA, Kheraj R, Garud S, et al. The incidence and cost of unexpected hospital use after scheduled outpatient endoscopy. Arch Intern Med 2010;170(19): 1752–1757.
5. Markl M, Frydrychowicz A, Kozerke S, et al. 4D flow MRI[J]. Journal of Magnetic Resonance Imaging, 2012, 36(5):1015-1036.
6. Ji J, et al. Noninvasive Diagnosis of Portal Hypertension and Screening Varices with 4D Flow MRI: A Pilot Study; 2021 ISMRM & SMRT Annual Meeting & Exhibition #2119.
7. Shung D L, Guadalupe Garcia‐Tsao. Liver Capsule: Portal Hypertension and Varices: Pathogenesis, Stages, and Management[J]. Hepatology, 2017, 65(3).
8. Motosugi U, A Roldán-Alzate, Bannas P, et al. Four-dimensional Flow MRI as a Marker for Risk Stratification of Gastroesophageal Varices in Patients with Liver Cirrhosis[J]. Radiology, 2018.
Figures