4192
A comparative study of multi-parameters from Gd-EOB-DTPA-enhanced MRI in the assessment of liver function in patients with cirrhosis.
Yexin He1, Jia Shao1, Jinxia Guo2, Qiang Gao1, and Cheng Xu1
1SHANXI PROVINCIAL PEOPLE'S HOSPITAL, Taiyuan, China, 2GE Healthcare, Beijing, China
1SHANXI PROVINCIAL PEOPLE'S HOSPITAL, Taiyuan, China, 2GE Healthcare, Beijing, China
Synopsis
Gd-EOB-DTPA-enhanced MRI was used to quantitatively assess liver function benefiting the follow-up of patients with chronic liver disease and the appropriate plan for liver cancer treatment. A systematic multi-parametric analysis with non-enhanced and Gd-EOB-DTPA-enhanced T1 weighted and T1 mapping MRI were conducted to assess the liver function in patients with cirrhosis. Independent factor for differentiation of A+N(normal and Child-Pugh A) and B+C (Child-Pugh B and C) were found to be RE_Liver, T1_Native, T1_Post and ΔT1_Liver, while for differentiation of Child-Pugh B and C were found to be ΔT1_Liver and SIR_Bdult/Muscle. Both combined model with these factors obtained better diagnostic performance.
Introduction and purpose
The uptake and excretion of Gd-EOB-DTPA depends on the integrity of hepatocyte function. When liver function is impaired, hepatocyte uptake of the contrast agent is reduced, and the excretion of the contrast agent into the bile duct will cost more time. The change of signal intensity and T1 relaxation time between non-enhanced and Gd-EOB-DTPA-enhanced imaging in the liver parenchyma will be different in patients with impaired liver function [1]. Various studies have been estimated liver function by using Gd-EOB-DTPA-enhanced MRI for patient with cirrhosis. Parameters, such as intensity parameters[2], T1 relaxation time parameters[3] , and the level of enhancement of the bile duct[4], have been evaluated. But the ability for the parameters varies in different studies and few study focused on the patients with high-grade liver function injury due to lack of data. This study aims to do a systematic multi-parameter assessment of normal people and Child-Pugh A, B, C cirrhosis patients based on the Gd-EOB-DTPA-enhanced imaging.Materials and Methods
84 Patients with cirrhosis and 42 subjects with normal liver function were collected, and the patients were graded to level A (42), B (28) and C (12) by using the Child-Pugh Score. Unenhanced T1 weighted imaging with LAVA-Flex acquisition, Smart-T1 mapping [5] were performed. After the Gd-EOB-DTPA(Primovist; Bayer Schering Pharma, Berlin, Germany) with dose of was 0.025 mmol/kg was injected intravenously at a rate of 1.0 mL/s and flushed with a bolus of saline (NaCl, 0.9%) at the same rate, a dynamic 5-phase imaging (10sec / phase) was conducted to get images of the arterial phase, portal vein phase, and transitional phase. The hepatobiliary phase was scanned at 18 min post the Gd-EOB-DTPA injection followed the enhanced LAVA-Flex T1W and Smart-T1 mapping. The acquisition parameters for LAVA-Flex T1: TR/TE = 2.8/1.3 ms, slice thickness = 4.0 mm, FOV = 400 mm, matrix = 288 × 170, flip angle = 12; and for Smart-T1 mappping: TR/TE/TI = 3.3/1.5/100 ms, slice thickness = 10.0 mm, FOV = 360 mm, phase FOV = 0.75, matrix = 192 × 128, flip angle = 45, number of slices = 10, scanning time = 15s/slice.. ROIs with a volume of 58 mm2 were placed on the three slices with largest area in each hepatic segment, the liver, the spleen and the muscle on non-enhanced and enhanced Lava-flex T1W and the T1 map (Figure 1). Then the parameters including relative enhancement(RE_Liver), hepatobiliary phase liver-spleen signal ratio (SI_Liver/Spleen), hepatobiliary phase liver-vertebral muscle signal ratio (SI_Liver/Muscle), contrast enhancement index (spleen as the reference standard, CEI_Liver/Spleen), contrast enhancement index (erector spinae muscle as the reference standard, CEI_Liver/Muscle), T1 relaxation time reduction rate(ΔT1_Liver), bile duct signal intensity contrast ratio (erector spinae muscle as the reference standard, SIR_Bdult/Muscle) were calculated. All data were analyzed using SPSS 25.0 statistical software. After checking the normality and homogeneity of variances, one-way ANOVA or Kruskal-Wallis was used for the parameters’ comparison between groups as well as the post-hoc comparison with Tukey HSD or Steel Dwass. Univariate and multivariate logistic regression was used to find the independent factor for differentiating the normal/Child-Pugh (A+N), and Child-Pugh B/C (B+C) as well as Child-Pugh B and C. The differentiation performances were also assessed with receiver operating characteristic (ROC) curve analysis. P < 0.05 indicated significant difference.Results
As shown the comparison results in Figure 2, there were significant differences between each two groups for RE_liver and T1_Post. The logistic regression and ROC analysis for A+N/B+C (Figure 3 A, Table 1) and B/C differentiation (Figure 3B, Table 2) indicated that the RE_Liver (AUC =0.866 ), T1_Native (AUC =0.734), T1_Post(AUC = 0.893), ΔT1_Liver(AUC =0.787) were independent factor for A+N and B+C differentiation while the ΔT1_Liver (AUC =0.798) and SIR_Bdult/Muscle (AUC =0.827) for Child-Pugh B and C differentiation. Both the combined model with these indexes had the highest AUC (0.922 for A+N/B+C, 0.887 for B/C) in compare each index.Discussion
There were significant differences of RE_Liver and T1_Post between each two groups , indicates that these two quantitative parameters were highly sensitive to cirrhosis grades, which have also been found in the previous research[6]. The SI_Liver/Muscle and CEI_Liver/Spleen could well distinguish the A+N and B+C group, but not were not sensitive to the differences of adjacent grade, which both were finally found not the independent factor. The CEI_Liver/Muscle and SIR_Bduct/Muscle well distinguished the Chlid-Pugh B and C group. It may because that the cirrhosis often accompany portal hypertension, thus the splenic vein pressure will be elevated and the spleen is in a stagnant state, but the erector spinae does not have the above situation. Combined model for A+N and B+C showed higher AUC and sensitivity but slight decreased specificity because of low specificity of ΔT1_Liver. More cases of Chlid-Pugh B and C were enrolled in this study in compare with previous investigation[3, 6, 7]. As the SIR_Bduct/Muscle potentially reflected the ability of hepatocytes excreted the contrast, it greatly improved the specificity of Chlid-Pugh B and C differentiation in the combined model.Conclusion
The signal ratio and T1 value quantification in non-enhanced and Gd-EOB-DTPA-enhanced MRI can provide effective biomarker for evaluating cirrhosis in various severity. Combined model with the parameters can benefit the differentiation of A+N/B+C and B/C.Acknowledgements
No acknowledgement found.References
1.Bernard E, Van Beers, Catherine M. Pastor, et al.Primovist, Eovist: What to expect?Journal of Hepatology,2012,57(2):421-429. 2.Michael Haimerl, Niklas Verloh, Florian Zeman, et al. Gd-EOB-DTPA-enhanced MRI for evaluation of liver function:Comparison between signal intensity-based indices and T1 relaxometry. Sci Rep,2017,7(1):43347. 3.Jeong Hee Yoon, Jeong Min Lee, Hyo-jin Kang, et al. Quantitative Assessment of Liver Function by Using Gadoxetic Acid–enhanced MRI: Hepatocyte Uptake Ratio. Radiology, 2019,290(1):125-133. 4.Yoshifumi Noda, Satoshi Goshima, Kimihiro Kajita, et al. Biliary tract enhancement in gadoxetic acid-enhanced MRI correlates with liver function biomarkers. Eur J Radiol, 2016,85(11): 2001-2007. 5.Shunsuke Matsumoto,Shigeo Okuda,Yoshitake Yamada, et al.Myocardial T1 values in healthy volunteers measured with saturation method using adaptive recovery times for T1 mapping (SMART1Map) at 1.5 T and 3 T. Heart Vessels,2019 Nov;34(11):1889-1894. 6.Takashi Katsube, Masahiro Okada, Seishi Kumano, et al. Estimation of Liver Function Using T1 Mapping on Gd-EOB-DTPA-Enhanced Magnetic Resonance Imaging. Invest Radiology, 2011,46(4): 277-283. 7.Mao‑Tong Liu, Xue‑Qin Zhang,Jian Lu, et al. Evaluation of liver function using the hepatocyte enhancement fraction based on gadoxetic acid-enhanced MRI in patients with chronic hepatitis B. Abdom Radiol.2020 Oct;45(10):3129-3135.Figures
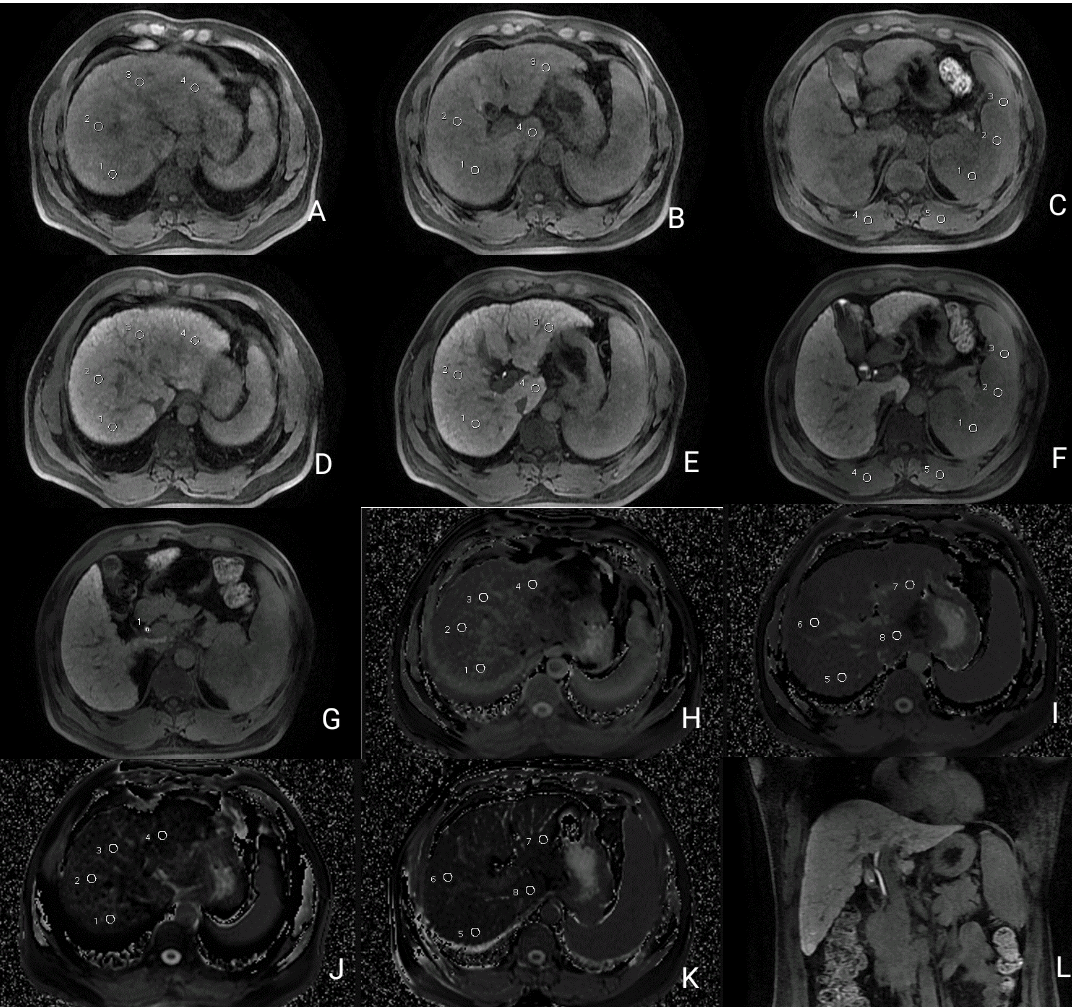
An example of ROI measurement. A-F: Signal
intensity measurement of S1-8 segment of liver, spleen, and erector spinae
muscle in the hepatobiliary specific phase; G: Signal intensity measurement of
common bile duct in the hepatobiliary specific phase; H-K: T1 relaxation time
measurement of S1-8 segment of liver; L: extrahepatic bile duct in the
hepatobiliary specific phase.
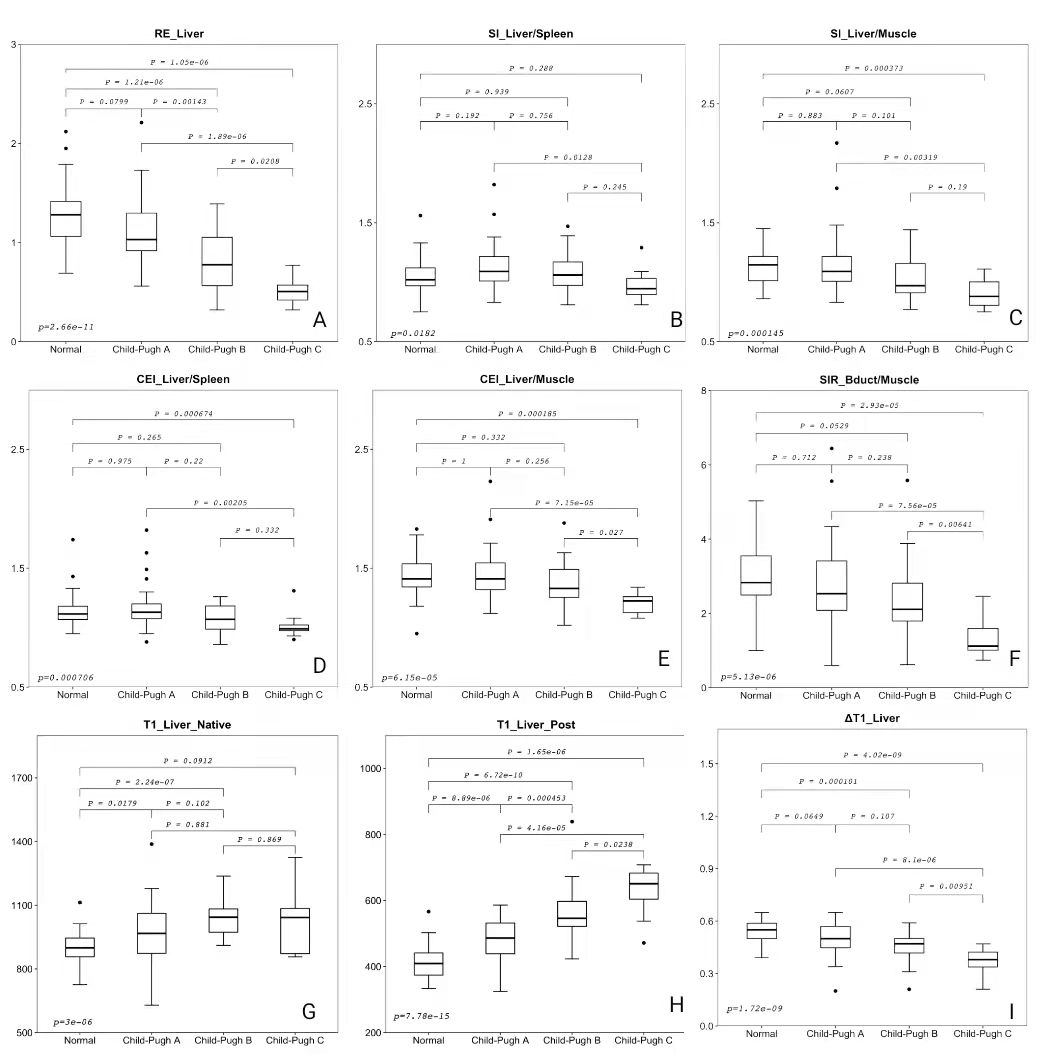
Comparison
of imaging parameters between normal control,
Child-Pugh A, B and C groups. (A) RE_Liver; (B) SI_Liver/Spleen), (C)
SI_Liver/Muscle, (D)CEI_Liver/Spleen,(E)CEI_Liver/Muscle,(F) SIR_Bdult/Muscle ,
(G)T1_Liver_Native, (H) T1_Liver_Post, (I)ΔT1_Liver.
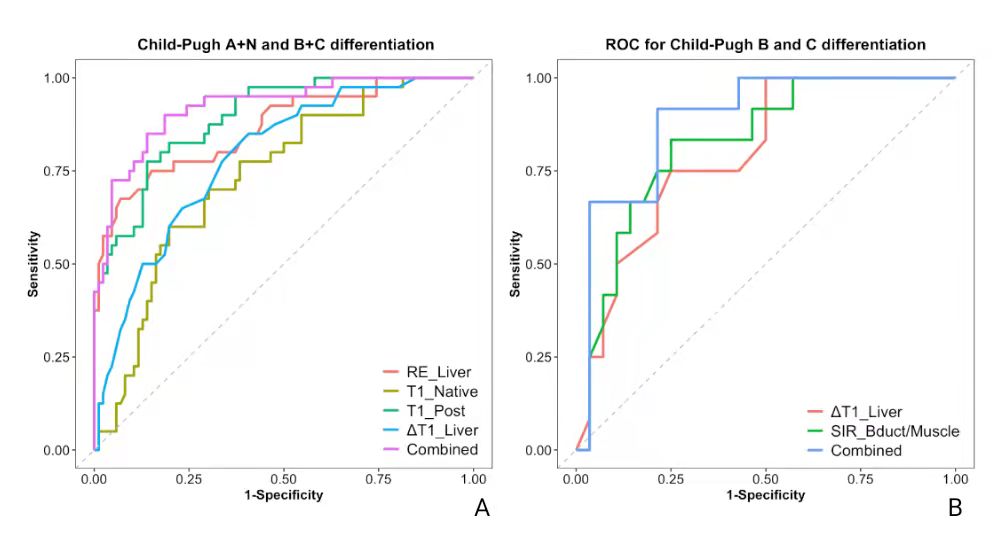
ROC
analysis for differentiating the Chlid-Pugh A+N group from the Chlid-Pugh B+C
group (A) and Chlid-Pugh B group from Chlid-Pugh C group (B). The combined
represents the multi-parametric model generated by the multi-variate
regression.
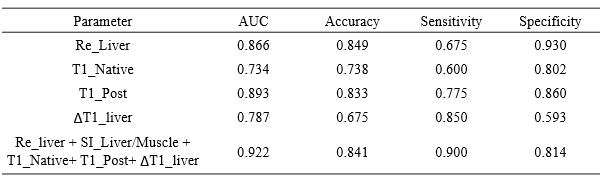
Table1.
The performance of each single index and the combined regression model for
differentiating the Chlid-Pugh A+N and Chlid-Pugh B+C group.
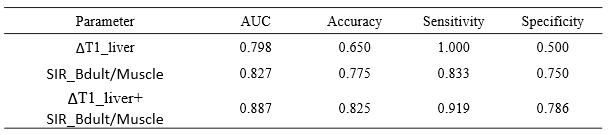
Table2.
The performance of each single index and the combined regression model for
differentiating the Chlid-Pugh B and Chlid-Pugh C group.
DOI: https://doi.org/10.58530/2022/4192