4191
NAFLD and Hepatic Inflammation: Multi-modal MR-Investigations of Disease Progression1Department of Biomedical Engineering (IMT), Linköping University, Linköping, Sweden, 2Department of Radiation Physics, Radiology, Department of Medical and Health Sciences, Linköping University, Linköping, Sweden, 3Center for Medical Image Science and Visualization (CMIV), Linköping University, Linköping, Sweden, 4Department of Gastroenterology and Hepatology, Department of Health, Medicine and Caring Sciences, Linköping University, Linköping, Sweden, 5Imaging Sciences & Biomedical Engineering, Kings College, London, United Kingdom, 6LVTS, INSERM U1148, Paris, France, 7Department of Clinical Pathology and Clinical Genetics, Department of Biomedical and Clinical Sciences, Linköping University, Linköping, Sweden
Synopsis
Several MR-biomarkers characterizing different aspects of NAFLD progression, especially for the early onset, and late stages, are available. However, there is a need to combine and characterize, not only the endpoints but also the intermediate stages of the disease, in particular the early stages of hepatic inflammation. Using an extensive multi-modal MRI protocol, we have investigated correlations between different MR-biomarkers with histopathology measurements of hepatic inflammation, fat accumulation and fibrosis. The long-term aim of this research is to characterize each patient in the early to intermediate stages of disease progression, with a higher degree of precision.
Introduction
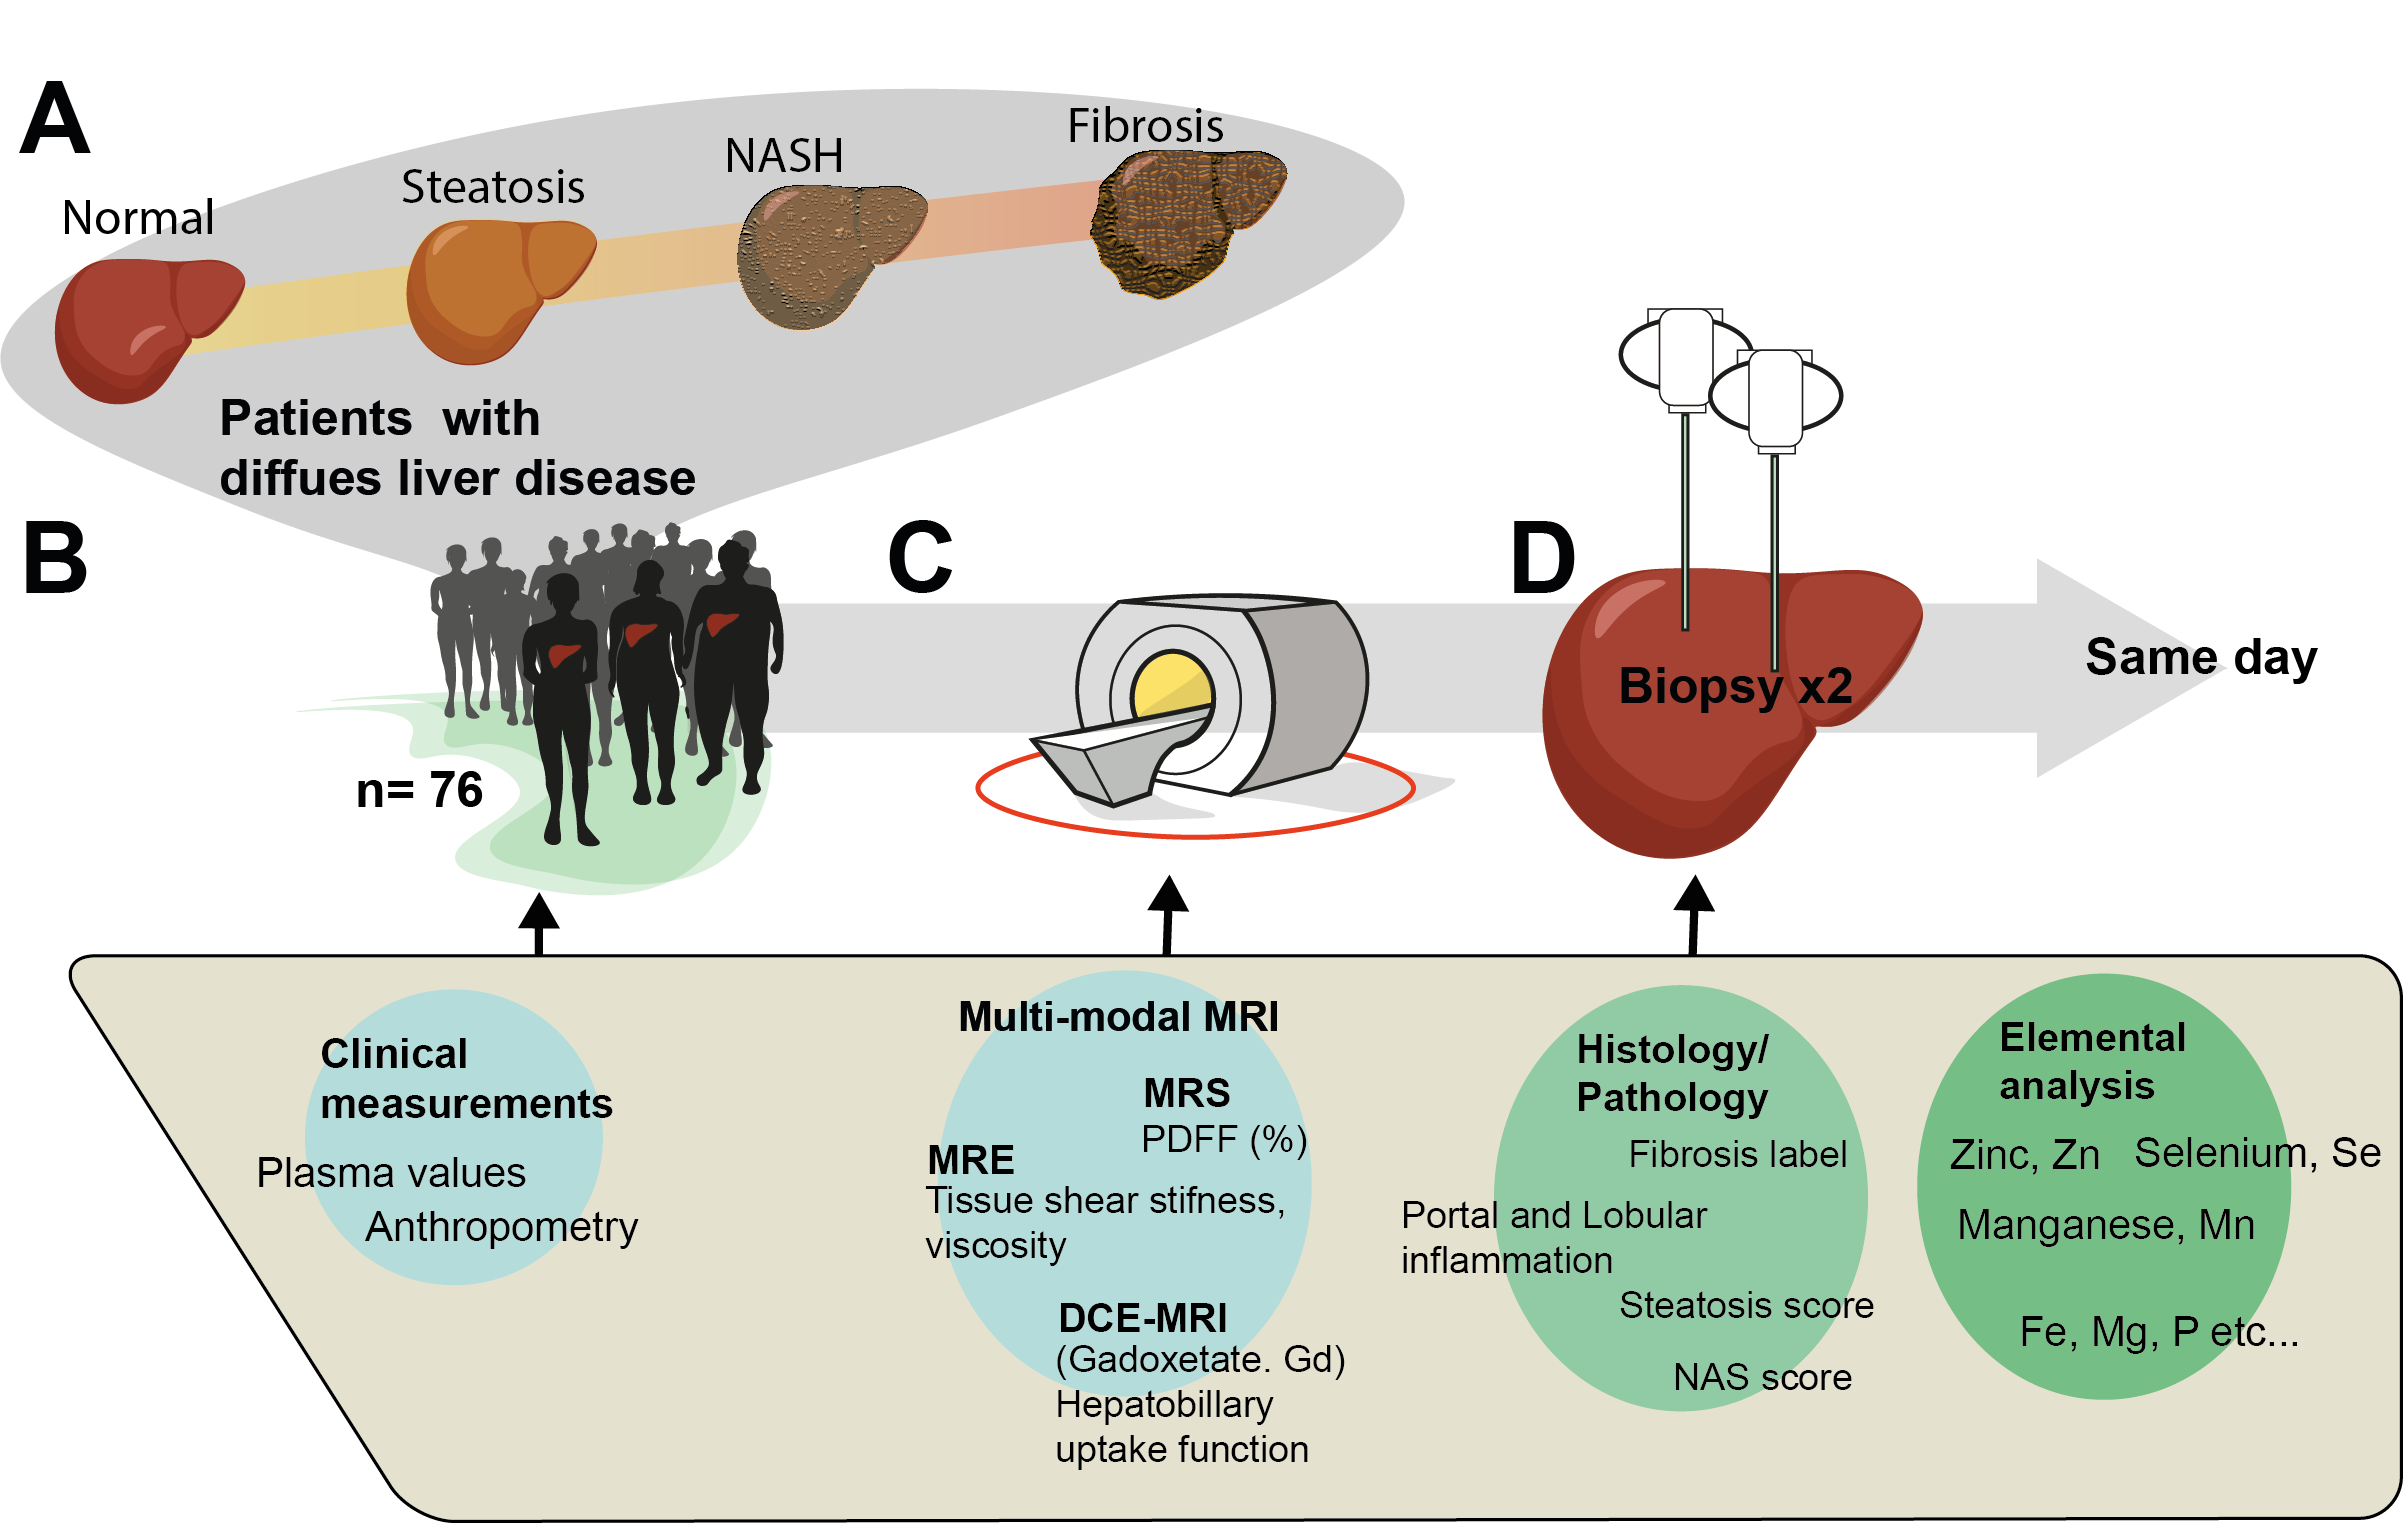
Due to the increased global prevalence of non-alcoholic fatty liver disease (NAFLD), there is a significant need for precise and non-invasive clinical methods to detect early stages of non-alcoholic steatohepatitis (NASH) and fibrosis progression. Today, there exists several MR-biomarkers characterizing different aspects of this disease progression, especially for the early onset, and late stages. For example, hepatic fat infiltration (steatosis) is commonly measured using ‘Proton Density Fat Fraction’ (PDFF) determined by 1H-MRS. Also, the extent of fibrosis can be measured using MR-elastography (MRE) by estimating the shear wave stiffness of the hepatic tissue. However, there is a need to characterize, not only the endpoints (Fig 1A), but also the intermediate stages of the disease, including the early stages of NASH.In this study, our aim was to characterize a pilot cohort of patients in different stages of NAFLD progression, using a multimodal MR-protocol (Fig 1C), with the focus on possible biomarkers for NASH. One such biomarker could be obtained using MRE, as it has been shown recently that 3D MRE can potentially be used to measure inflammation in the liver (1). As a reference, we acquired dual needle biopsies for both histological information and elemental analysis of biopsies for Zinc (Zn), Selenium (Se) and Manganese (Mn). The latter elements are all part of the reactions of the superoxide dismutase complex, which is correlated to cellular oxidative stress.
Methods
Seventy-six patients with diffuse liver disease (Fig 1A-B) were included in total, and a sub analysis of these data is reported here. The study setup is shown in Fig 1B-D). All patients underwent an extensive MR-investigation, including 3D-MRE, MRS, DCE-MRI (the latter is not shown here) (Fig 1C). Within a few hours, dual needle biopsies were obtained, and the patients were then monitored at the hospital. The study was approved by the Swedish Ethical Review Authority (EPM).MR was performed using a Philips Achieva dStream 3.0 T scanner (Philips Healthcare, Best, The Netherlands). Briefly, an active electrodynamic transducer (Philips Medical, Hamburg, Germany), positioned on the right side of the patient at the level of the liver, was used to transmit mechanical waves at 54 Hz. Images were then acquired in four separate breath-holds, and nine slices were obtained using a slice thickness of 4 mm. Regions of interests (ROIs) were drawn on the reconstructed image maps, and the same reconstruction methods as in Sinkus et al (1) were used. The complex shear modulus was used to calculate (i) shear stiffness (GAbs,Abs(G*) ), (ii) shear loss (GL, Im (G*)) and (iii) storage modulus (Re (G*)). Also, (iv) the shear wave attenuation (α, 1/mm) and (v) shear wave speed (cs, m/s) were determined. Liver PDFF was measured using 1H-MRS as described previously (2, 3). Post-processing of the MRS-data was performed by quantifying the integrals of water and fat resonances, respectively, using jMRUI and the AMARES algorithm (4, 5). The integrals were corrected for differences in T1 and T2.
Results
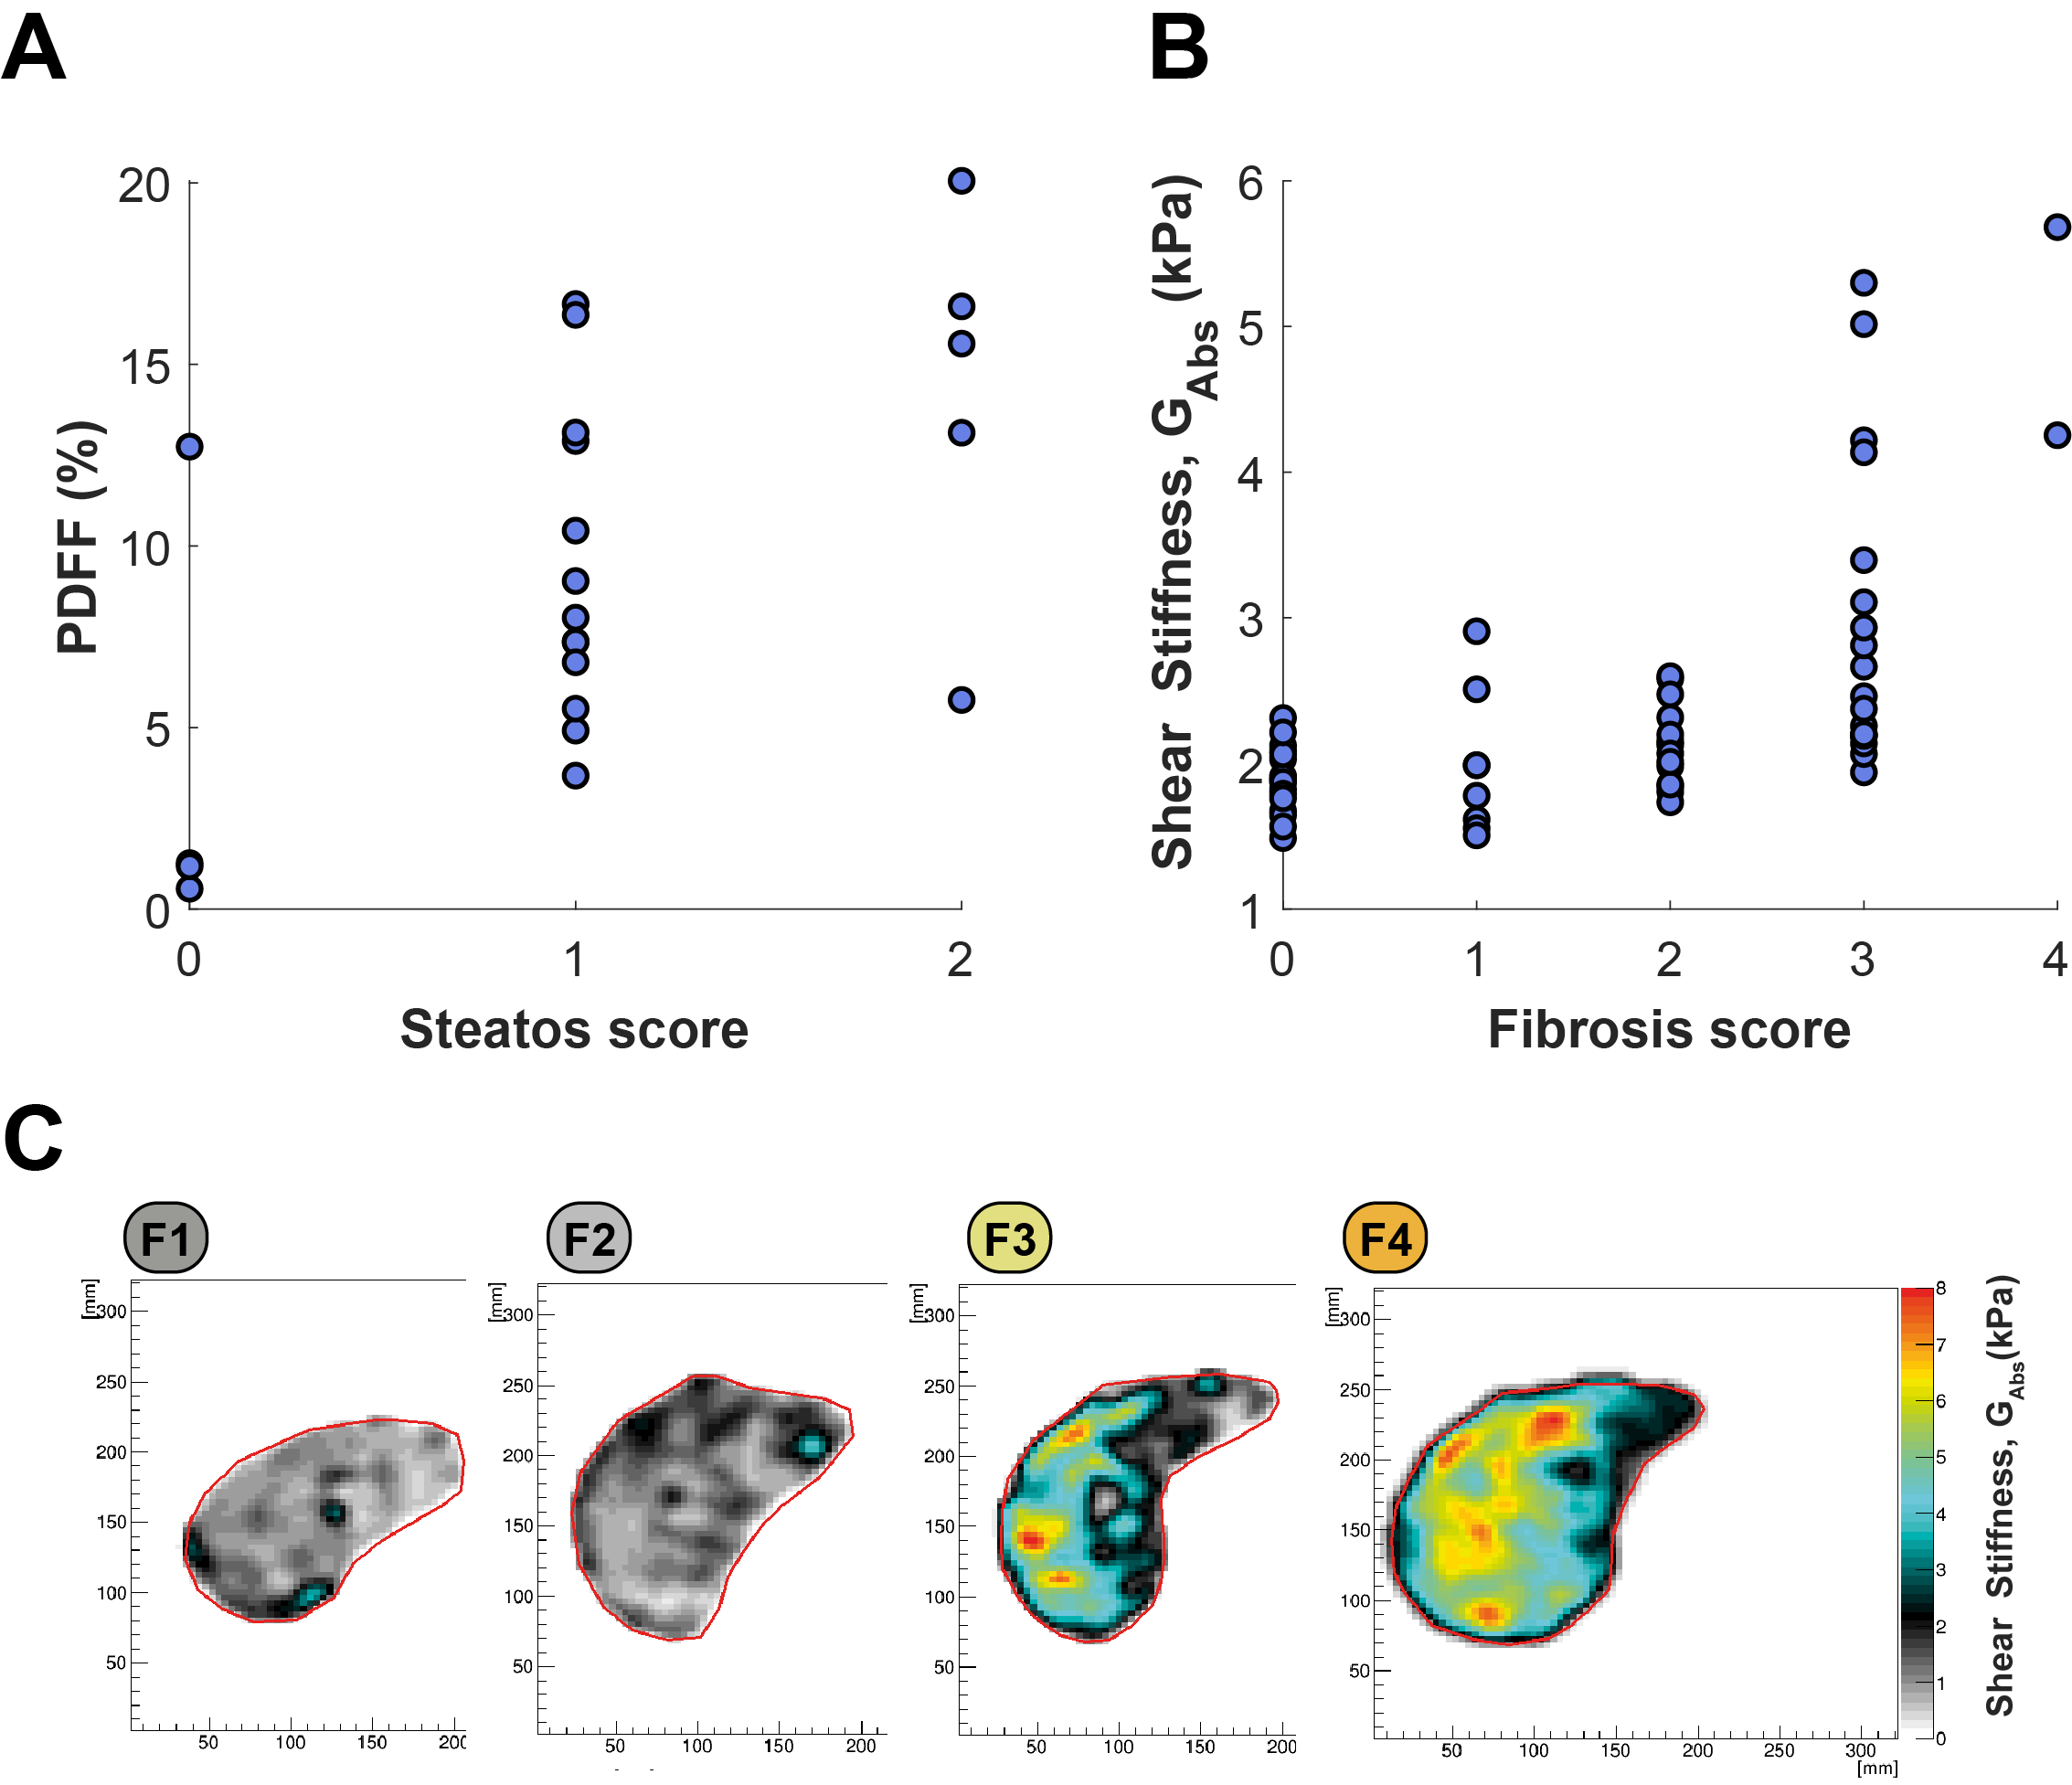
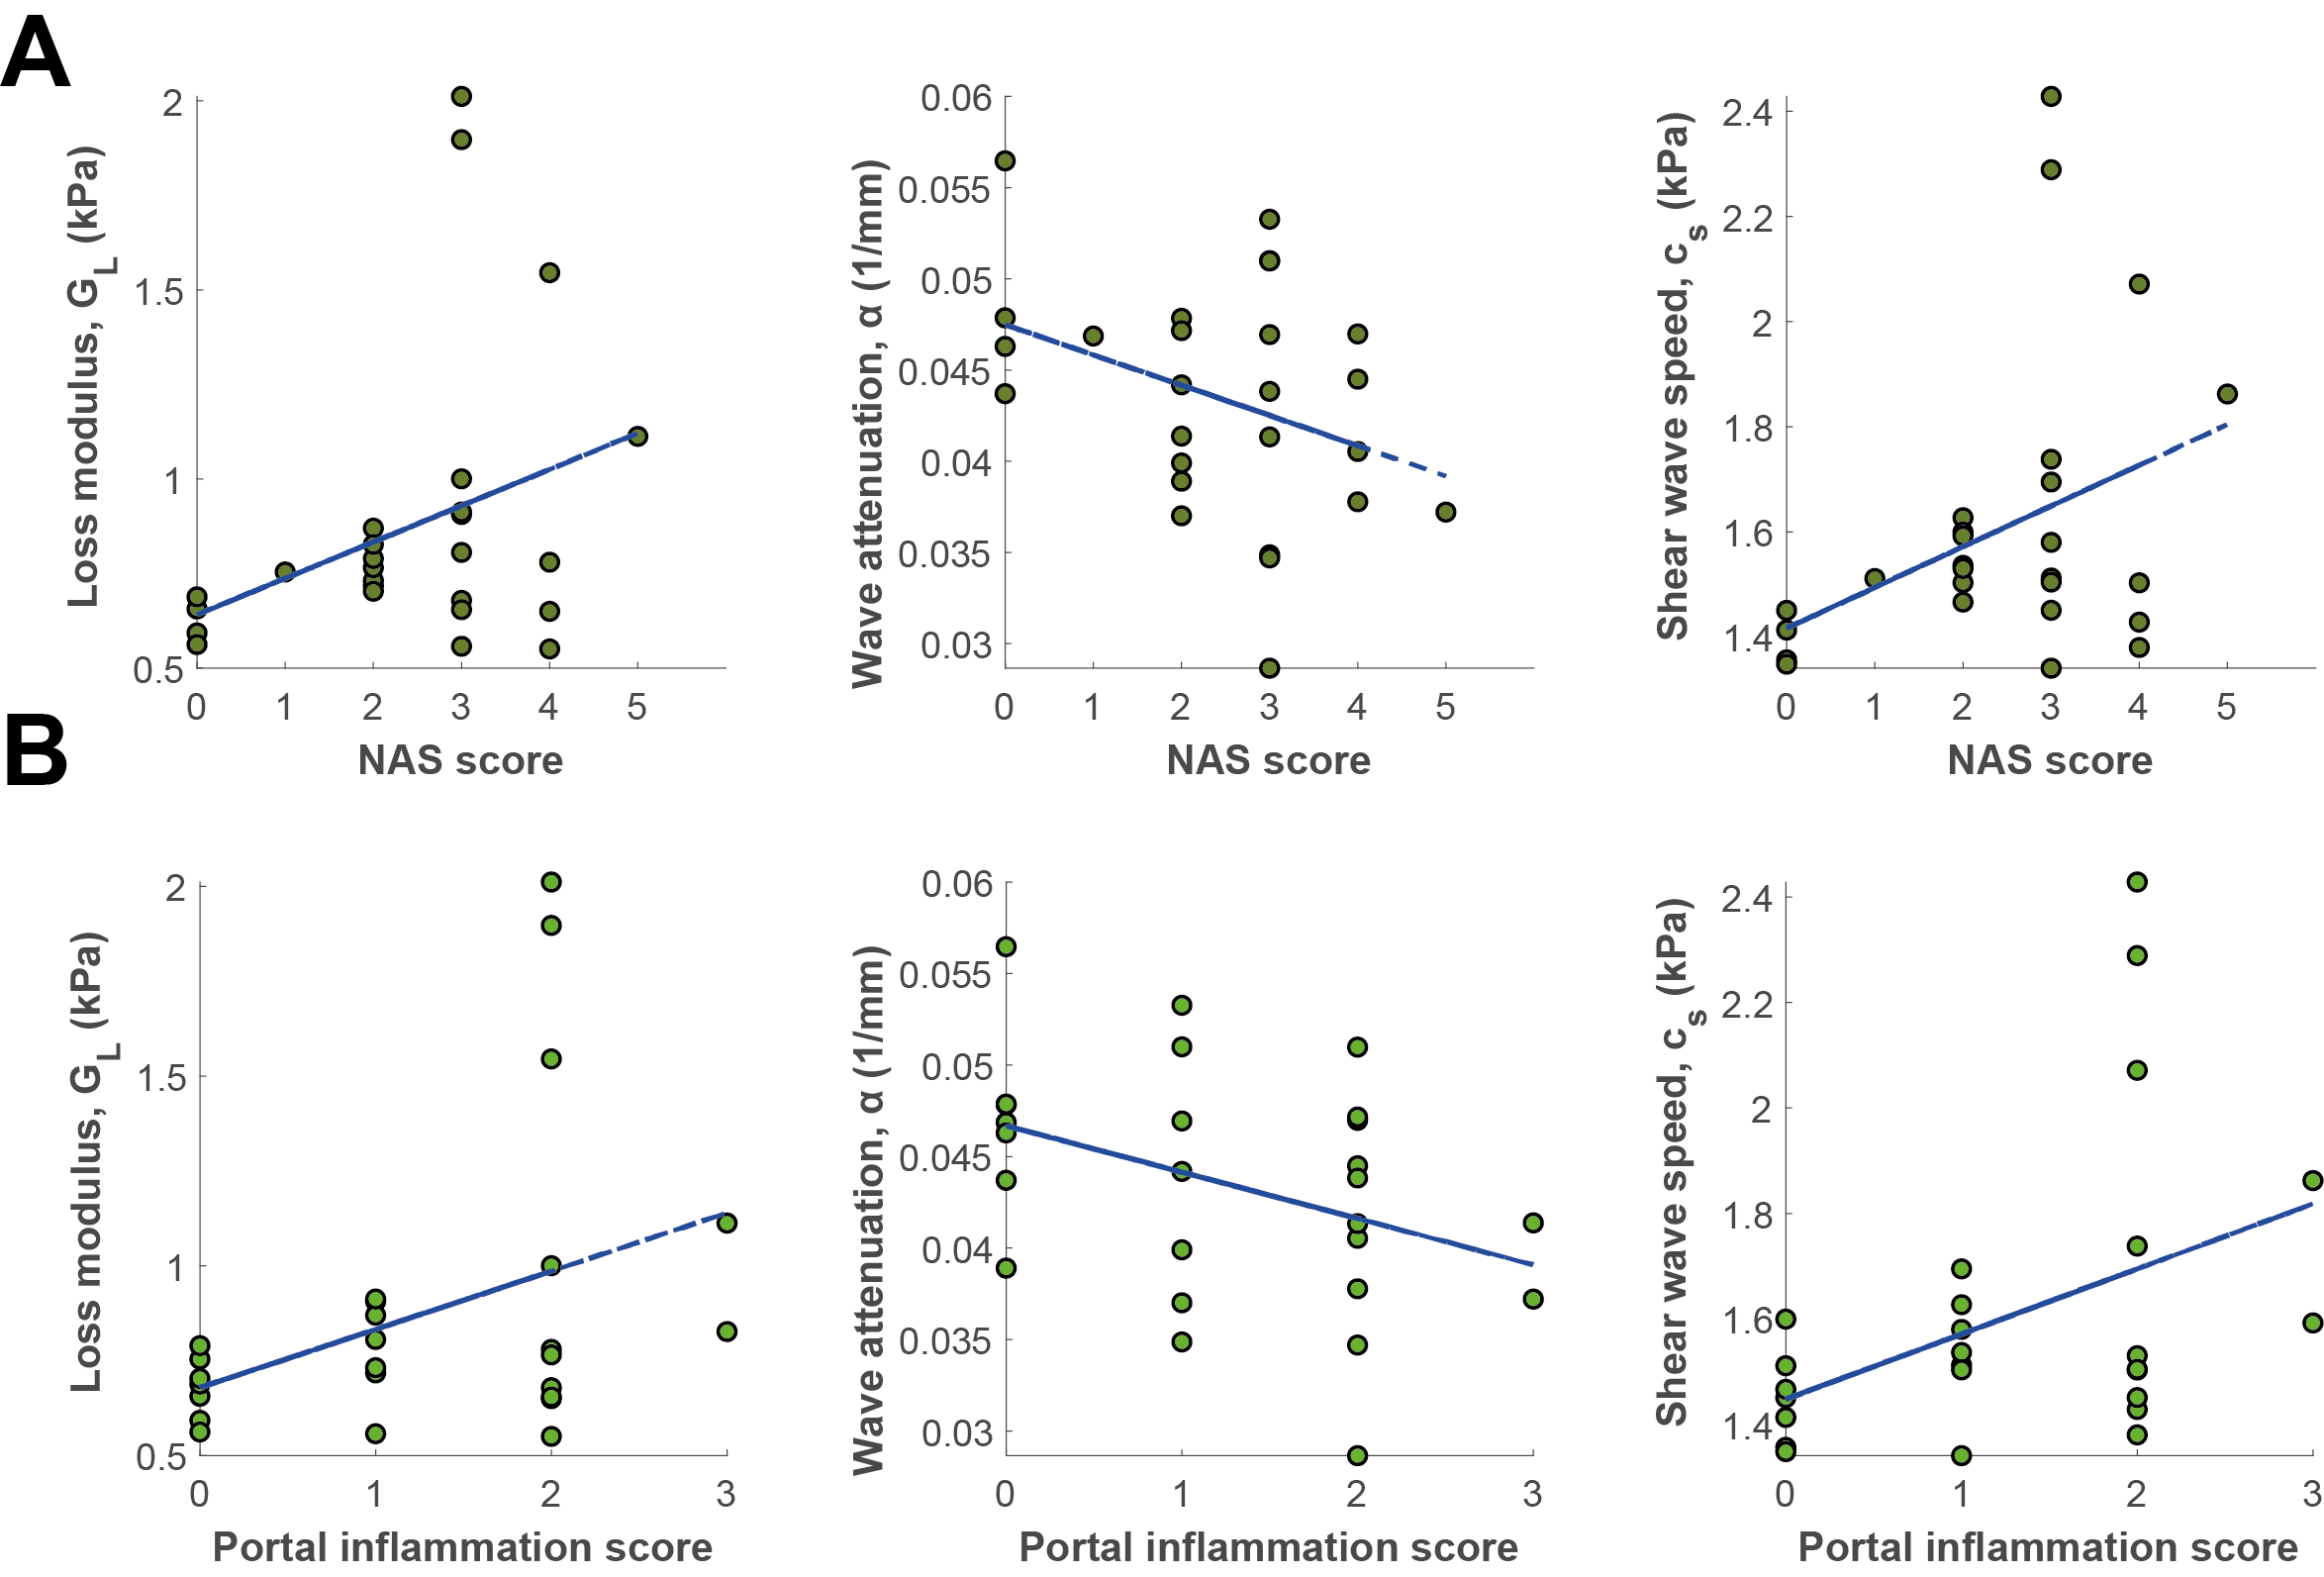
A comparison of the histology and MR measurements of both hepatic fat accumulation and fibrosis is shown in Fig 2A-B. In Fig 2A, it is shown that PDFF had a positive correlation trend with histology scores. Similar was observed for the two measurements of fibrosis (Fig 2B).On measures of inflammation, the correlation between MRE measurements (GL, α and cs) and two histology scores representing different aspects of inflammation (NAS, and portal inflammation score) mainly appeared as trends. In Fig 3A, NAS score shows a positive trend with both GL and cs and negative trend with α. The same was the case for the portal inflammation score in Fig 3B.
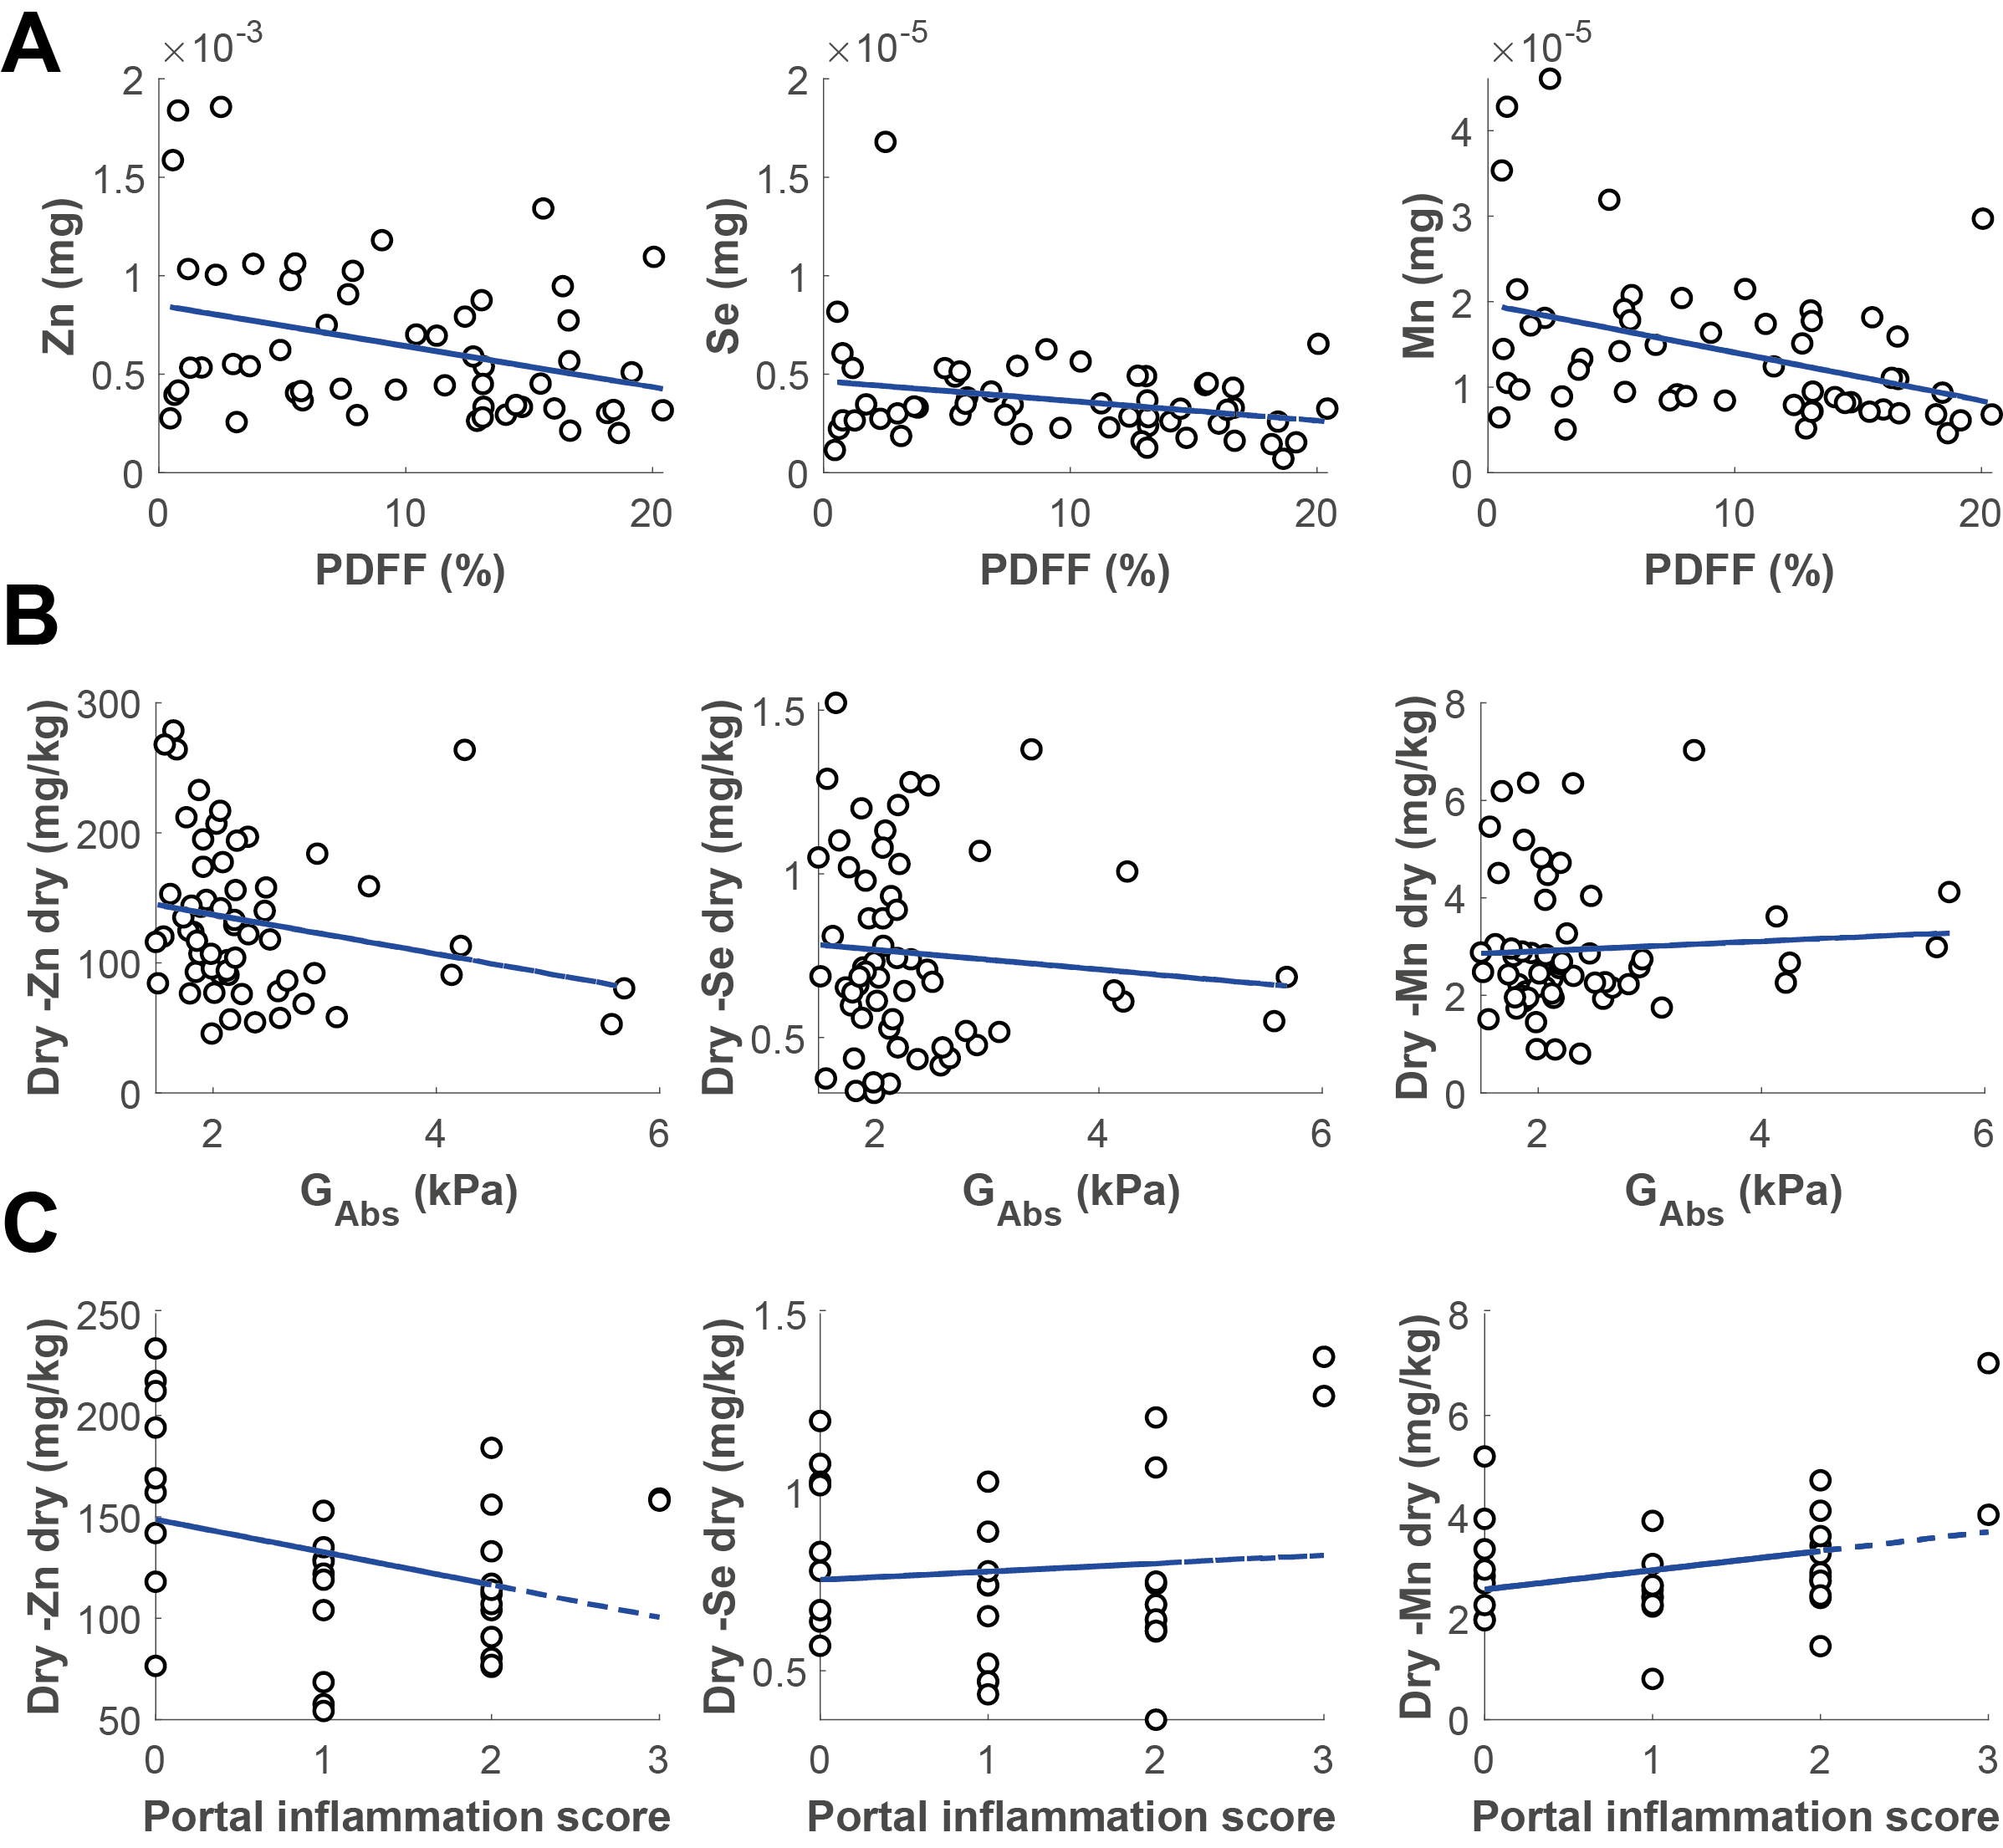
In Fig 4A-C, the comparison between three elements Zn, Se and Mn with measurements of fibrosis (GAbs), hepatic fat accumulation (PDFF) and hepatic inflammation (portal inflammation score) is shown. In Fig 4A, the comparison for the mass (w/dw) of each separate element found in the biopsy with PDFF, is shown. All three elements showed negative trends. In Fig 4B, the concentrations of each element (mg/kg dw) are shown, as well as the MRE measurement of fibrosis, no significant correlations were observed. The same can was the case for the comparison with the portal inflammation score.
Discussion
A preliminary analysis of selected measurements in a multimodal MR-protocol, in combination with histopathology and elemental assays is reported here. The cohort appeared to have a wide range of steatosis, extent of inflammation, and fibrosis. The observed correlations between different MRE variables and inflammation were in line with previous reports(1, 6). For the elemental analysis, trends were observed between all elements and PDFF, but most notably for Mn. This may suggest different extent of oxidative stress for patients with NAFLD, or alternatively spatial composition related effects. Multimodal investigations, on larger cohorts than reported here, may be valuable for a better characterization of different aspects of NAFLD, and also its progression into more severe stages.Acknowledgements
References
1. Sinkus R, Lambert S, Abd-Elmoniem KZ, Morse C, Heller T, Guenthner C, et al. Rheological determinants for simultaneous staging of hepatic fibrosis and inflammation in patients with chronic liver disease. NMR Biomed. 2018:e3956.
2. Nasr P, Forsgren MF, Ignatova S, Dahlström N, Cedersund G, Leinhard OD, et al. Using a 3% Proton Density Fat Fraction as a Cut-off Value Increases Sensitivity of Detection of Hepatic Steatosis, Based on Results from Histopathology Analysis. Gastroenterology. 2017;153(1):53-5.
3. Karlsson M, Ekstedt M, Dahlström N, Forsgren MF, Ignatova S, Norén B, et al. Liver R2* is affected by both iron and fat: A dual biopsy-validated study of chronic liver disease. J Magn Reson Imaging. 2019;50(1):325-33.
4. Naressi A, Couturier C, Devos JM, Janssen M, Mangeat C, Beer Rd, et al. Java-based graphical user interface for the MRUI quantitation package. Magnetic Resonance Materials in Physics, Biology and Medicine. 2001;12(2):141.
5. Vanhamme L, van den Boogaart A, Van Huffel S. Improved Method for Accurate and Efficient Quantification of MRS Data with Use of Prior Knowledge. J Magn Reson. 1997;129(1):35-43.
6. Garteiser P, Page G, d'Assignies G, Leitao HS, Vilgrain V, Sinkus R, et al. Necro-inflammatory activity grading in chronic viral hepatitis with three-dimensional multifrequency MR elastography. Sci Rep. 2021;11(1):19386.
Figures