4190
Comparison and Optimization b-Values combination of liver Diffusion-Weight Imaging in hepatic stiffness discrimination1Shuguang Hospital Affiliated to Shanghai University of Traditional Chinese Medicine, Shanghai, China, 2United Imaging Healthcare, Shanghai, China
Synopsis
DWI can indirectly reflect the changes of tissue microstructure by detecting the direction and extent of water molecule diffusion. In liver fibrosis, collagen fibers and cell membranes may block the diffusion of water molecules, resulting in changes in the diffusion signal. B-value selection is closely related to the image quality of DWI. Previous studies have found the correlation between tissue water diffusivity and tissue elasticity in the liver. However, there are no widely accepted ADC values on the b-value combination for the stiffness of liver fibrosis. Therefore, the study of b-value combination optimization is of important clinical interest.
Magnetic Resonance Elastography (MRE) has emerged as an alternative approach to liver biopsy, the golden standard for staging liver fibrosis. Diffusion Weighted Imaging (DWI) has shown the potential to characterize liver fibrosis at a microscopic level in recent years. But there was no widely accepted ADC values on the b-value combination for the stiffness of liver fibrosis. In this study, we sought to determine the optimal high and low b values diffusion weighted imaging for the assessing the liver stiffness in fibrosis patients.
Methods
This study was approved by the institutional review board of both participating institutions. A total of 95 patients with liver fibrosis were identified from our local hospital. All MRI examinations were performed on a 3T scanner (uMR780, united imaging medical, Shanghai, China) using a 32-channel body array coil. DWI specific scanning parameters were as follows: TR/TE= 4000/78 ms, slice thickness = 5 mm, field of view = 300 mm × 380 mm, b values were 0, 100, 200, 500, 800, 1000, 1200 and 1500 sec/mm2. The apparent diffusion coefficient (ADC) was calculated by the combination of b values (0-500, 0-800, 0-1200, 0-1500, 100-500, 100-800, 100-1200, 100-1200, 200-500, 200-800, 200-1200, 200-1500). The equation used was: SADC = ln (SLB / SHB) / (HB-lb), where Hb and LB represent high b value and low b values, respectively. A two-dimensional gradient echo sequence was used for MRE, with the specific scanning parameters as follows: TR/TE= 50/20.63ms, flip angle = 30 °, layer thickness = 10 mm, field of view = 300 mm × 300 mm.
Results
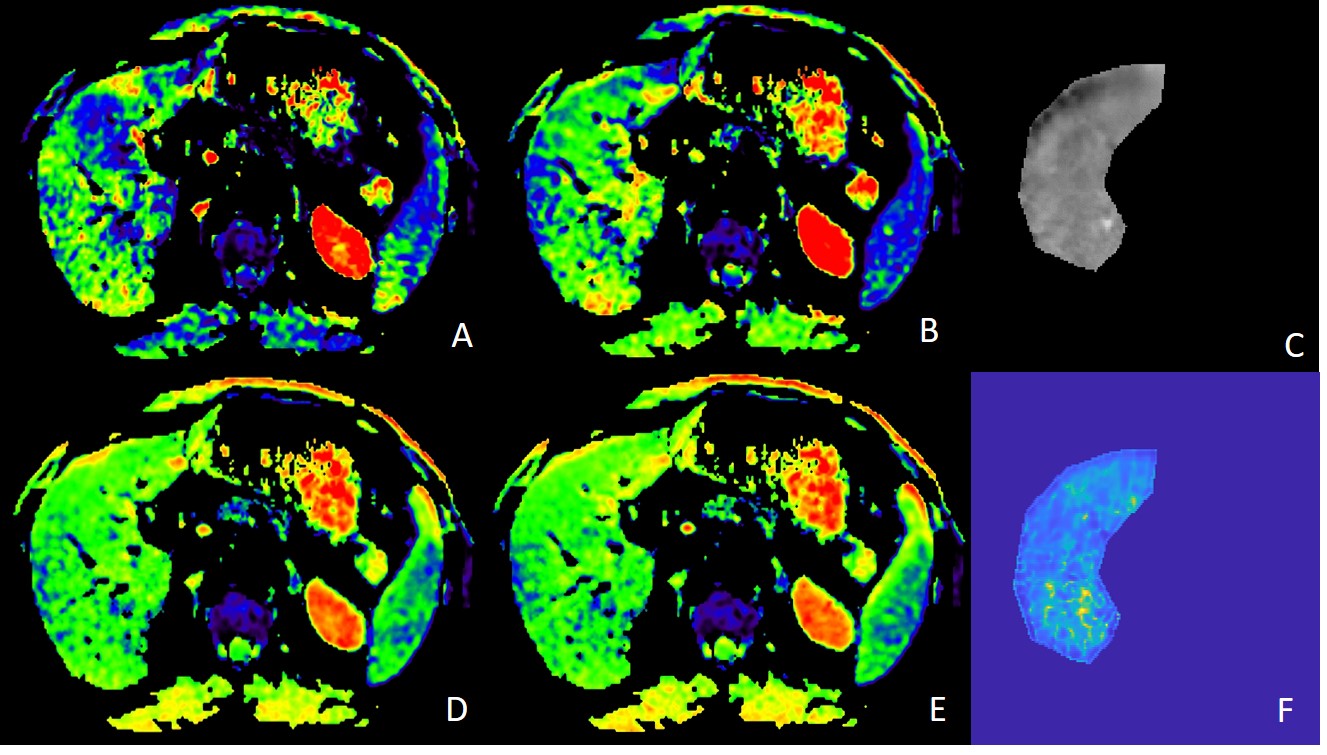
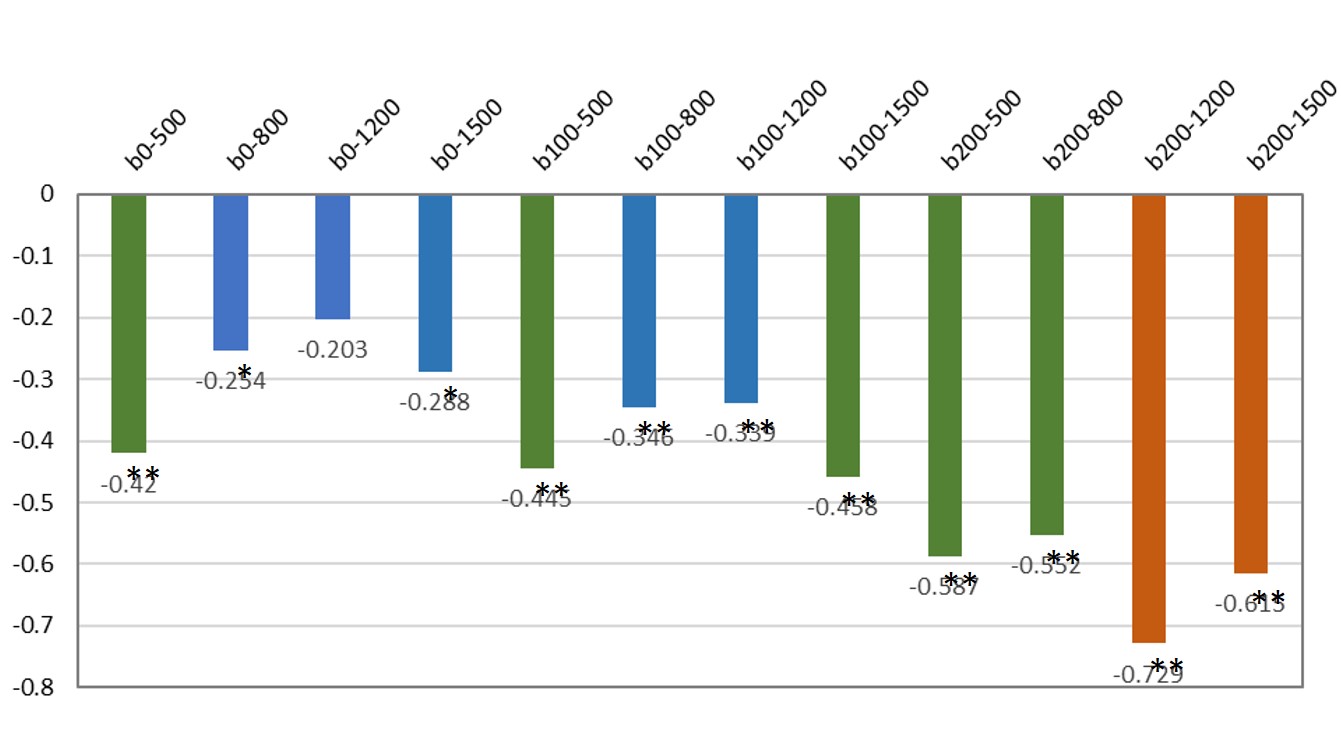
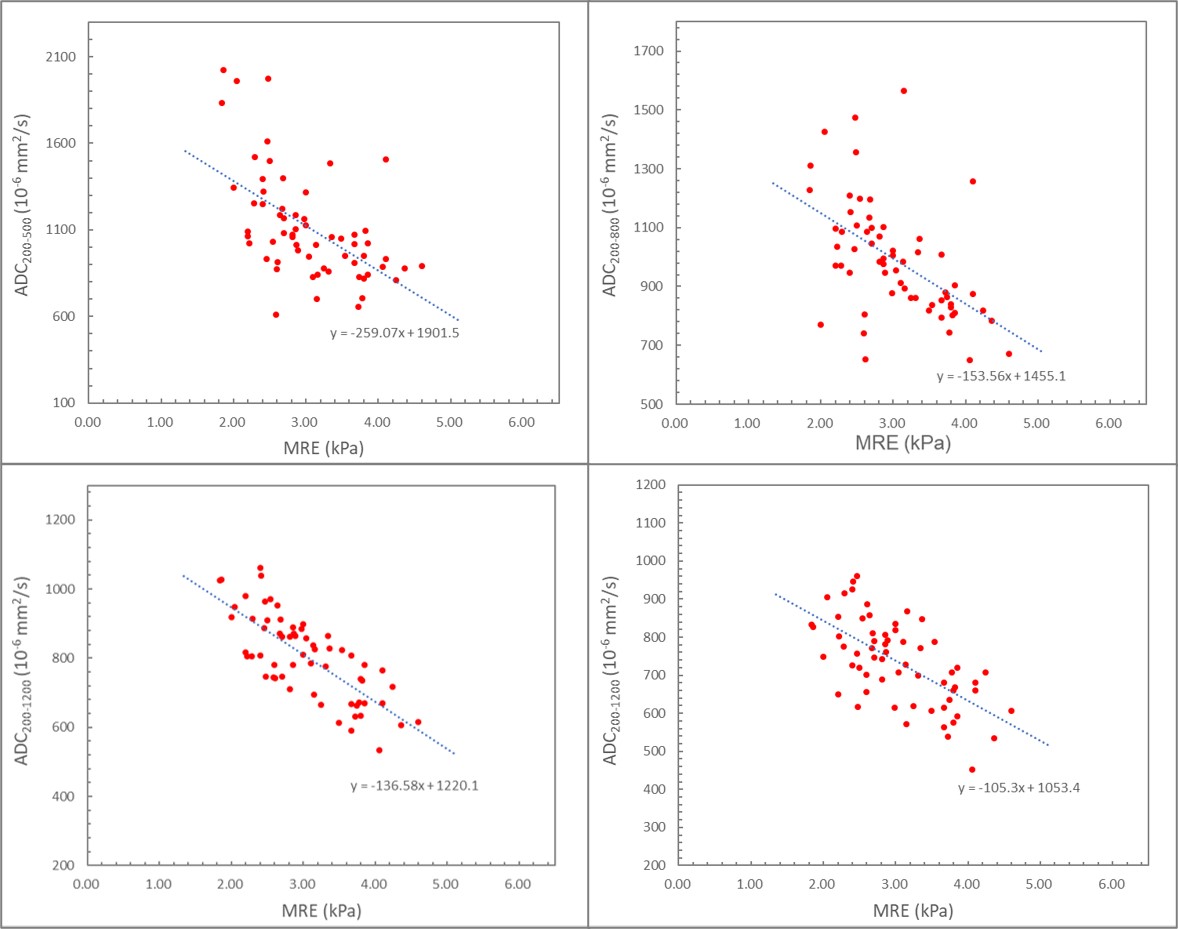
There were 38 males and 35 females with an average age of 53.67 ±13. 48 years (range 27-79 years). Significant correlations were found between the ADC values (b200-500, b200-800, b200-1200, b200-1500) and MRE (r=-0.587, -0.552, -0.729, -0.615 respectively, and all P<0.001). In the comparison of different b-values combinations, b200-1200 was found better among all b-values combinations. With the progression of fibrosis, ADC values decreases significantly and ADC values can distinguish the stages of liver fibrosis, as shown in the Figure.
Discussion and Conclusion
Liver ADC values for b-values ranging from 200 to 1200 and from 200 to 1500 have strong correlations with the stiffness of the liver. And it is best for b-values ranging from 200 to 1200 s/mm2. In clinical, tissue stiffness can be reflected from a DWI scan without the need of external device, which helps reduce the complexity of the examination. Also, tissue stiffness of patients with iron overload can be inferred from ADC, where MRE often fails in such patients due to the strong signal dephase. The DWI offers a useful alternative to MRE for detecting the liver stiffness.
Acknowledgements
NoneReferences
1. Kromrey ML, Le Bihan D, Ichikawa S, Motosugi U. Diffusion-weighted MRI-based Virtual Elastography for the Assessment of Liver Fibrosis. Radiology. 2020 Apr;295(1):127-135. doi: 10.1148/radiol.2020191498. Epub 2020 Feb 11. PMID: 32043948.
2. Le Bihan D, Ichikawa S, Motosugi U. Diffusion and Intravoxel Incoherent Motion MR Imaging-based Virtual Elastography: A Hypothesis-generating Study in the Liver. Radiology. 2017 Nov;285(2):609-619. doi: 10.1148/radiol.2017170025. Epub 2017 Jun 12. PMID: 28604279.
2. Gupta, R.T., et al., Hepatic hemangiomas: difference in enhancement pattern on 3T MR imaging with gadobenate dimeglumine versus gadoxetate disodium. Eur J Radiol, 2012. 81(10): p. 2457-62.
Figures