4188
In silico liver resection to estimate global and regional hepatobiliary function1Department of Medical Engineering, Linköping University, Linköping, Sweden, 2Departments of Radiation Physics, Radiology, Department of Medical and Health Sciences, Linköping University, Linköping, Sweden, 3Center for Medical Image Science and Visualization (CMIV), Linköping University, Linköping, Sweden, 4Department of Surgery, Department of biomedical and clinical sciences, Linköping University, Linköping, Sweden
Synopsis
In some cases, treatment of severe liver diseases requires resective surgery. This brings serious complications if the remnant tissue fails to match the requirement of liver function. Therefore, a pre-operative risk assessment is vital. However, usually the assessment only investigates global liver function. For a more precise assessment, we investigate the possibility of using DCE-MRI in combination with pharmacokinetic modeling to quantify both global- and regional liver function. Also, we show a novel eight-compartment hepatic model, capable of performing an in-silico resection. This framework might in the future be used as a tool for a more precise pre-operative assessment.
Introduction
A wide range of severe liver diseases have very subtle clinical symptoms and are only identified in late stages where the only remaining treatment may be resective liver surgery. These types of resections can lead to serious complications if the remnant tissue fails to match the required liver function. Therefore, it is vital to do a pre-operative risk assessment. Such assessment usually relies on measurements of global liver function. However, this does not allow the viability function of each individual segment to be evaluated, although such would be beneficial for pre-surgical assessment.To this cause, we investigate the possibility of using dynamic contrast enhanced (DCE)-MRI to determine both global and regional hepatic function pre- and post-surgery. Using DCE images both before and after surgery, we have created unique datasets which we combine with pharmacokinetic modeling of the hepatobiliary uptake, using our previously published pharmacokinetic model (1, 2), a novel eight-compartment liver model capable of simulating an in-silico resection.
Methods
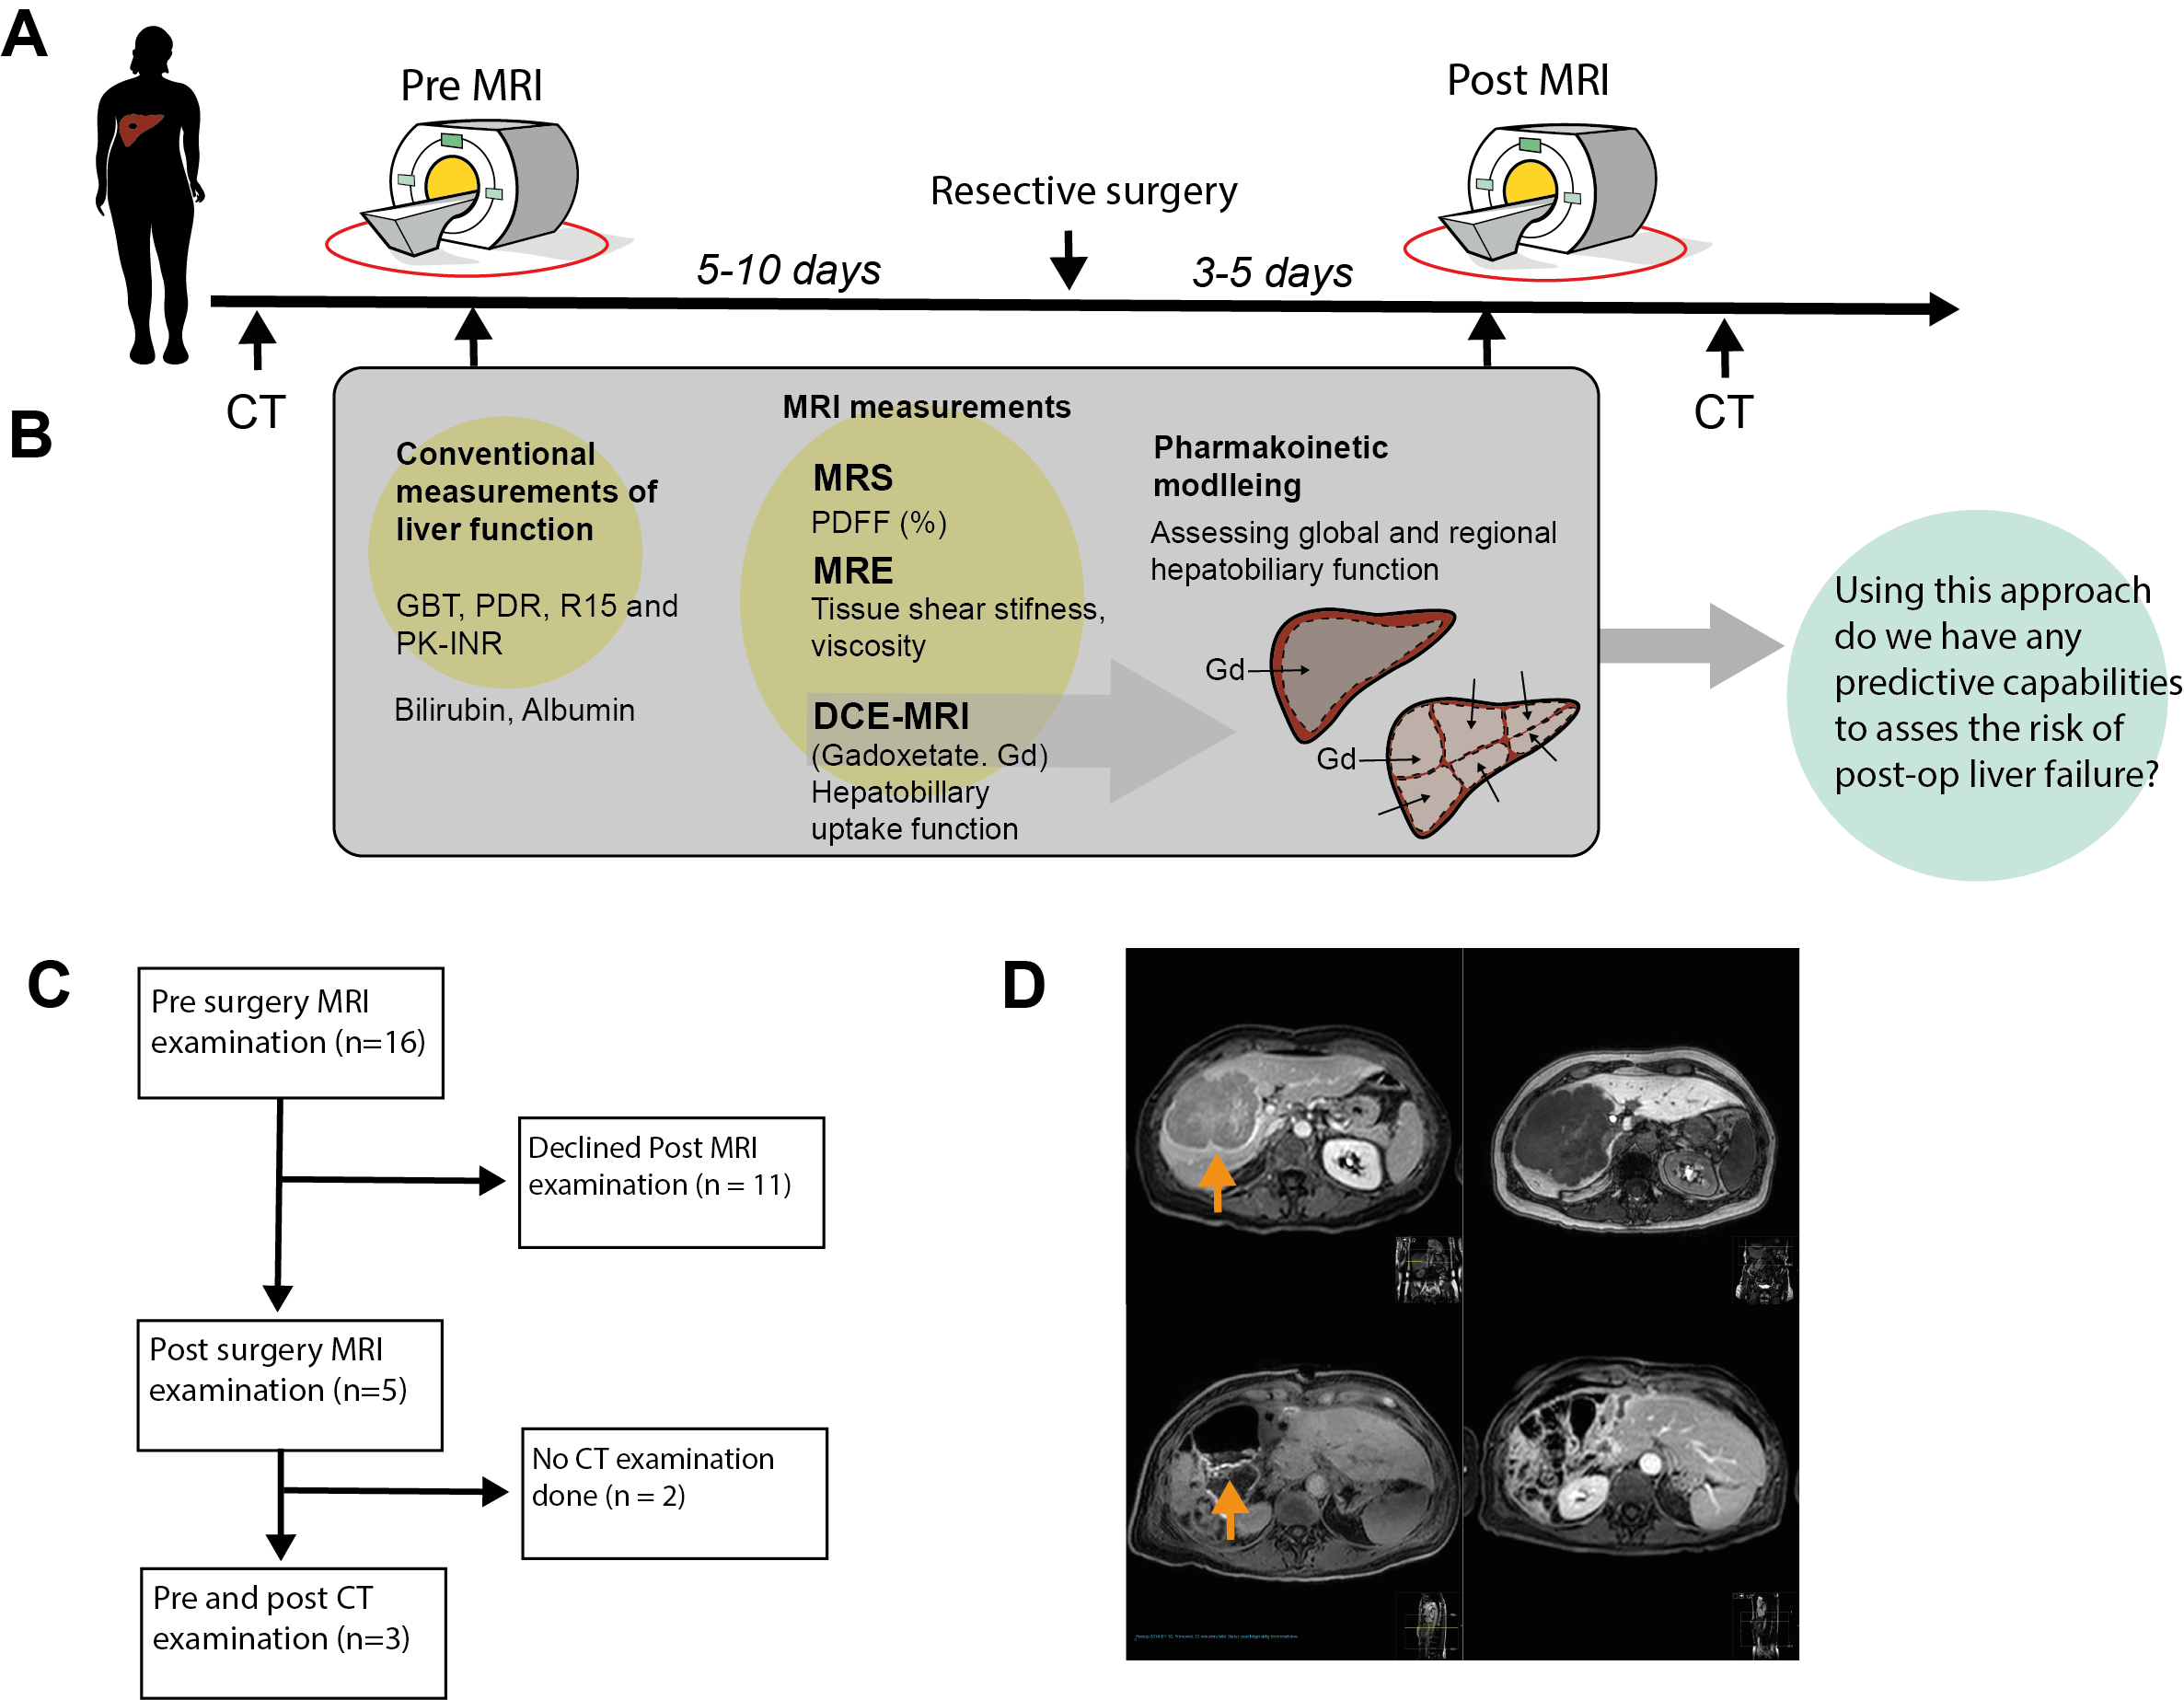
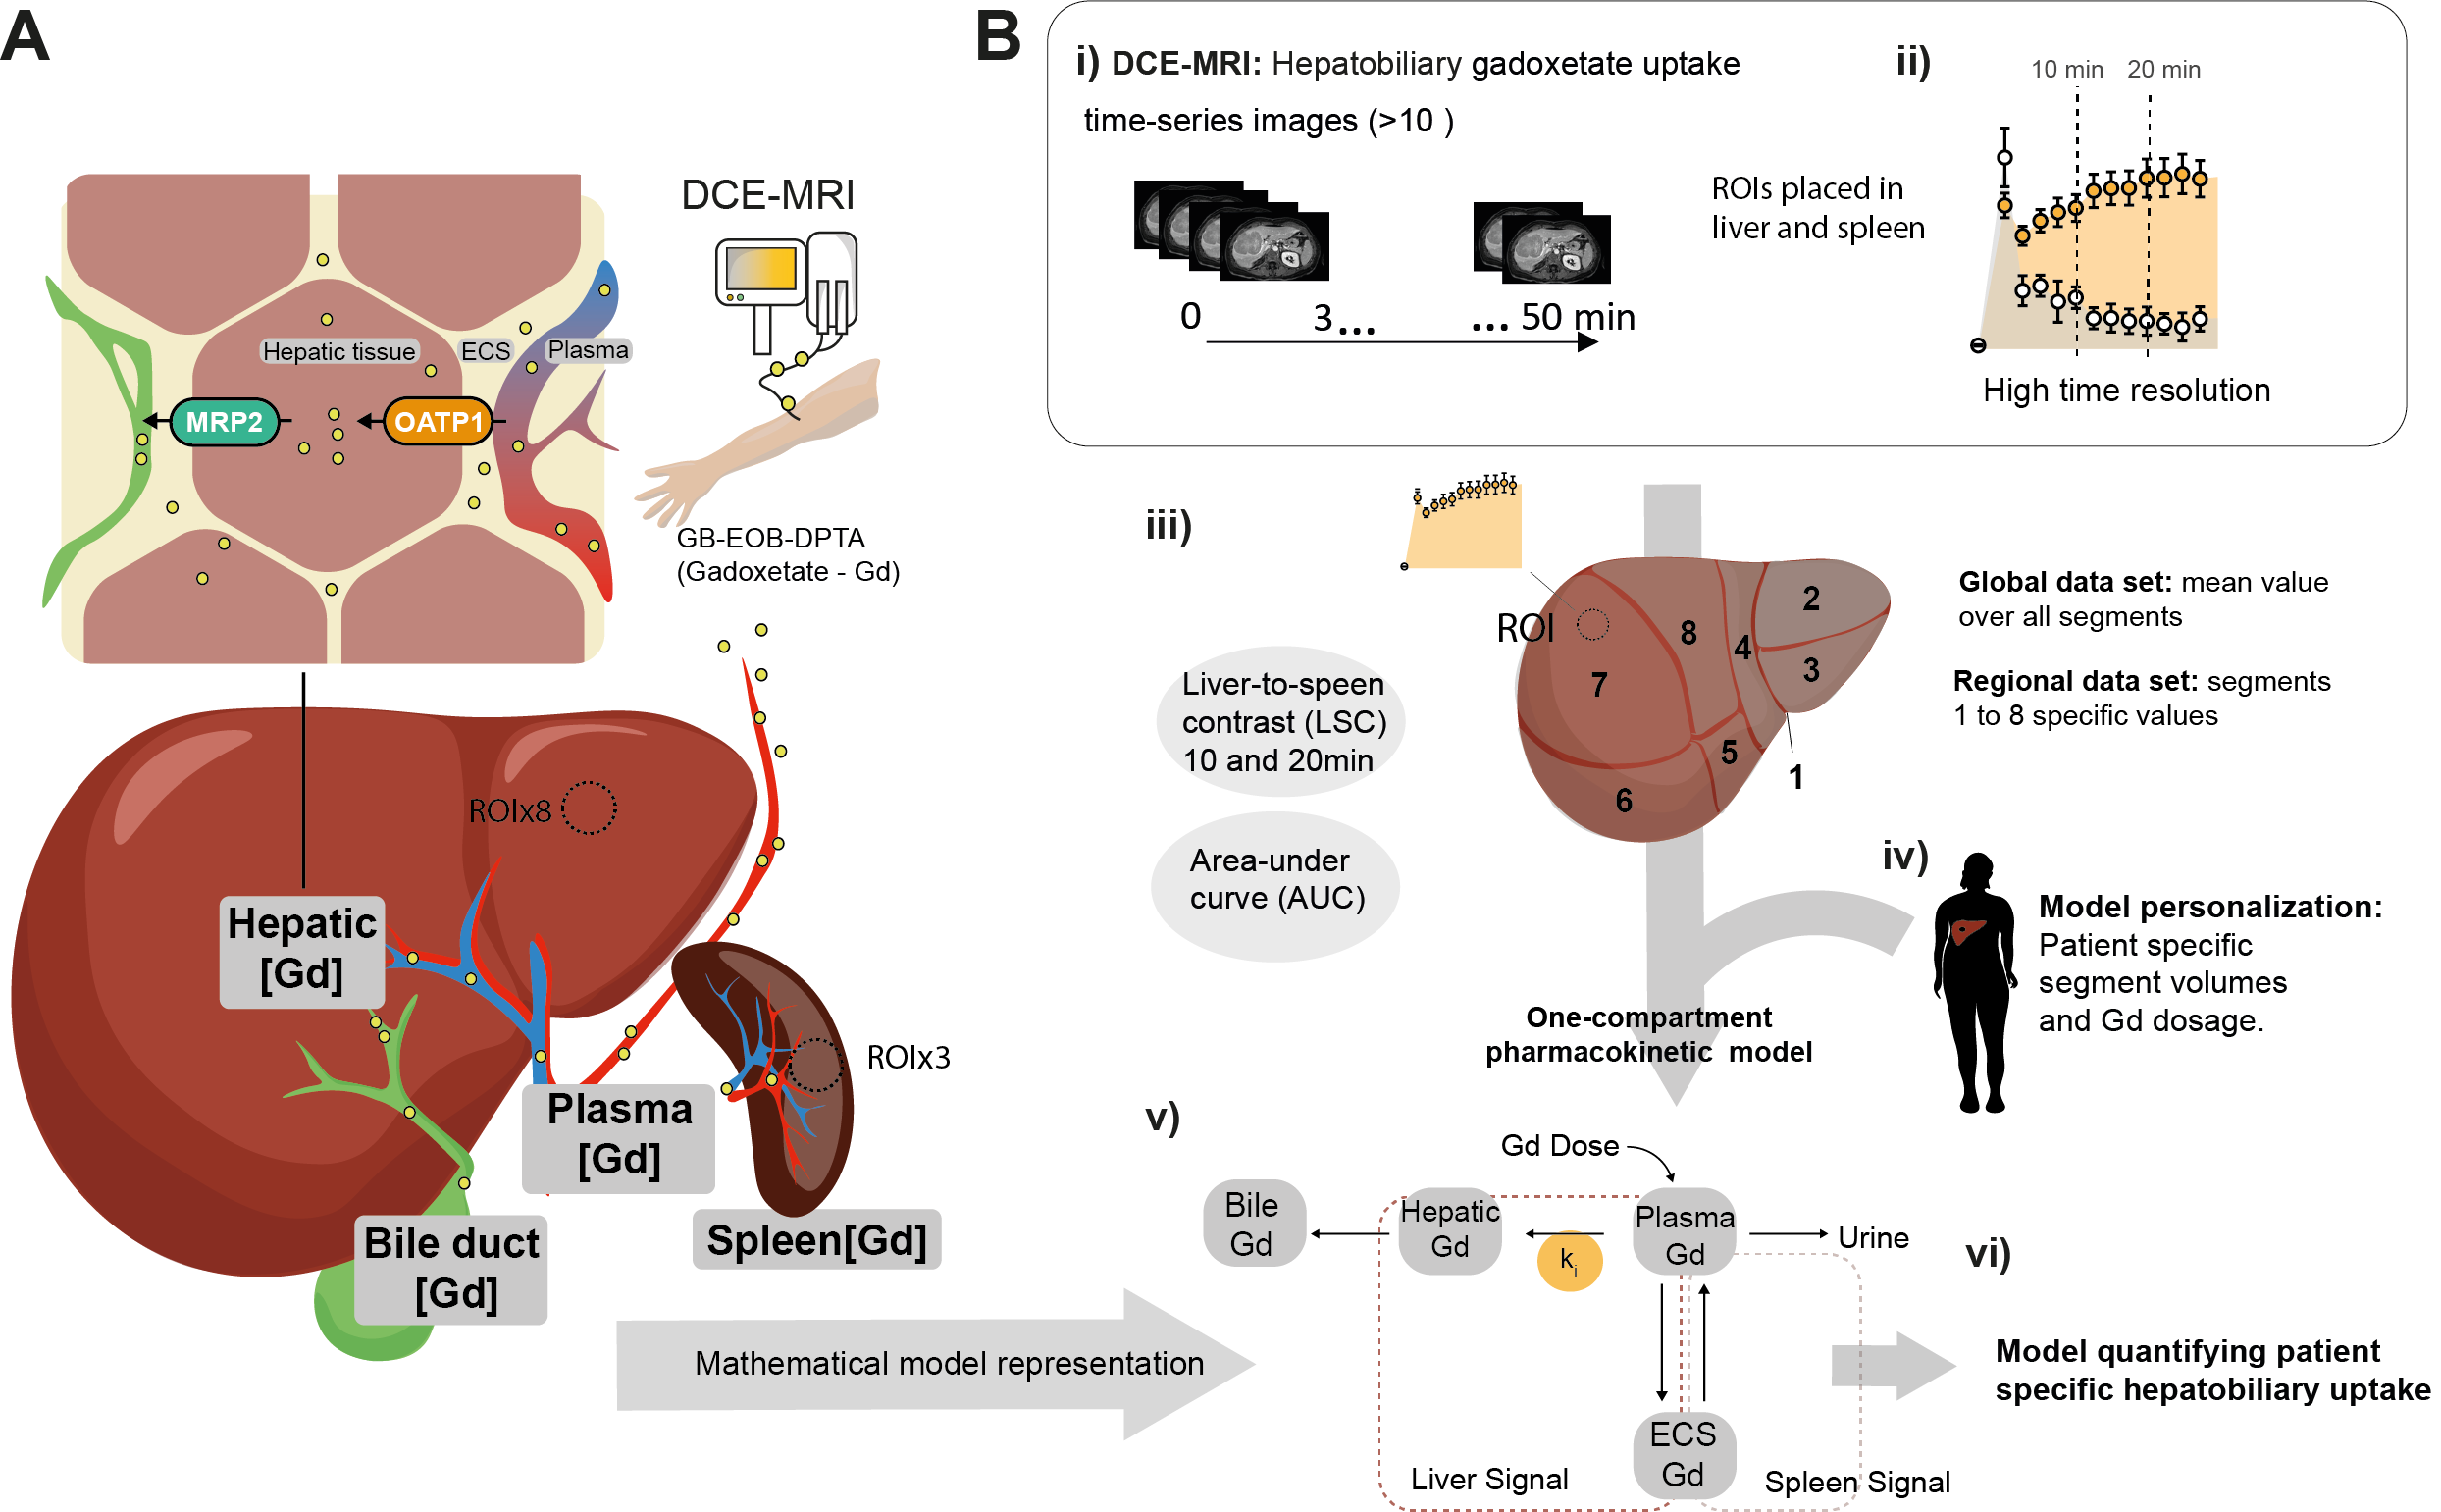
The study setup is shown in Fig 1A-C. Magnetic Resonance was performed using a 3T Philips Ingenia MR-scanner. DCE-MRI was performed using the hepatocyte specific contrast agent Gadoxetate (Gd3+) (Fig 2A). Several post-injection images were acquired between 0, and 50 minutes (Fig 1D, Fig 2B). ROIs were placed in each of the eight Couinaud segments, plus three ROIs in the spleen, by experienced radiologists (BN and WB). From each liver ROI, the intensity was extracted and used to estimate Gd3+ concentration (mM). MRE at 33 Hz was performed using an active electrodynamic transducer (Philips Medical, Hamburg, Germany). Liver PDFF was measured using the 1H-MRS sequence as described previous publications (3, 4).Pharmacokinetic modelling was performed using MATLAB 2018 and the Systems Biology Toolbox (5). Our previously published model (1, 2) was fitted (MEIGO toolbox (6)) to the new DCE-MRI data for both pre- and post-resection for each individual patient, according to the process shown in Fig 2Bi-vi. This resulted in patient and examination specific parameters (e.g., influx ki.) which allowed us to assess global hepatic function. To assess the regional liver function, we used our novel eight compartment model shown in Fig 3F. Where each Couinaud segment is represented by its own functional compartment. Using the same process, the eight-compartment model was fitted to the regional dataset and segment-specific parameters were determined. In addition, as a proof of concept, we also performed an in-silico resection – by removing compartments and introducing a 'stress parameter' allowing for determination of perturbations of the influx after surgery.
In addition, the phenomenological liver-to-spleen contrast ration (LSC) of late hepatobiliary uptake both for the global and regional datasets was also calculated for comparison.
Results
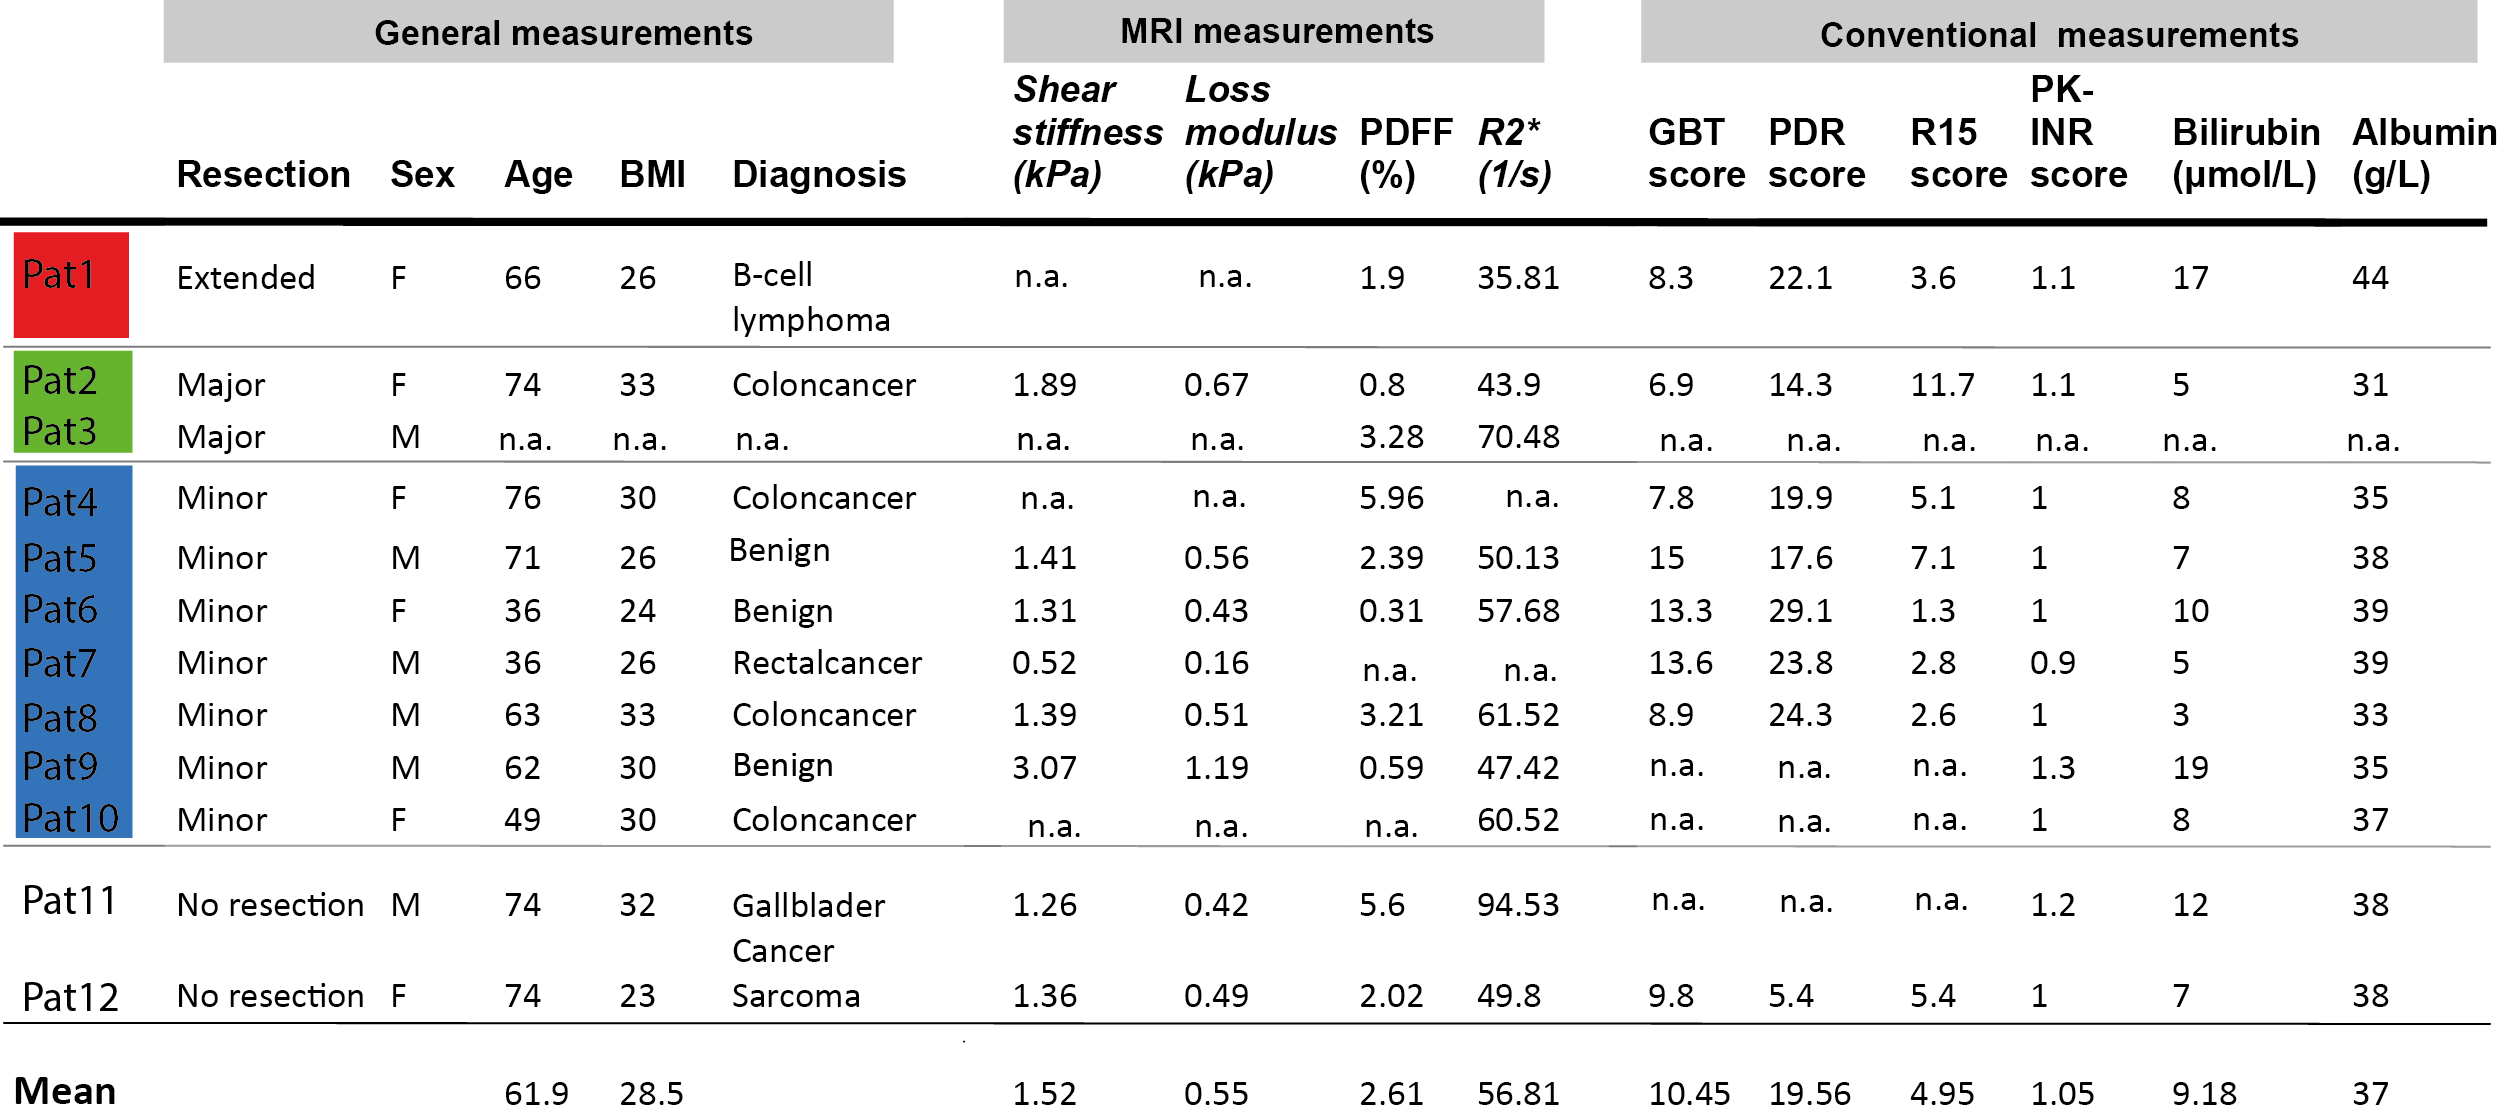
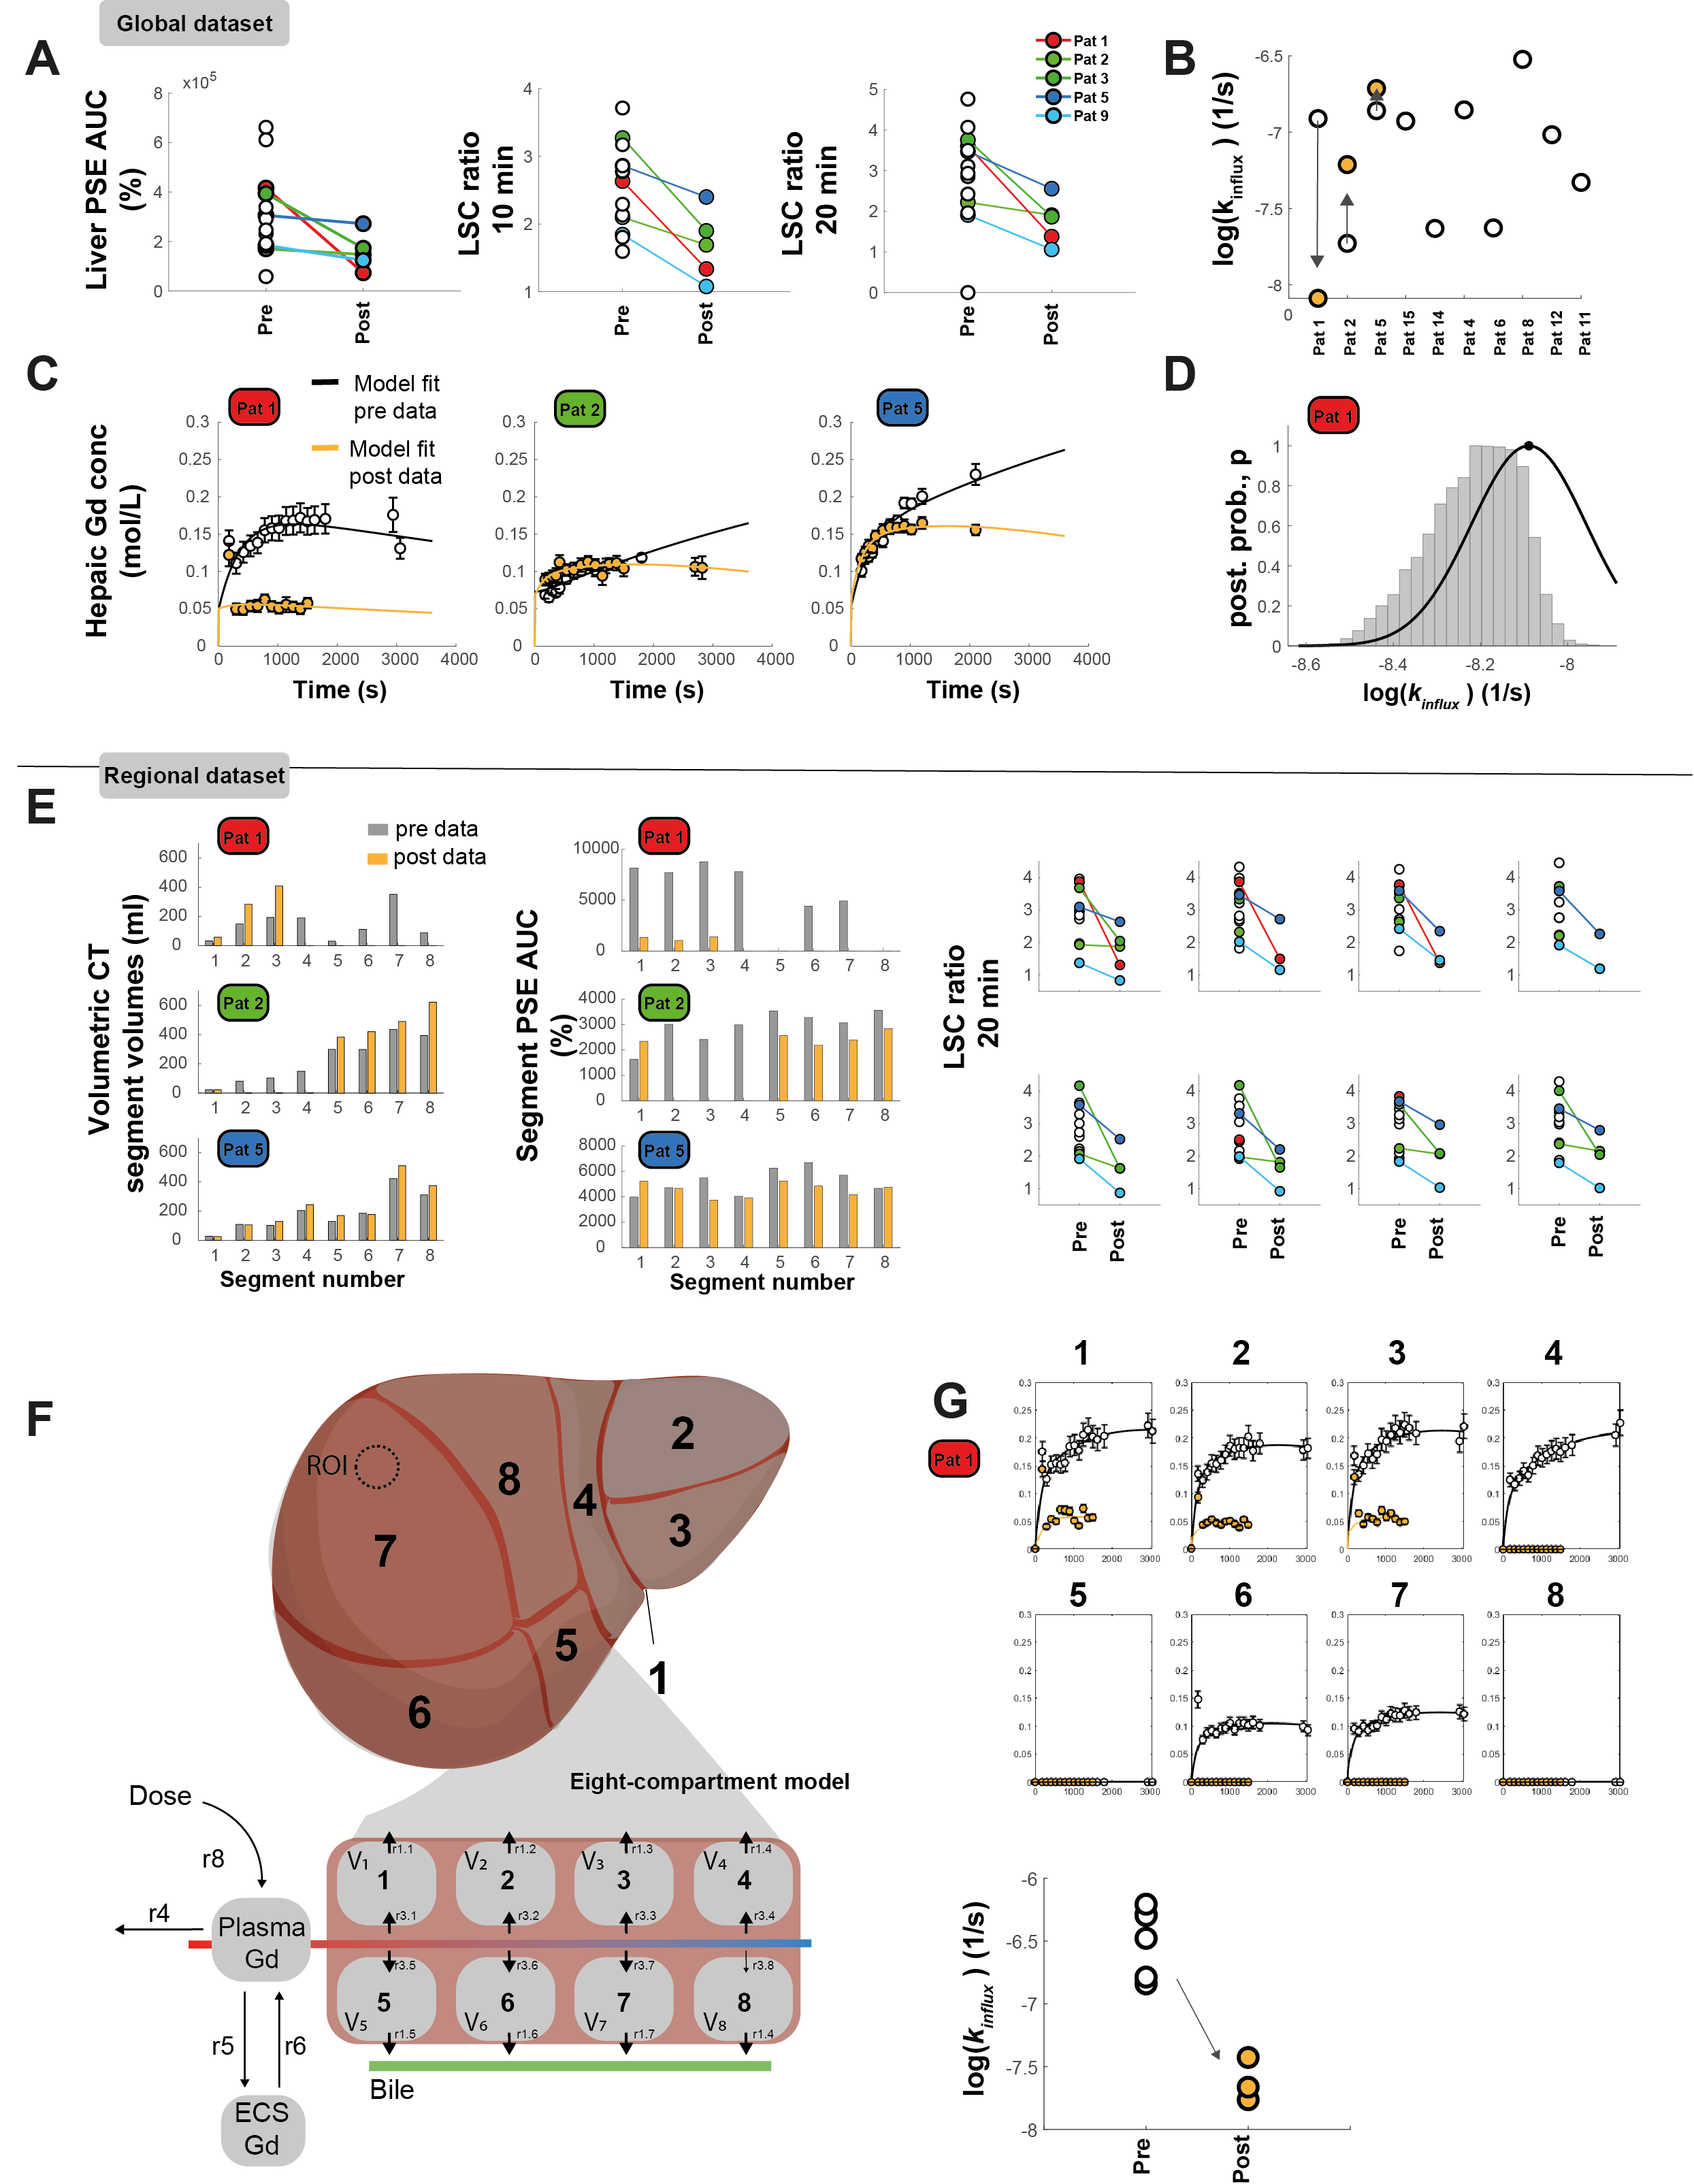
The conventional and MRI-measurements of global function are shown in Table 1. Individual differences for patients that performed both examinations are shown in Figure 3A-D. Both the area-under-curve (AUC) of percent signal enhancement (PSE) and LSC ratio at 10 and 20 minutes were determined for the post-examination. The model fits for three patients are shown in Fig 3C, as well as the corresponding change in influx, ki (Fig 3B). In Pat 1, we see a large reduction in Gd3+ conc after surgery with a corresponding reduction in ki. An example of ki identifiability is shown in Fig 3D.In Fig 3E the volume for each segment before and after surgery are shown. Moreover, here we see a reduction in AUC for most segments after surgery, with the reduction most noticeable in Pat1. For all segments LSC at 20 minutes seems to be lower after surgery. The model fit for the new eight compartment model to the pre- and post-data for Pat1 is shown in Fig 3G, the corresponding parameter values shows a reduction in ki for each remaining segment after surgery.
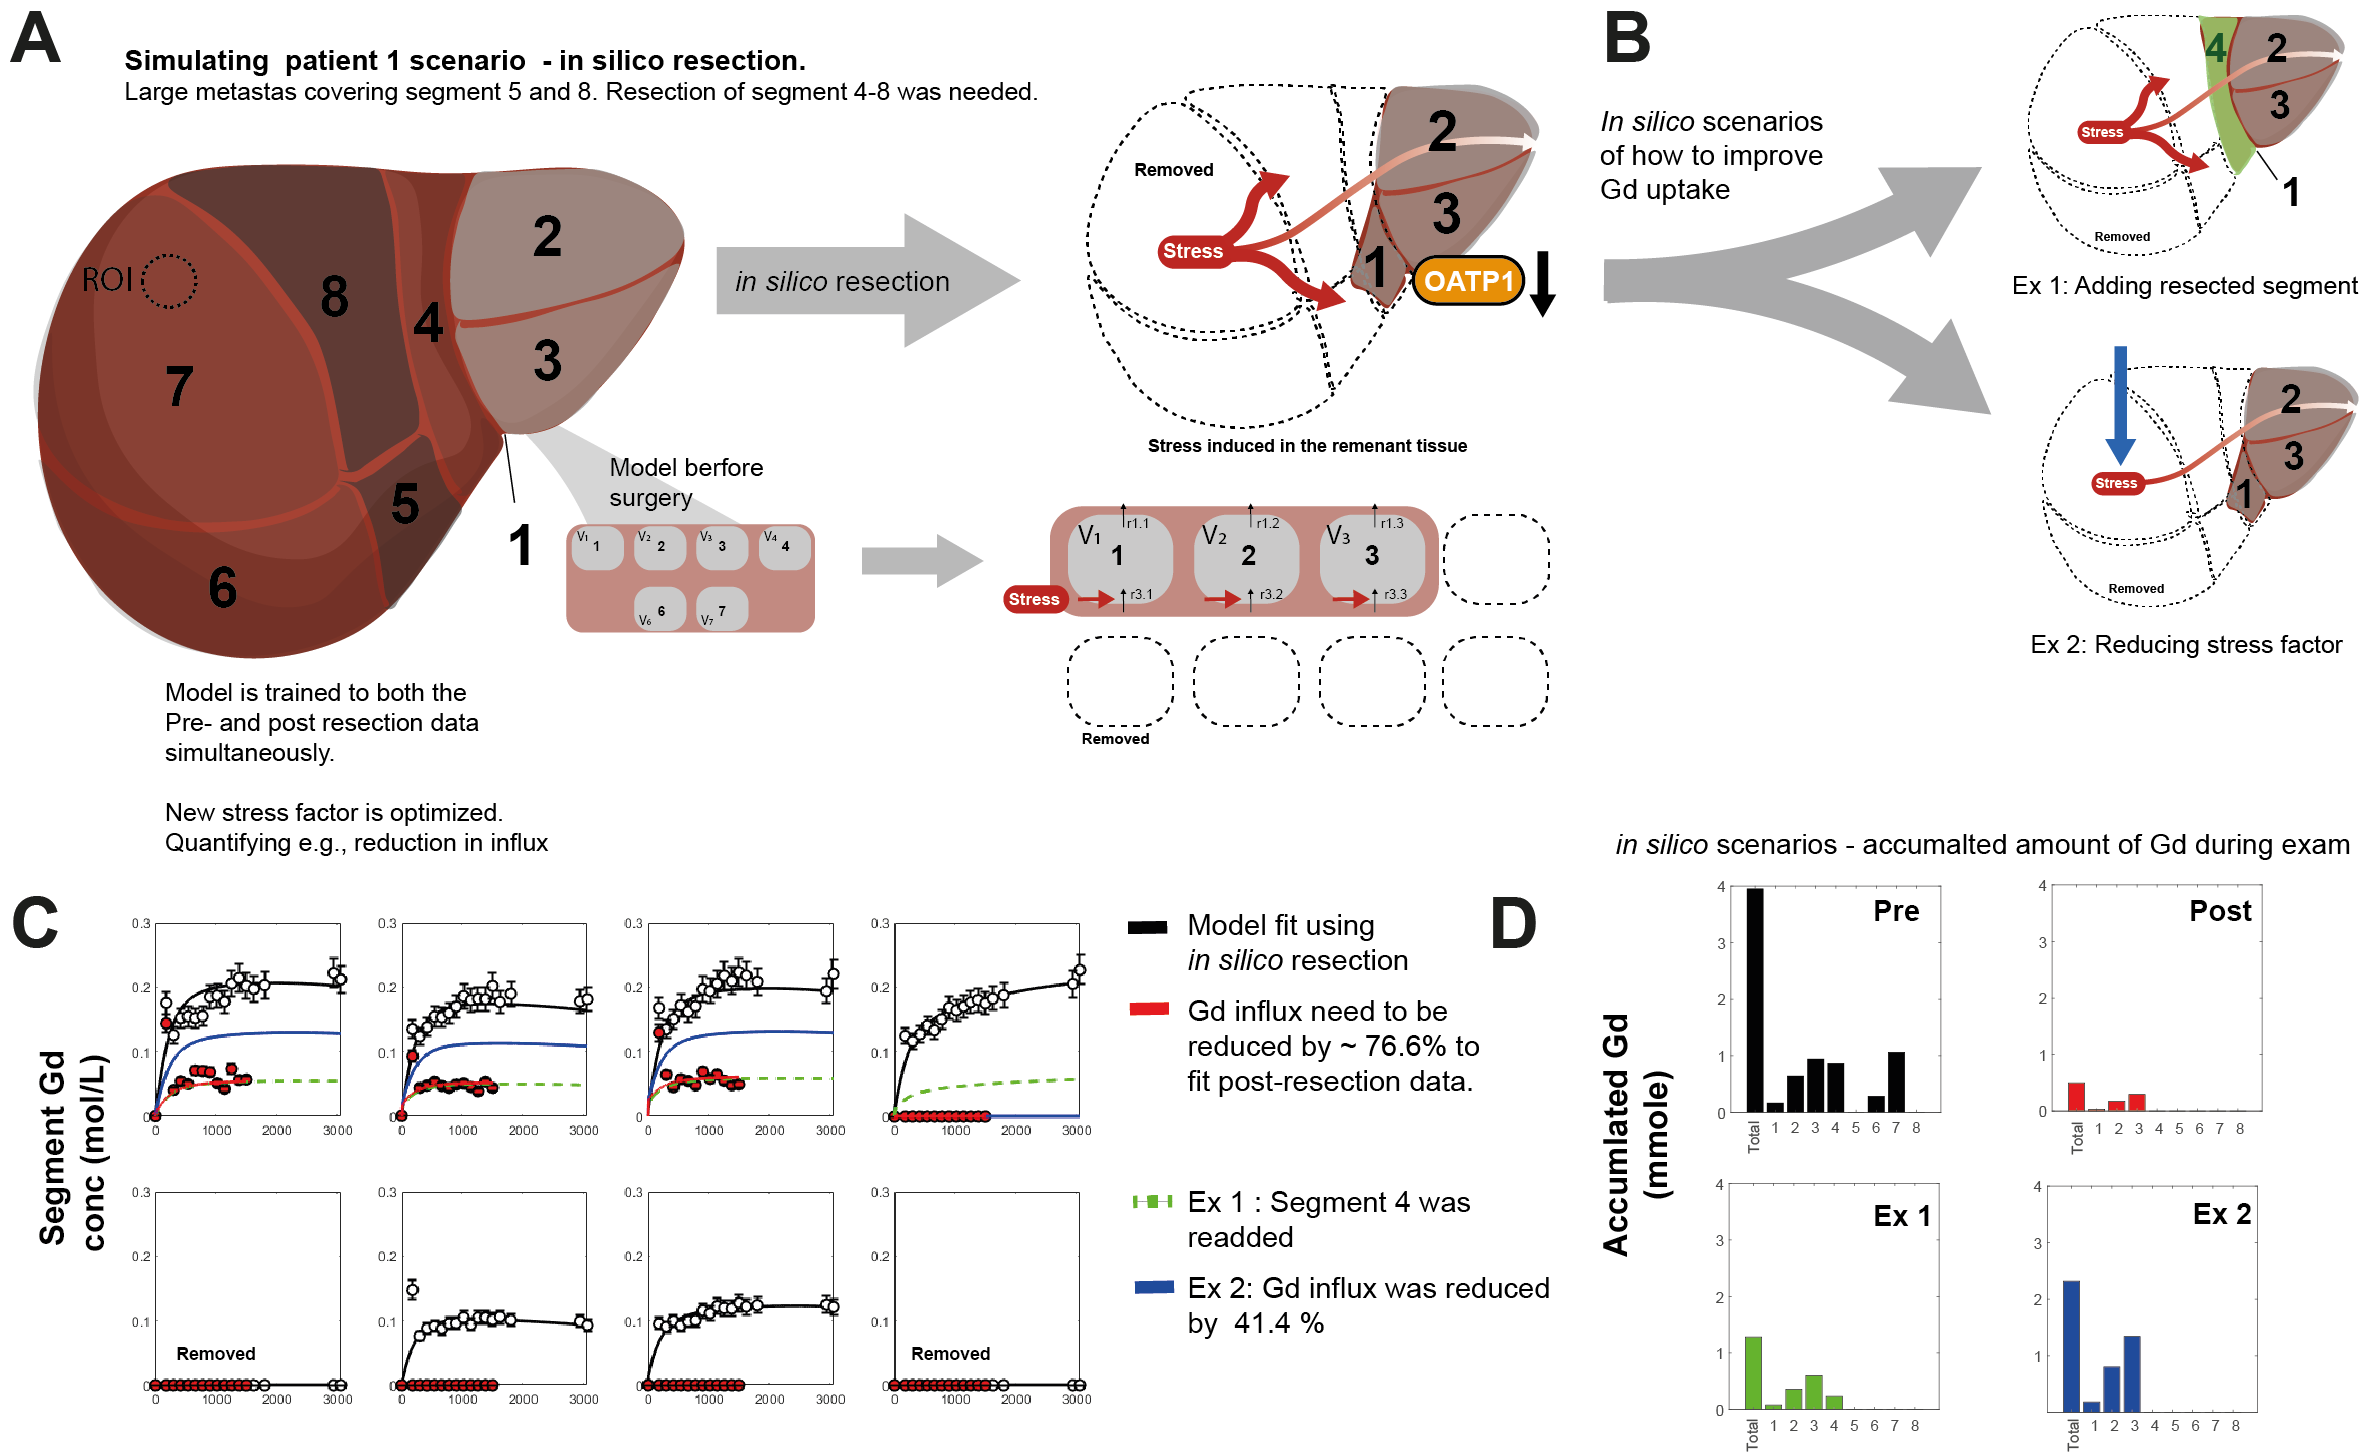
The model fit for the in-silico resection of Pat1 is shown in Fig 4C. The red line shows the Gd3+ conc in segments after surgery. To fit these data the hepatic influx hade to be reduced by a factor of 76.6%. Two scenarios are presented; 1) segment four is not removed (Ex1, green) and 2) and the stress exerted on the remnant segments is lesser (Ex2, blue), both detailed in Fig 4B. In Fig 4D the model predicted accumulated Gd3+ during the MR-examination is shown. Both Ex1 and Ex2 would improve the amount of Gd3+ retained, as a measure of functional capacity.
Discussion
We have shown that using the described approach we were able to quantify differences both in global (Fig 3A-D) and in regional function (Fig 3 E-G). We also show, as a proof of concept, that an in-silico resection can be performed prior to intervention, allowing us to quantify the difference in hepatobiliary function between pre-and post-surgery. Moreover, different scenarios can be simulated to investigate the extent of retainment of liver function (Fig 4B). However, the in-silico resection approach needs further validation, at present it is a proof-of concept. In future work, we will investigate the correlation between different pre-operative measurements and the ‘stress’ exerted on the hepatobiliary function after surgery. When validated such an approach would be a valuable planning tool in cases when a more precise pre-operative assessment is required.Acknowledgements
No acknowledgement found.References
1. Forsgren MF, Karlsson M, Dahlqvist Leinhard O, Dahlström N, Norén B, Romu T, et al. Model-inferred mechanisms of liver function from magnetic resonance imaging data: Validation and variation across a clinically relevant cohort. PLOS Computational Biology. 2019;15(6):e1007157.
2. Forsgren MF, Leinhard OD, Dahlström N, Cedersund G, Lundberg P. Physiologically realistic and validated mathematical liver model revels hepatobiliary transfer rates for Gd-EOB-DTPA using human DCE-MRI data. PLoS ONE. 2014;9(4):e104570.
3. Nasr P, Forsgren MF, Ignatova S, Dahlström N, Cedersund G, Leinhard OD, et al. Using a 3% Proton Density Fat Fraction as a Cut-off Value Increases Sensitivity of Detection of Hepatic Steatosis, Based on Results from Histopathology Analysis. Gastroenterology. 2017;153(1):53-5.
4. Karlsson M, Ekstedt M, Dahlström N, Forsgren MF, Ignatova S, Norén B, et al. Liver R2* is affected by both iron and fat: A dual biopsy-validated study of chronic liver disease. J Magn Reson Imaging. 2019;50(1):325-33.
5. Schmidt H, Jirstrand M. Systems Biology Toolbox for MATLAB: a computational platform for research in systems biology. Bioinformatics. 2006;22(4):514-5.
6. Egea JA, Henriques D, Cokelaer T, Villaverde AF, MacNamara A, Danciu D-P, et al. MEIGO: an open-source software suite based on metaheuristics for global optimization in systems biology and bioinformatics. BMC Bioinformatics. 2014;15(1):136.
Figures