4180
Fiber-specific white matter reductions in older adults with metabolic syndrome1Department of Radiology, Juntendo University Graduate School of Medicine, Tokyo, Japan, 2Department of Radiology, Tokyo Metropolitan Geriatric Hospital and Institute of Gerontology, Tokyo, Japan, 3Sportology Center, Juntendo University Graduate School of Medicine, Tokyo, Japan, 4Department of Metabolism & Endocrinology, Juntendo University Graduate School of Medicine, Tokyo, Japan, 5Department of Radiology, Toho University Omori Medical Center, Tokyo, Japan
Synopsis
We performed fixel-based analysis, which implements the Multi-Shell Multi-Tissue Constrained Spherical Deconvolution method, to investigate the effect of metabolic syndrome (MetS) on fiber-specific white matter (WM) integrity and assess its association with MetS-related components or cognitive or motor functions. Our findings provide evidence of WM degeneration, as reflected by reduced microstructural fiber density and macrostructural fiber bundle cross-section, in regions associated with cognitive and motor functions in MetS. We also observed reduced fiber density in the corticospinal tract in preMetS. Finally, our findings clarified visceral fat accumulation, insulin resistance, and arterial stiffness as risk factors for WM alterations in MetS.
INTRODUCTION
Metabolic syndrome (MetS) is a complex of interrelated risk factors for cardiovascular disease and type 2 diabetes 1. MetS components share pathways leading to metabolic, inflammatory, and microvascular disturbances that may contribute to white matter (WM) microstructural alterations 2, 3. We used fixel-based analysis (FBA) to investigate the effect of MetS on fiber-specific WM integrity and assess its associations with MetS-related components or cognitive/motor functions.METHODS
SubjectsWe included data of 119 older adults (46 with MetS, 57 with preMetS [those with one or two MetS risk factors], and 16 healthy controls [HCs; those with no risk factors]) from the Bunkyo Health Study (Table 1) 4. MetS was defined as the presence of three or more of the five risk factors established by the International Diabetes Federation and American Heart Association/National Heart, Lung, and Blood Institute (Figure 1) 5.
Diffusion-weighted imaging acquisition
Diffusion-weighted images (DWIs; b-values, 1000 and 2000 s/mm2; 1 b0; 64 diffusion gradients) were acquired on a 3T system using echo-planar imaging.
FBA
MRtrix3 6 following the recommended FBA pipeline was used to preprocess DWIs 7. The Multi-Shell Multi-Tissue Constrained Spherical Deconvolution method was then used to compute the fiber orientation distributions 8. The following fixel-based metrics were obtained 7:
- Fiber density (FD) within a fiber bundle.
- Fiber-bundle cross-section (FC). FC was then log-transformed (log-FC) to ensure zero-centered normally distributed data.
- Fiber density and cross-section (FDC) reflect microscopic (FD) and macroscopic (FC) levels.
Region-of-interest analysis
The average fixel-based metrics were extracted in WM areas associated with MetS (Figure 2), including the anterior thalamic radiation (ATR), corticospinal tract (CST), cingulum cingulate gyrus (CCG), inferior fronto-occipital fasciculus (IFOF), inferior longitudinal fasciculus (ILF), superior longitudinal fasciculus (SLF), uncinate fasciculus (UF), forceps major, genu, body, and splenium of the corpus callosum (CC), cerebral peduncle (CP), middle (MCP), and superior (SCP) cerebellar peduncle 2.
Statistical analysis
For whole-brain FBA, a general linear model (GLM) was used to compare fixel-based metrics between groups. Nonparametric permutation testing (10,000 iterations) was used to assign family-wise error-corrected P-values (α: P < 0.05). For region-of-interest (ROI) analysis, GLM univariate analysis was used for between-group comparisons of fixel-based metrics followed by posthoc pairwise comparisons. Partial correlation tests were performed to assess the associations between fixel-based metrics and clinical measures (Table 1) in the preMetS and MetS groups combined. Bonferroni correction was used for multiple between-group comparisons (14 WM areas × 3 groups; α: P < 0.0012) and in the correlation analyses (14 WM areas; α: P < 0.0036). Age and sex were included as covariates in all analyses. Further, log-transformed intracranial volume was used as a covariate for log-FC and FDC in the between-group comparison to remove global effects of brain scaling from the template registration 7, 9.
RESULTS
Whole-brain FBAMetS had significantly lower FD in the splenium of the CC and bilateral posterior limb of the internal capsule; log-FC in the bilateral CST, CP, and SCP; and FDC in the left anterior limb of the internal capsule and bilateral CST, CP, mammillothalamic tract, MCP, and SCP than in HCs (Figure 3). No significant differences were observed between other groups.
ROI analysis
Between-group comparison (Figure 4): FD was significantly lower in the ATR, CP, and CST in MetS than in HCs and in the CST in preMetS than in HCs. Compared with HCs, MetS had significantly lower log-FC in the CP and CST and FDC in the ATR, CP, CST, and SCP than in HCs. Significantly lower FDC was observed in the ATR, CP, CST, and SCP in MetS than in HCs.
Correlation analysis: Significant negative correlations were observed between log-FC and visceral fat area measured by MRI in the ATR (r = -0.32), ILF (r = -0.29), IFOF (r = -0.32), and SLF (r = -0.35); the Trail Making Test (TMT [B–A]) in the IFOF (r = -0.32); the cardio-ankle vascular index in the CST (r = -0.37) and CP (r = -0.33); or the homeostatic model assessment of insulin resistance in the ATR (r = -0.32), CST (r = -0.34), MCP (r = -0.32), and CP (r = -0.30), as well as between FDC and HOMA-IR in the CST (r = -0.29).
DISCUSSION
The proinflammatory effects of insulin and leptin resistance caused blood-brain barrier breakdown in MetS, which lead to immune infiltration into the parenchyma and neuronal death 11. Using FBA, axonal loss and atrophy with a reduced ability to relay information between the brain regions were observed in preMetS and MetS, with more extensive axonal damage noted in MetS. We also clarified the relationship between WM alterations and visceral fat accumulation, insulin resistance, or arterial stiffness in MetS. MetS affects cognition, increases the risk of dementia 2, and is associated with poorer locomotive function 12. The changes of fixel-based metrics were demonstrated within WM fiber pathways associated with cognitive and motor functions in MetS. Furthermore, we observed the association between axonal atrophy and cognitive flexibility and executive dysfunctions in MetS 10.CONCLUSION
We demonstrated the association between fiber-specific WM degeneration and cognitive and motor dysfunctions in MetS using FBA. Further, we clarified visceral fat accumulation, insulin resistance, and arterial stiffness as independent risk factors for WM alterations in MetS.Acknowledgements
The authors have no conflicts of interest to declare.References
- Eckel RH, Grundy SM, Zimmet PZ. The metabolic syndrome. Lancet 2005;365:1415-28
- Alfaro FJ, Gavrieli A, Saade-Lemus P, et al. White matter microstructure and cognitive decline in metabolic syndrome: a review of diffusion tensor imaging. Metabolism 2018;78:52-68
- Shimoji K, Abe O, Uka T, et al. White matter alteration in metabolic syndrome: diffusion tensor analysis. Diabetes Care 2013;36:696-700
- Someya Y, Tamura Y, Kaga H, et al. Skeletal muscle function and need for long-term care of urban elderly people in Japan (the Bunkyo Health Study): a prospective cohort study. BMJ Open 2019;9:e031584
- Alberti KG, Eckel RH, Grundy SM, et al. Harmonizing the metabolic syndrome: a joint interim statement of the International Diabetes Federation Task Force on Epidemiology and Prevention; National Heart, Lung, and Blood Institute; American Heart Association; World Heart Federation; International Atherosclerosis Society; and International Association for the Study of Obesity. Circulation 2009;120:1640-5
- Tournier JD, Smith R, Raffelt D, et al. MRtrix3: A fast, flexible and open software framework for medical image processing and visualisation. Neuroimage 2019;202:116137
- Raffelt DA, Tournier JD, Smith RE, et al. Investigating white matter fibre density and morphology using fixel-based analysis. Neuroimage 2017;144:58-73
- Jeurissen B, Tournier JD, Dhollander T, et al. Multi-tissue constrained spherical deconvolution for improved analysis of multi-shell diffusion MRI data. Neuroimage 2014;103:411-26
- Smith RE, Dhollander T, Connelly A. On the regression of intracranial volume in Fixel-Based Analysis. 27th International Society of Magnetic Resonace in Medicine. Montreal, Canada; 2019
- Corrigan JD, Hinkeldey NS. Relationships between parts A and B of the Trail Making Test. J Clin Psychol 1987;43:402-9
- Van Dyken P, Lacoste B. Impact of Metabolic Syndrome on Neuroinflammation and the Blood-Brain Barrier. Front Neurosci 2018;12:930
- Nakamura M, Kobashi Y, Hashizume H, et al. Locomotive syndrome is associated with body composition and cardiometabolic disorders in elderly Japanese women. BMC Geriatr 2016;16:166
Figures
Figure 2. White matter regions of interest.
Abbreviations: ATR, anterior thalamic radiation; CC, corpus callosum; CP, cerebral peduncle; CST, corticospinal tract; ILF, inferior longitudinal fasciculus; IFOF, inferior fronto-occipital fasciculus; MCP, middle cerebellar peduncle; SCP, superior cerebellar peduncle; SLF, superior longitudinal fasciculus; UF, uncinate fascicles.
Figure 3. Fiber tract-specific significant (family-wise error-corrected P < 0.05) FD, log-FC, and FDC decreases in subjects with metabolic syndrome relative to those in healthy controls.
Abbreviations: FD, fiber density; FDC, fiber density and cross-section; Log-FC, log-transformed fiber-bundle cross-section.
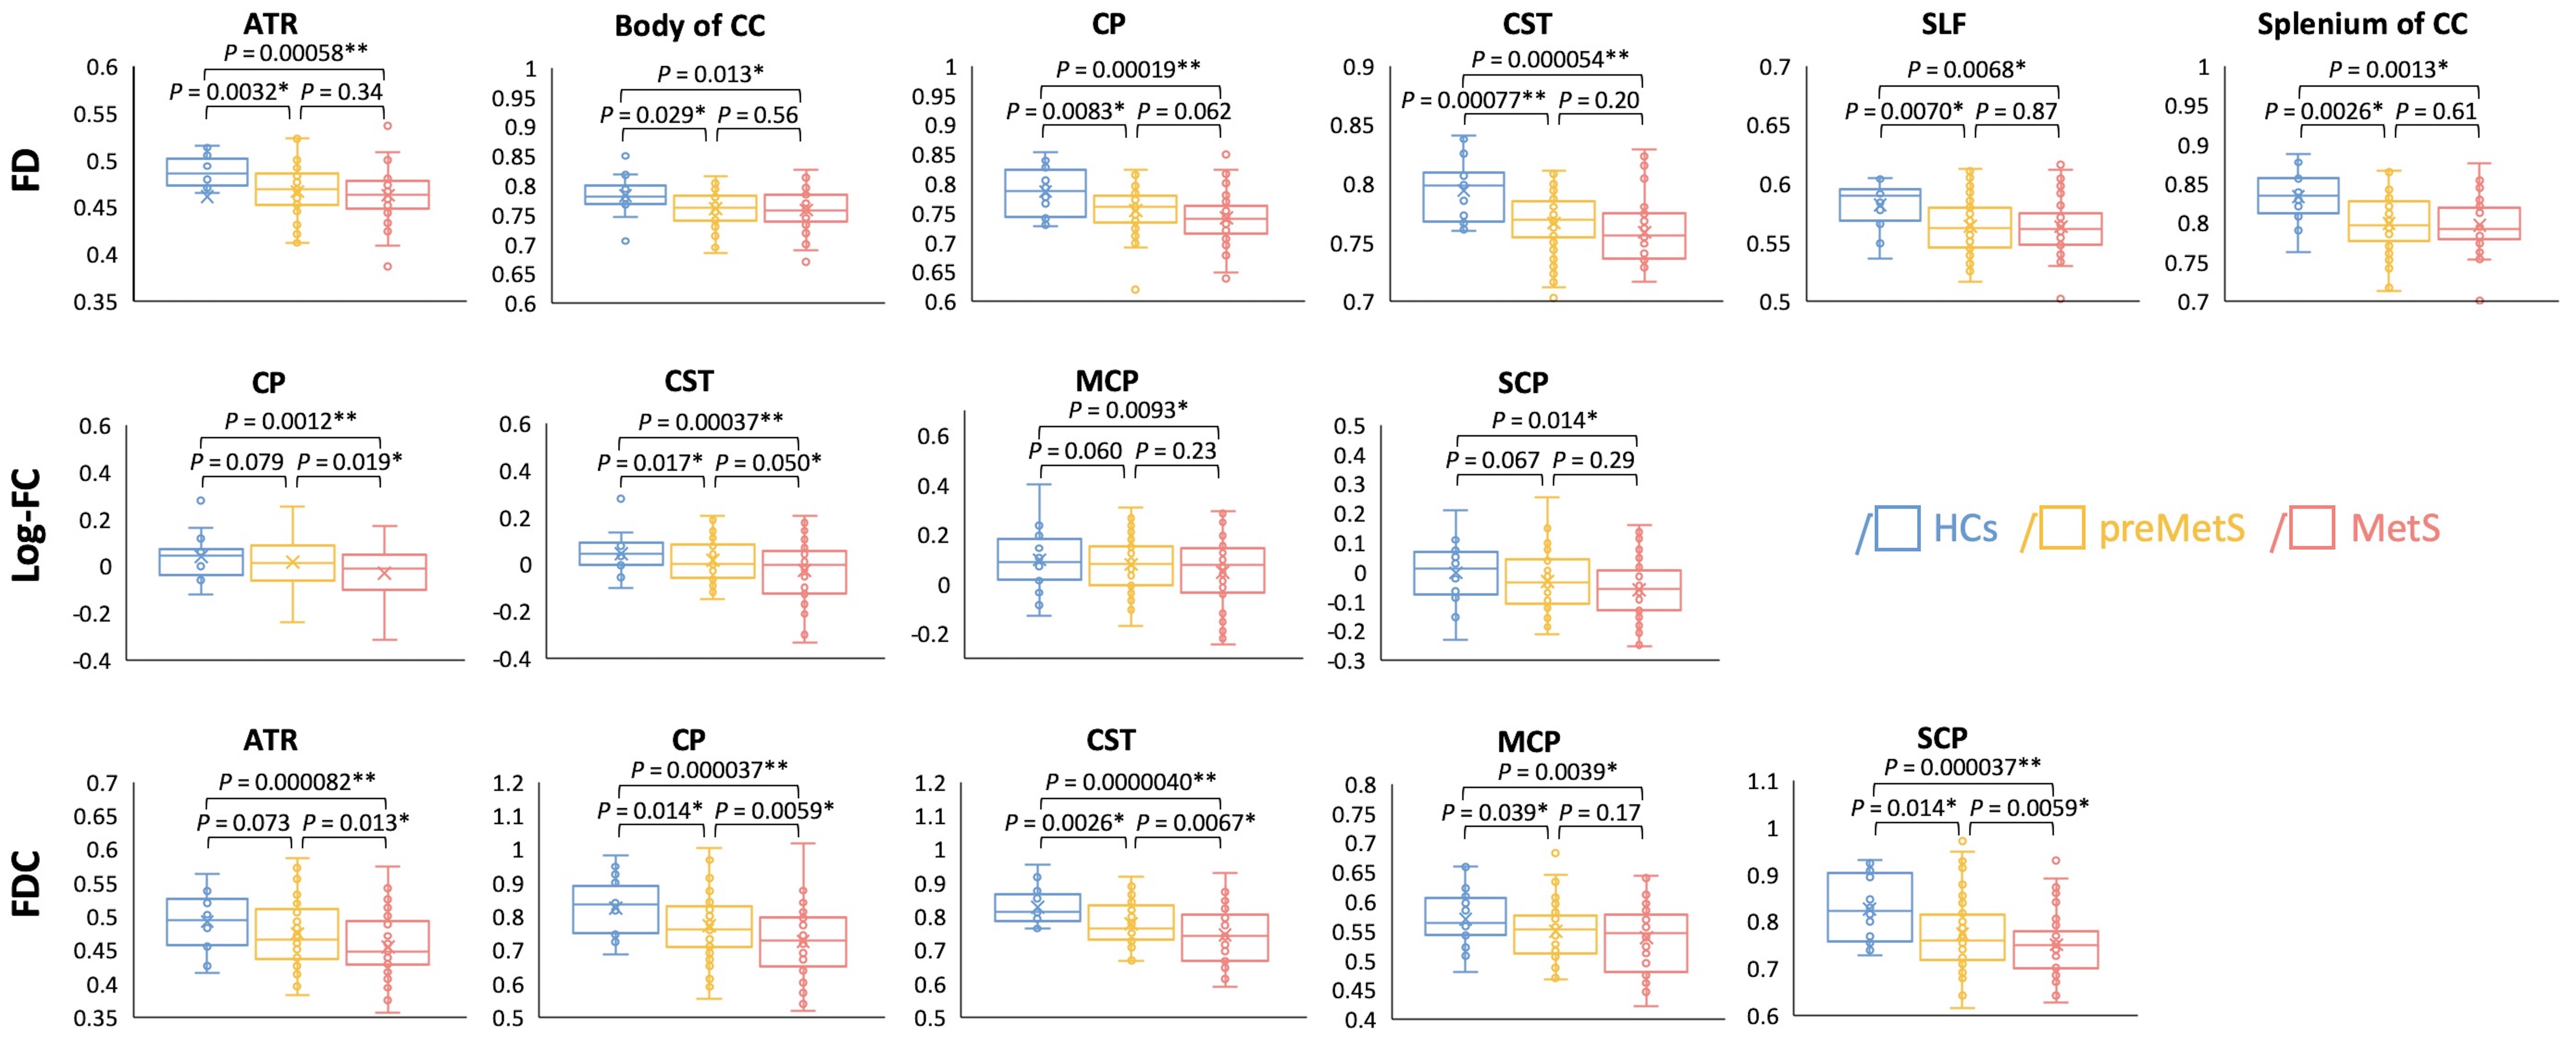
Figure 4. Region-of-interest analysis of white matter regions involved in metabolic syndrome (P < 0.05*, P < 0.0012**).
Abbreviations: ATR, anterior thalamic radiation; CC, corpus callosum; CP, cerebral peduncle; FD, fiber density; FDC, fiber density and cross-section; CST, corticospinal tract; HCs, healthy controls; Log-FC, log-transformed fiber-bundle cross-section; MCP, middle cerebellar peduncle; MetS, metabolic syndrome; SCP, superior cerebellar peduncle; SLF, superior longitudinal fasciculus.