4178
Early Dynamics of Regional Volume and Diffusion Characteristics after Experimental Neonatal Hypoxic Ischemia with Different Damage Outcomes1Department of Biomedical Imaging and Radiological Sciences, National Yang Ming Chiao Tung University, Taipei, Taiwan, 2Department of Pediatrics, National Cheng Kung University Hospital, College of Medicine, National Cheng Kung University, Tainan, Taiwan, 3Department of Medical Imaging and Radiological Sciences, College of Medicine, Chang-Gung University, Taoyuan, Taiwan
Synopsis
To stratify neonates with different outcomes of hypoxic ischemia (HI) within few hours after birth for the subsequent therapeutic hypothermia, the spatiotemporal profile of MR measurements between two severity outcome groups was depicted as early at 6 h after insult. Changes in volumes, ADC and FA values were observed among different brain regions, suggesting different susceptibility of brain regions to HI in the acute phase of HI.
Introduction
Brain hypoxic-ischemia (HI) in perinatal period is associated with morbidity and mortality in neonates.1 Various signs of neonatal HI were found in MR images along the development of brains.2 Specifically, the injury in the hippocampi has been widely detected due to glutamate-mediated cell death.3 However, the injury patterns on MR images acquired in the first few days4 may not aid stratification for the therapeutic hypothermia, which should be initiated within 6 h after birth. In our previous findings, the larger apparent diffusion coefficient (ADC) deficit area in the ipsilateral hemisphere within 6 h after HI was proposed to be highly associated with adverse outcomes.5 However, the sensitivity of brain regions to HI and how it may be correlated to the injured extent were yet explored. In this study, with longitudinal MR scans and quantitative analysis of ADC, fractional anisotropy (FA) map and volumetric information, we demonstrated significant differences in diffusion characteristics and volume in various brain regions along the progress of HI, suggesting susceptibility to HI in the neonatal brain is regional-dependent.Methods
Sprague-Dawley male rat pups (n=10) (BioLASCO Taiwan Co, Taipei City, Taiwan) were anesthetized with 1-2% isoflurane on postnatal day 10 (P10). Unilateral ischemia was induced by permanent ligation of the right common carotid artery with 5-0 surgical silk with Rice-Vannucci model.6 The pups returned to dams after the surgery for 1-h recovery before 2.5 h of hypoxia (8% O2 balanced with N2). Animal MR images including diffusion and anatomical data were acquired within 6 h and at 7 d after HI on a Bruker 7-tesla PharmaScan scanner. According to our previous work, the animals were categorized into the mild (n=5) and moderate (n=5) outcome groups based on the loss of ipsilateral cerebral hemispheric volume at 7 days after HI.5 For region of interest (ROI) analysis, the areas including the body of corpus callosum (c.c.), the cortex including both the visual and auditory cortical region, and the hippocampus were contoured based on FA map, T2w images and atlas7 at the corresponding time points after HI. The differences in the regional volumes and the changes in mean ADC and FA value between the mild versus moderate group at distinct time points were compared using independent and paired t-test, respectively. Regional ADC and FA values were compared using one-way ANOVA, followed by post-hoc tests. All group data was reported as mean ± SD and statistical comparisons were considered significant at P < 0.05.Results & Discussion
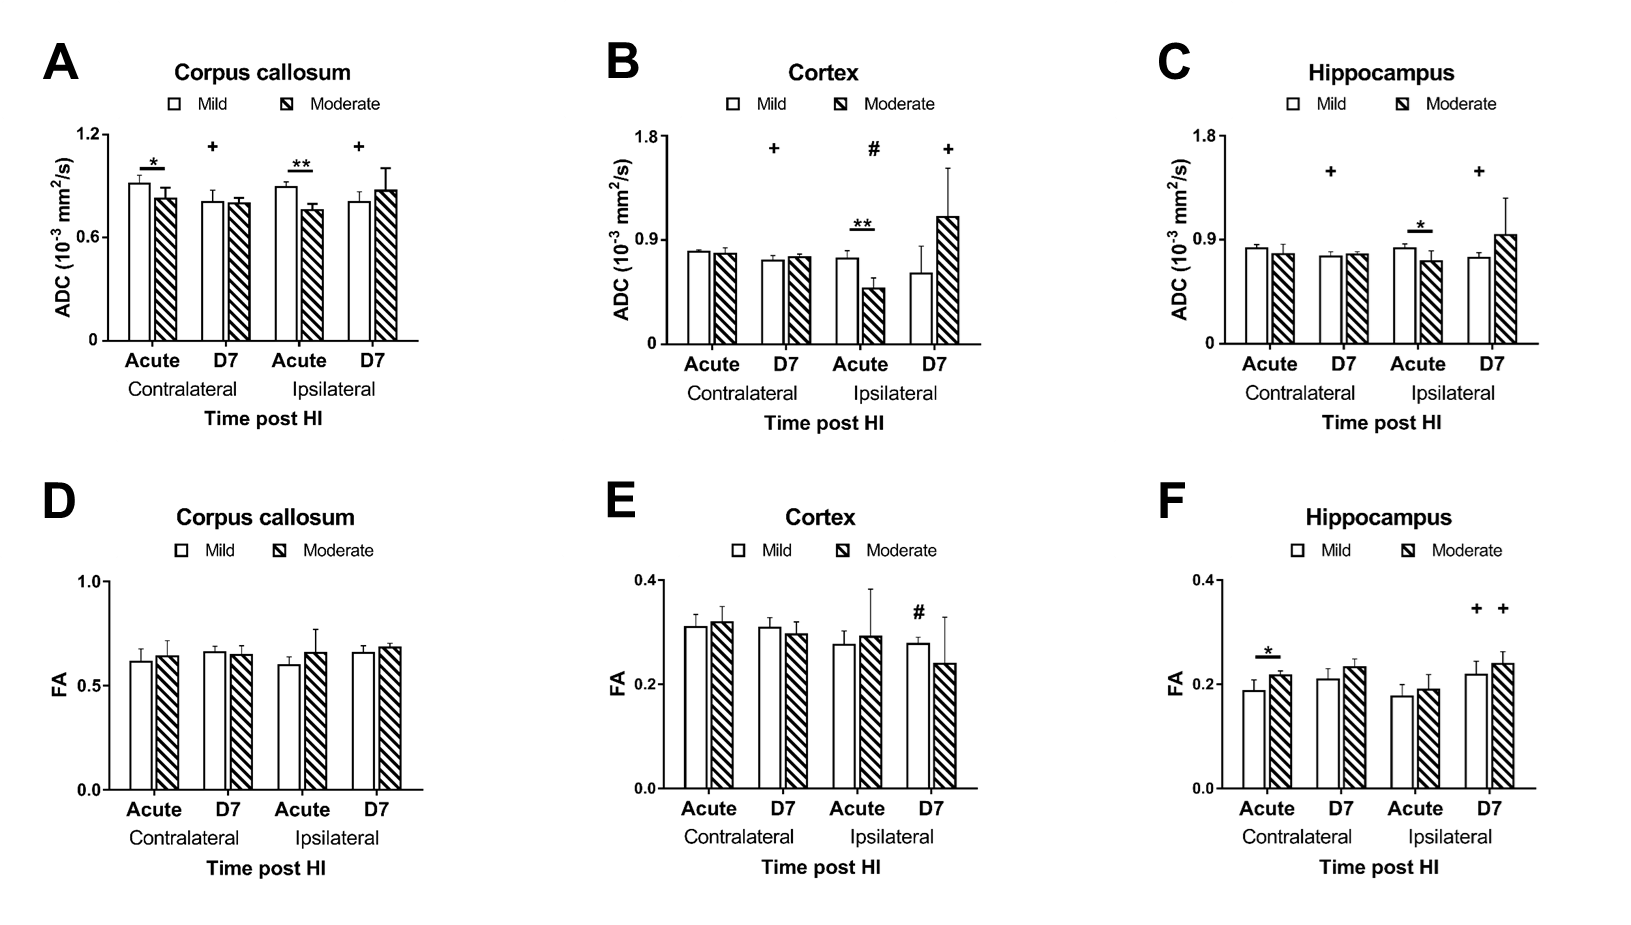
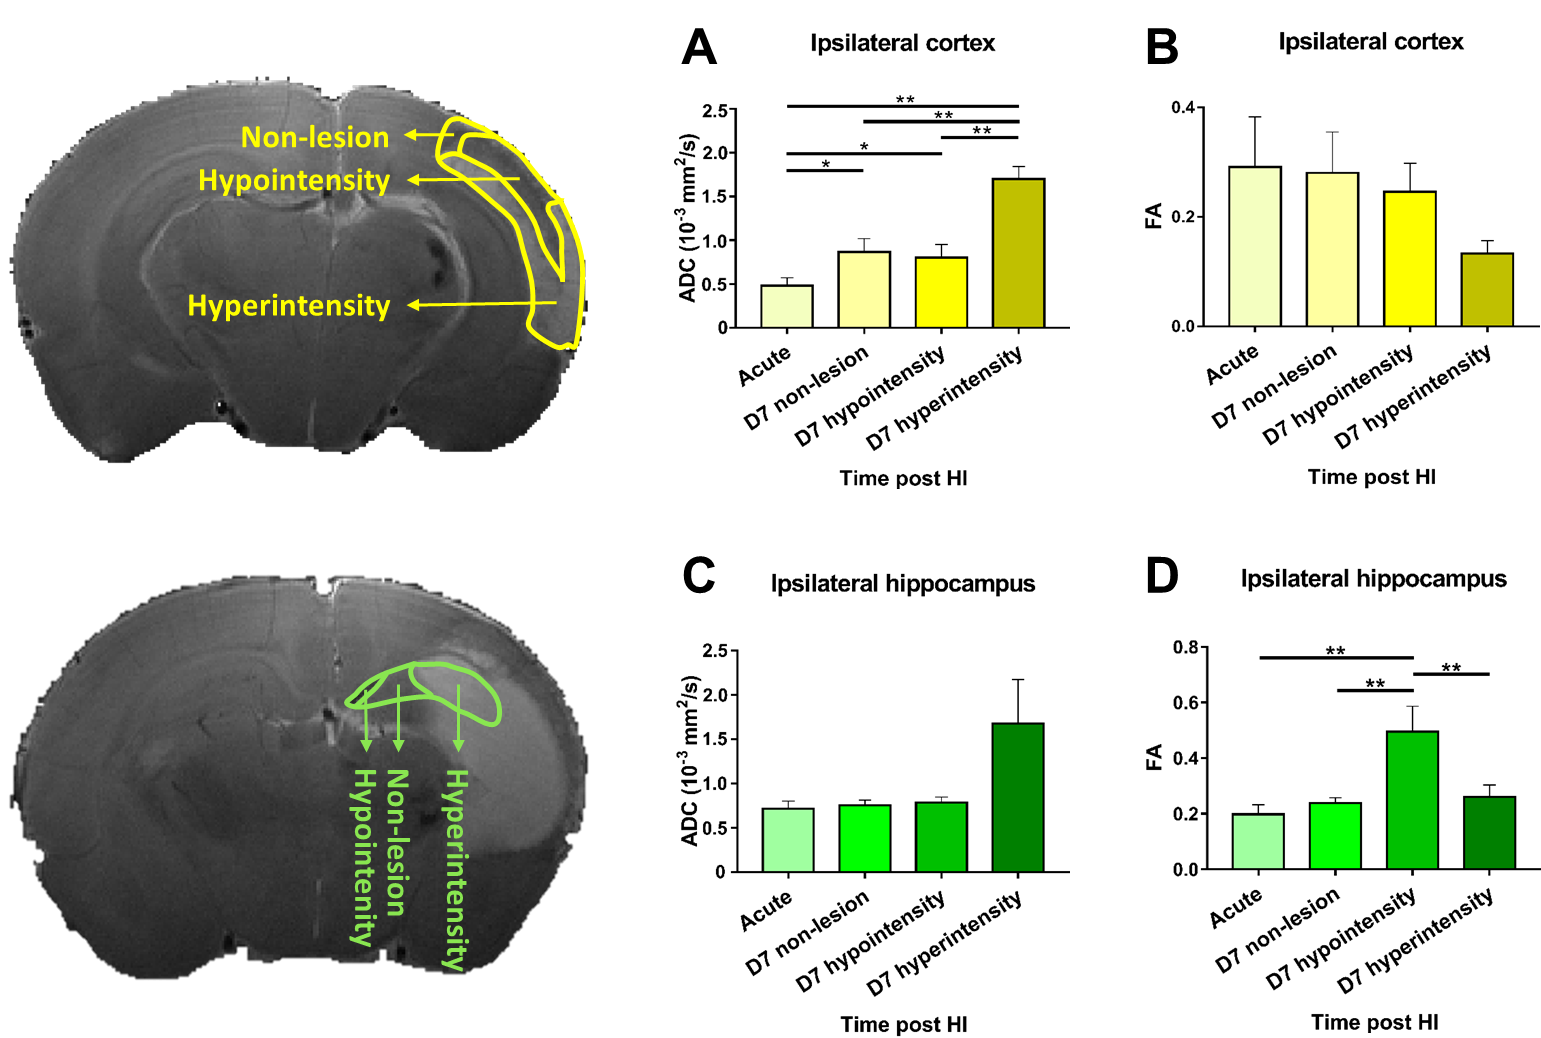
In this study, ADC deficit area in the moderate group was more extensive than the one in mild group within 6 h after HI, suggesting cytotoxic edema (Fig 1C).8 At 7 days after HI, formation of edema in companied with the shifted midline was observed in T2w images in the moderate group, suggesting vasogenic edema (Fig 1C).8 A significant growth of volume in the contralateral cortex and hippocampus in both groups over time was observed. The ipsilateral cortex and hippocampus in the mild group grew normally as well (Fig 2B-C). By contrast, a significant smaller volume in the ipsilateral cortex was found in the moderate group at 7 d after HI (Fig 2B). A significant reduction of the ipsilateral hippocampal volume compared with the contralateral one was observed in both groups at 7 d after HI. Interestingly, a significant reduction of ipsilateral hippocampal volume in the mild group compared with the moderate group was shown within 6 h after HI (Fig 2C). The ADC value in the contralateral c.c., cortex and hippocampus in the mild group reduced significantly over time, suggesting the formation of mature interconnected networks.9 While the reduced ADC was preserved in both ipsilateral c.c. and hippocampus in the mild group (Fig 3A and C), no significant changes in ADC value in the cortex over time (Fig 3B), suggesting that HI may alter cortical microstructural arrangements during development even after mild injury.10 Compared with the contralateral hemisphere, the ADC in ipsilateral cortex was significantly lower in the moderate group within 6 h after HI. However, the ipsilateral cortical ADC value increased significantly at 7 d after HI majorly due to the formation of edema (Fig 1C and 3B). At 7 d after HI, the ipsilateral cortical FA value was significantly lower in the mild group (Fig 3E). For quantitative comparisons of MR characteristics between two outcome groups, within 6 h after HI, ADC value reduced significantly in all ipsilateral ROIs in the moderate group (Fig 3A-C).11 The FA value in the contralateral hippocampus significantly increased in the moderate group within 6 h after HI (Fig 3F). At 7 days after HI, we further segmented the ipsilateral cortex and hippocampus into ROIs with non-lesion, hypointensity, and hyperintensity, respectively, based on T2w images (Fig 4). The ADC value in the cortical ROI with hyperintensity was significantly greater than other parts (Fig 4A). Moreover, the FA in the hippocampal ROI with hypointensity was significantly greater than others (Fig 4D). Further study will attempt to add the severe group to compare the differences among the corresponding DTI matrices, and address how the regional change in volume or diffusion characteristics predicts the final outcome.Acknowledgements
This study was funded in part by Ministry of Science and Technology (MOST 109-2314-B-A49A-550 and MOST 109-2314-B-010-067-MY3), Taipei, Taiwan.References
1. Moretto M, Arteni N, Lavinsky D, et al. Hypoxic-ischemic insult decreases glutamate uptake by hippocampal slices from neonatal rats: prevention by guanosine. Experimental neurology 2005; 195(2): 400-6.
2. Woodward LJ, Anderson PJ, Austin NC, Howard K, Inder TE. Neonatal MRI to predict neurodevelopmental outcomes in preterm infants. New England Journal of Medicine 2006; 355(7): 685-94.
3. Kasdorf E, Engel M, Heier L, Perlman JM. Therapeutic hypothermia in neonates and selective hippocampal injury on diffusion-weighted magnetic resonance imaging. Pediatric neurology 2014; 51(1): 104-8.
4. Fatemi A, Wilson MA, Johnston MV. Hypoxic-ischemic encephalopathy in the term infant. Clinics in perinatology 2009; 36(4): 835-58.
5. Kao Y-CJ, Chen S-H, Lu C-F, et al. Early neuroimaging and ultrastructural correlates of injury outcome after neonatal hypoxic-ischaemia. Brain communications 2021; 3(2): fcab048.
6. Rice JE, Vannucci RC, Brierley JB. The influence of immaturity on hypoxic‐ischemic brain damage in the rat. Annals of Neurology: Official Journal of the American Neurological Association and the Child Neurology Society 1981; 9(2): 131-41.
7. Khazipov R, Zaynutdinova D, Ogievetsky E, et al. Atlas of the postnatal rat brain in stereotaxic coordinates. Frontiers in neuroanatomy 2015; 9: 161.
8. Nedelcu J, Klein MA, Aguzzi A, Martin E. Resuscitative hypothermia protects the neonatal rat brain from hypoxic‐ischemic injury. Brain Pathology 2000; 10(1): 61-71.
9. Breu M, Reisinger D, Tao L, et al. In vivo high-resolution diffusion tensor imaging of the developing neonatal rat cortex and its relationship to glial and dendritic maturation. Brain Structure and Function 2019; 224(5): 1815-29.
10. Liu Y, D’Arceuil HE, Westmoreland S, et al. Serial diffusion tensor MRI after transient and permanent cerebral ischemia in nonhuman primates. Stroke 2007; 38(1): 138-45.
11. Schlaug G, Siewert B, Benfield A, Edelman R, Warach S. Time course of the apparent diffusion coefficient (ADC) abnormality in human stroke. Neurology 1997; 49(1): 113-9.
Figures