4176
Venous Response in Brains with Ischemic Stroke Assessed with Susceptibility-Based MR Imaging1Shenzhen Institutes of Advanced Technology, Chinese Academy of Sciences, Shenzhen, China, 2University of Chinese Academy of Sciences, Beijing, China, 3Department of Neurology, Peking University Shenzhen Hospital, Shenzhen, China, 4Department of Radiology, Beijing University Shenzhen Hospital, Shenzhen, China
Synopsis
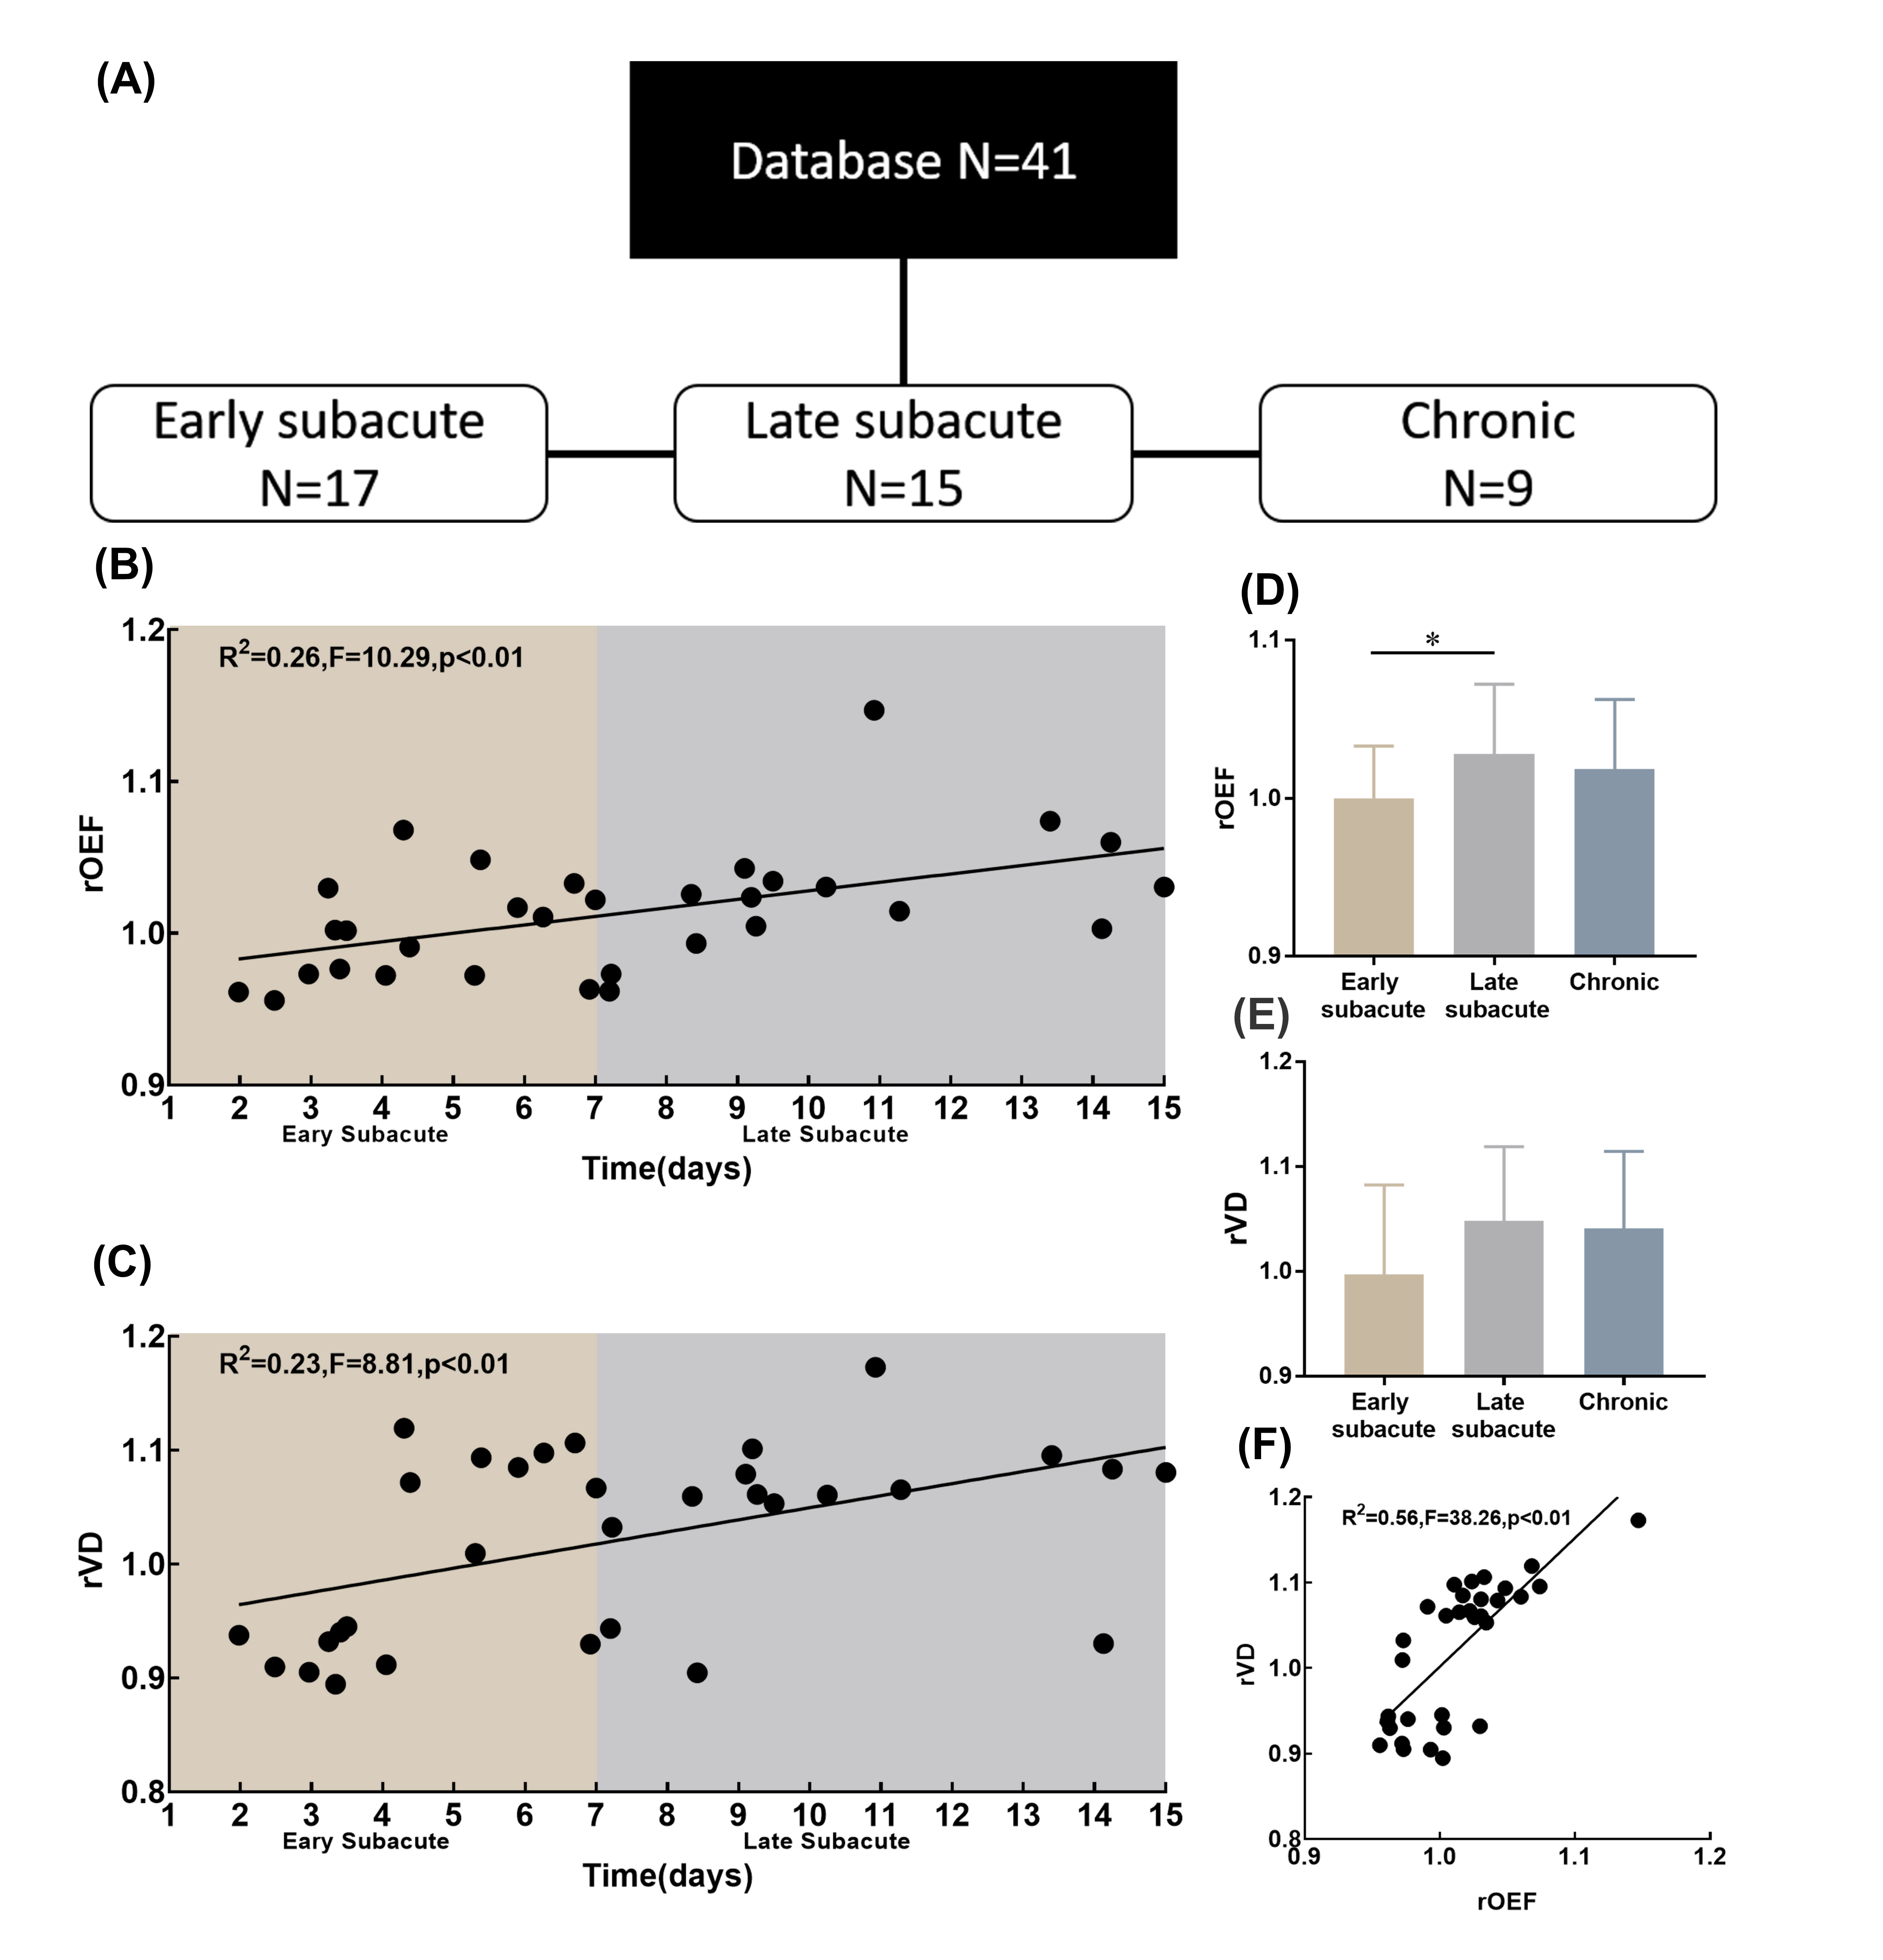
Venous response has been overlooked in the characterization of ischemic stroke (IS). In this study, vein density (VD) and oxygen extraction fraction (OEF) were assessed as indices of venous response for both the ipsi- and contra-lesional hemispheres in a cohort of patient with corona radiata IS using susceptibility MR imaging. Relative VD and OEF (ratios between the averaged ipsilesional and contralesional measurements) increased from early (1-7 days) to late subacute stages of IS (7-15 days). Patients with lesion in right corona radiata showed more extensive interhemispheric difference in OEF, suggesting an anatomy specific distribution of the venous response after IS.
Introduction
Ischemic stroke (IS) is one of the leading causes of global mortality and disability. Although recanalization of the occluded artery is able to restore blood supply to the ischemic brain area, symptoms persist or deteriorate in up to 50% the patients.1 Sustained neutrophil infiltration and blood clotting in venules and cortical venous dilation were observed in both animal and human brain imaging,2, 3 suggesting a venous response in the pathological scope of IS. However, the spatiotemporal profile of venous response following IS remains unclear. In this study, we aimed to probe the distribution of venous response by quantifying the venous density (VD) and oxygen extraction fraction (OEF) simultaneously based on susceptibility weight imaging (SWI).Methods
This study was approved by local institutional review board. Fourty-one subjects (male/female 27/14, aged 65.9±13.4 years) with first ever ischemic stroke and known stroke age were consecutively recruited. Stroke age was phased as early subacute (stroke age=1-7 days), late subacute (stroke age=8-15 days) and chronic (stroke age>15 days). MR images were acquired on a 1.5T scanner (Siemens, Avanto, Germany) with a 12-channel phased array head coil. Gradient echo pulse (GRE) was employed for SWI with TR/TE 49/40ms, FA 15°, field of view = 23 × 23 cm, acquisition matrix=320*221. In addition, T1 weighted and diffusion weighted images (b value = 1000 s/mm2) were obtained with standardized parameters to facilitate the visualization of the IS lesion. Quantitative susceptibility map (QSM) was reconstructed using the morphology enabled dipole inversion (MEDI) method. 4 SWI and QSM were spatially normalized to standard Montreal Neurological Institute template space. Automated vein segmentation was performed using three healthy prior atlas (manual veins, SWI, QSM) 5 and individual data (SWI, QSM). OEF was estimated from QSM images in a volume-of-interest (VOI) based on following equation:$$OEF=\frac{\triangle\chi\times{Pv}}{\triangle\chi_{do}\times{Hct}}$$
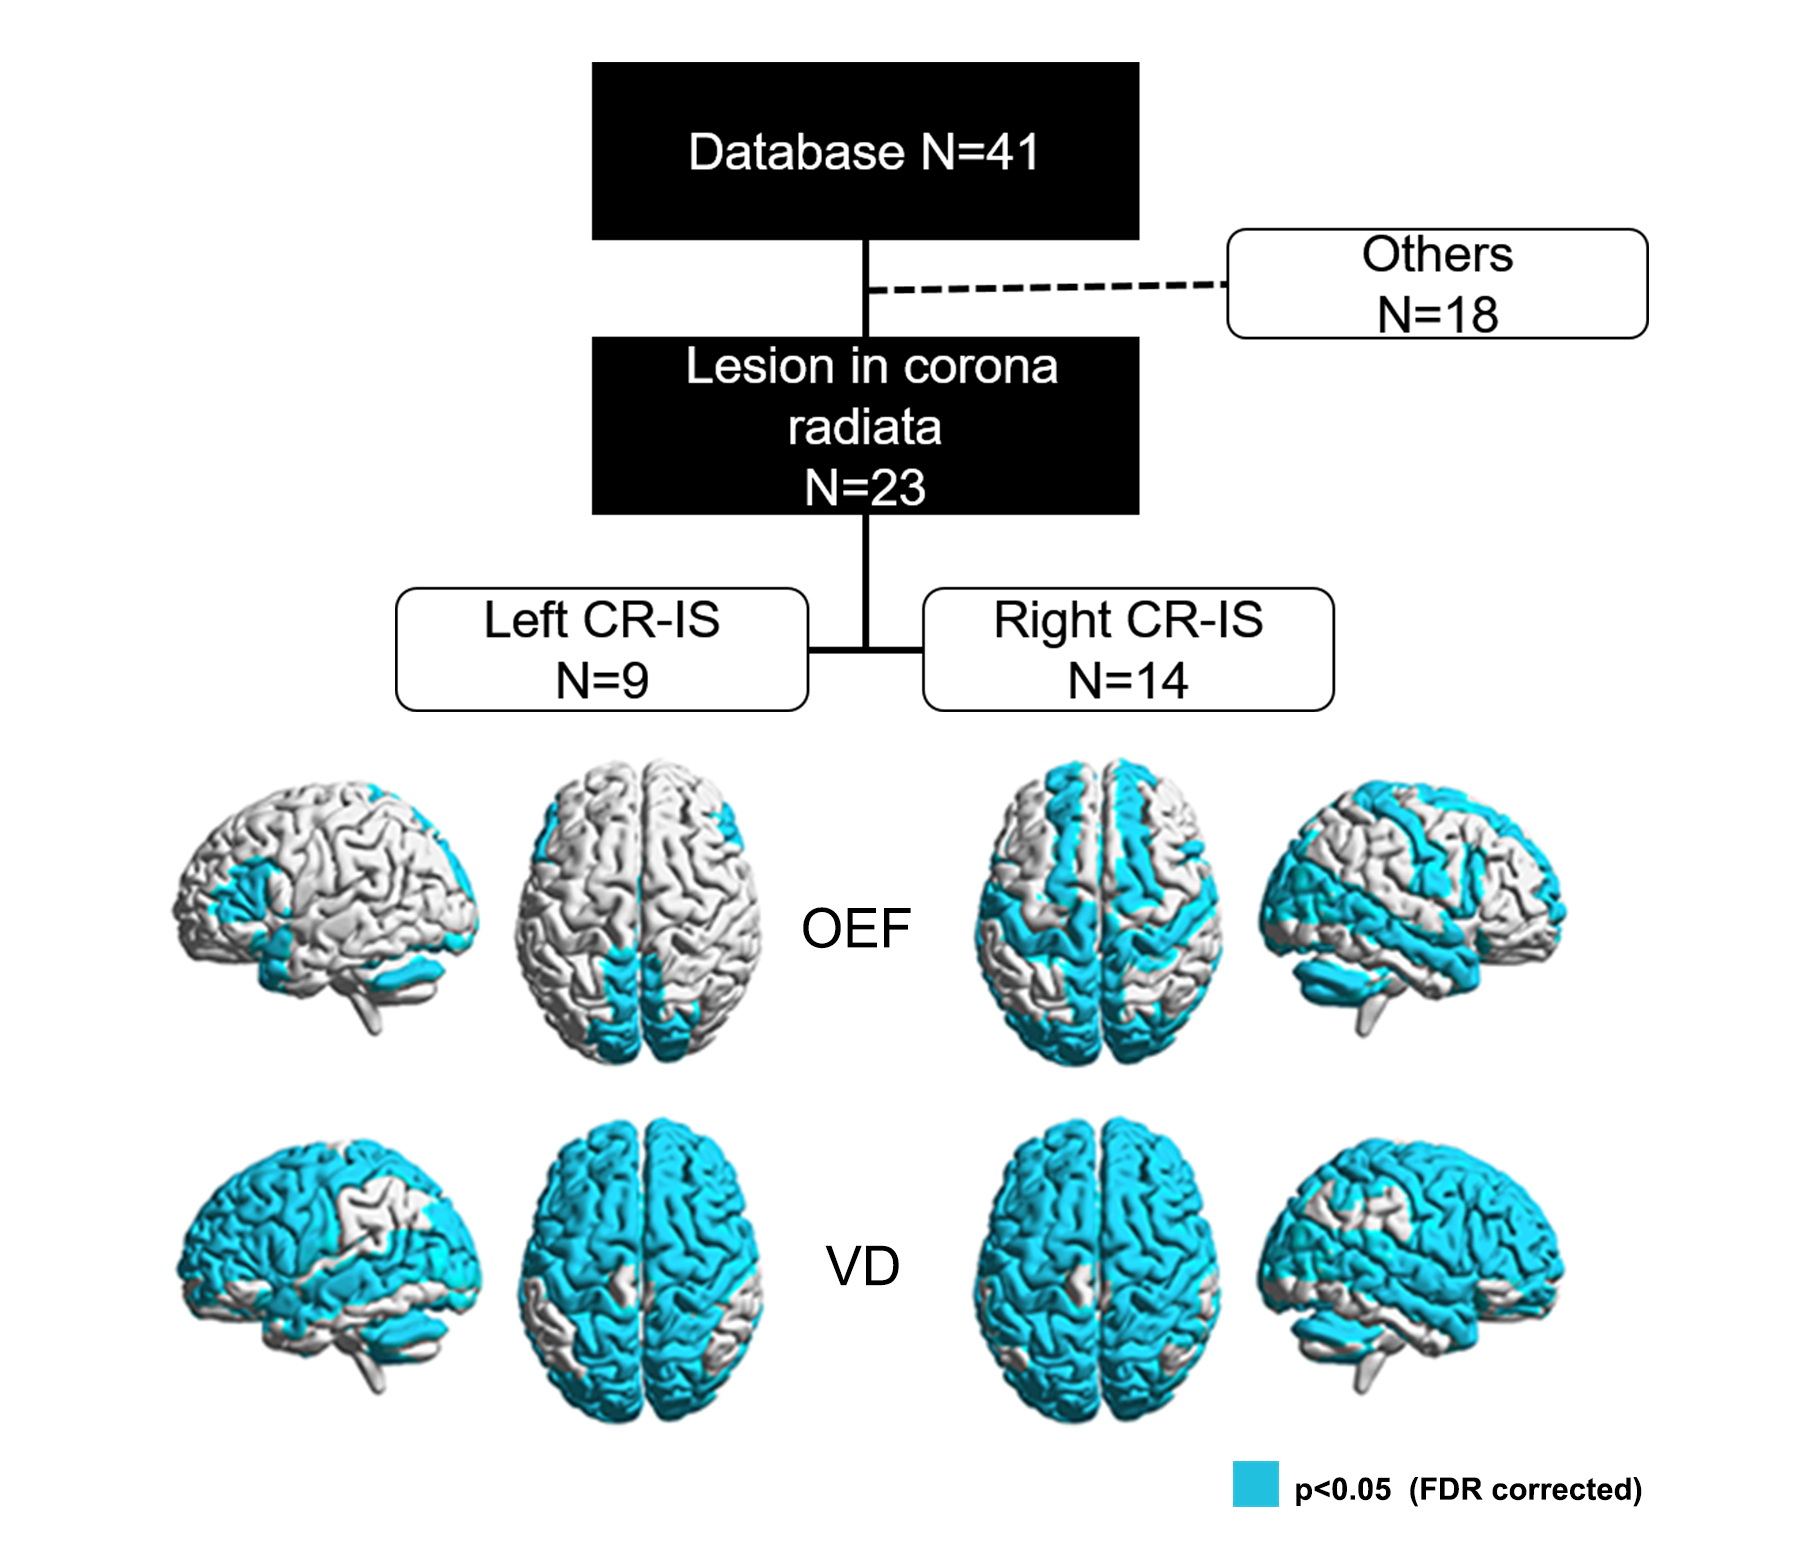
where is the susceptibility differences between venous structure and surrounding brain tissues that was calculated by QSM, ($$$1.8\times{10}^{-7}$$$ in CGS units) is the susceptibility difference per unit hematocrit (empirically set as 0.45) between fully deoxygenated blood and fully oxygenated blood, Pv(set as 6) is the partial volume effects correction factor. VOI that slid in X and Y directions was applied to whole images and OEF maps were generated on a slice-by-slice basis. The ischemic lesion was segmented using ITK-SNAP with established procedures6, and excluded in the subsequent venous response analysis. Vein density defined as the sum of vessel voxels divided by the sum of voxels in a region of interest. Relative oxygen extraction fraction (rOEF) and relative vein density (rVD) were calculated as the ratios between the averaged ipsilesional and the contralateral measurements. Pearson’s correlation was conducted to examine the bivariate correlation between rVD, rOEF and stroke age. Out of the 41 cases, twenty-three with IS in the corona radiate (CR-IS) were singled out to contemplate the anatomy-specific effect of venous response. VD and OEF were compared between the homotopic ROIs for these subjects (paired t-test, p<0.05, FDR corrected) based on the Automatic Anatomical Labe atlas.
Results
Relative ratios and the correlation analysis were summarized in Figure 1. rOEF was significantly increased from early subacute stage (1.00±0.03) to late subacute stage (1.02±0.04) (p<0.05, Figure 1D). Both rOEF (r2=0.26 F=10.29, p<0.001) and rVD (r2=0.23, F=8.81, p<0.001) were closely correlated with the stroke age within 15 days after IS (Figure 1 B and C). Right CR-IS was associated with more distributed homotopic difference in OEF that mainly involve postcentral gyrus, anterior cingulum and the cerebellar vermis areas, as compared with left CR-IS (Figure 2). Homotopic VD difference was almost global for both left and right CR-IS (Figure 2).Discussion and Conclusions
Vein density and oxygen extraction fraction evolve with stroke age, indicating a process of venous response at the scale of the entire brain. Differential distribution of the homotopic differences in OEF and vein density in the left and right CR-IS suggests an anatomy-specific effect of the venous response after IS. Further investigation on the spatiotemporal features of venous response would further our knowledge towards innovating the management of ischemic stroke.Acknowledgements
This study was partially supported by GJHZ20180928120207356 and NSFC81627901.References
1. Al-Ali F, Elias JJ, Filipkowski DE, et al. Acute ischemic stroke treatment, part 1: patient selection “The 50% barrier and the capillary index score”. Front. Neurol. 2015;6:83
2. Meoded A, Poretti A, Benson JE, et al. Evaluation of the ischemic penumbra focusing on the venous drainage: the role of susceptibility weighted imaging (SWI) in pediatric ischemic cerebral stroke. J. Neuroradiol. 2014;41:108-116
3. Desilles J-P, Syvannarath V, Di Meglio L, et al. Downstream Microvascular Thrombosis in Cortical Venules Is an Early Response to Proximal Cerebral Arterial Occlusion. J. Am. Heart Assoc. 2018;7:e007804
4. Liu T, Liu J, De Rochefort L, et al. Morphology enabled dipole inversion (MEDI) from a single‐angle acquisition: comparison with COSMOS in human brain imaging. Magn. Reson. Med. 2011;66:777-783
5. Ward PG, Ferris NJ, Raniga P, et al. Combining images and anatomical knowledge to improve automated vein segmentation in MRI. Neuroimage. 2018;165:294-305
6. Yushkevich PA, Piven J, Hazlett HC, et al. User-guided 3D active contour segmentation of anatomical structures: significantly improved efficiency and reliability. Neuroimage. 2006;31:1116-1128
Figures