4173
Non-contrast enhanced spatially-selective and time-resolved vessel imaging by using cylinder-shaped pre-saturation pulse train in the Lung
Masahiro Takizawa1, Takashi Nishihara1, and Chikako Moriwake1
1Radiation Diagnostic System Division, FUJIFILM Healthcare Corporation, Kashiwa-shi, Japan
1Radiation Diagnostic System Division, FUJIFILM Healthcare Corporation, Kashiwa-shi, Japan
Synopsis
Cylinder-shaped pre-saturation pulse train is developed for non-contrast enhanced spatially-selective and time-resolved vessel imaging. The target vessel is selected by cylinder-shaped pre-saturation, and the dynamics of blood flow in the target vessel is observed by changing the number of applied pre-saturation pulses. The developed pulse train was demonstrated to visualize dynamics of a target pulmonary vessel in the lung.
Introduction
Pulmonary artery coil embolization (PACE) is often used to treat pulmonary arteriovenous malformations (PAVM). Before PACE, CT or contract enhanced (CE) time-resolved MRA is used to specify the target vessel. To label the blood flow, a few non-CE MRA method using IR or saturation pulse are developed. However, it is difficult to visualize the target vessel using conventional labelling pulses since the blood vessels have complex structure. We developed a cylinder-shaped pre-saturation (Cyl.-PSat) pulse for non-CE selective MRA[1]. In this study, a new pulse train based on the Cyl.-PSat pulses is developed to observe flow dynamics in the target vessel and tuned for lung imaging.Methods
<Pulse sequence diagram>Figure 1 shows the sequence diagram of the Cyl.-PSat pulse and the new pulse train. The Cyl.-PSat pulse is designed to work on 3D FSE sequence. To suppress residual vessel signals in the target area, a conventional saturation (Conv.-Sat) pulse, interval time between the Conv.-Sat pulse and main scan were introduced to the 3D FSE sequence. To observe flow dynamics in the target vessel, Cyl.-PSat pulse train was inserted between the Conv.-Sat pulse and the main scan, and the number of cylinders can be increased up to 48.
<Phantom experiment>
Experiment was conducted on a 3T whole body MRI system. A phantom with small constant flow was scanned to observe relationship between the flow distance and the Cyl.-PSat count. Before the experiment, actual flow velocity [cm/sec] was calculated by dividing flow rate (calculated from the time needs 1 liter of water to flow through the phantom) by the phantom area. The resultant actual flow velocity was 53cm/sec. Anticipated flow length was calculated by dividing the actual flow velocity by Cyl.-PSat period; obtained by multiplying the Cyl.-PSat count and the Cyl.-PSat duration. Drawing length of water on the image was measured and compared to the anticipated flow length.
<Volunteer study>
The study was approved by the ethics committee of FUJIFILM Healthcare Corporation. The Cyl.-PSat was set for the pulmonary artery for the volunteer as shown in fig.2. To visualize only inflow blood signal, the Conv.-Sat pulse was set on entire region of right lung. To set blood signal null in the target area at the point of excitation for main scan, FA of the Conv.-Sat pulse was set to 180 degrees and the interval time between the Conv.-Sat pulse and main scan was set to 800msec. And to achieve continuous suppression of inflow blood signal, the duration of Cyl.-PSat pulse was minimized (20msec). The sequence parameters were as follows; FOV 350mm, TR/TE 4000/41.4msec, thickness 3mm, matrix 224×176, and respiratory gating. The Cyl.-PSat count were set to 0 (no Cyl.-PSat), 10, 20, 30, and 40. Figure 3 shows the scheme of the post processing. The inflow blood signal was suppressed by Cyl.-PSat and the saturated distance of the target vessel becomes long according to increasing the Cyl.-PSat count. The blood signal of the target vessel is extracted by subtracted images acquired with and without Cyl.-PSat.
Results
<Phantom experiment>Figure 4 shows the result of phantom experiment. By increasing the Cyl.-PSat count, the water saturation length was increased, and the water gradually disappeared in the image. In the Cyl.-PSat count 10 case, the measured drawing length on the image was 11.6cm. The anticipated flow length was 10.6cm, and they were almost same and the difference is less than 10%.
<Volunteer study>
Blood flow signals in the target vessel were visualized using Cyl.-PSat pulses (Fig. 5). The length of the target vessel becomes longer as the Cyl.-PSat count becomes larger.
Discussion
The phantom study and a volunteer study clearly demonstrated that the proposed pulse train can visualize the flow dynamics of the spatially selected vessel. Furthermore, quantitative evaluation of the ratio between drawing length and the pulse count may indicate the velocity in the target vessel. In this study, we used respiratory gating to suppress motion artifact caused by breathing. The subtraction processing between w/ and w/o Cyl.-PSat was needed to visualize target vessel, thus motion artifact cases mis-registration of target vessel. Non-subtract vessel visualization will be realized by changing Cyl.-PSat pulse train position from the main scan side to the Conv.-Sat side. As for the vessel visualization, even the Cyl.-PSat count 40 case (continuous suppression during 800 msec) does not show vein. In the actual PAVM case, the blood flow in the target vein might be observed in the earlier phase than that in the normal vein. So it is expected that interval time less than 1000 msec might be useful.Conclusion
Cylinder shaped pre-saturation pulse train was developed to investigate flow dynamics of only a target blood vessel. It enabled changing the drawing length of the target vessel by changing the Cyl.-PSat count, which reflects the flow dynamics in the target vessel.Acknowledgements
No acknowledgement found.References
[1] T. Nishihara, et. al. Selective MRA for Portal Venography Using Beam Saturation Pulse, 22nd ISMRM (2014), p. 1501.Figures
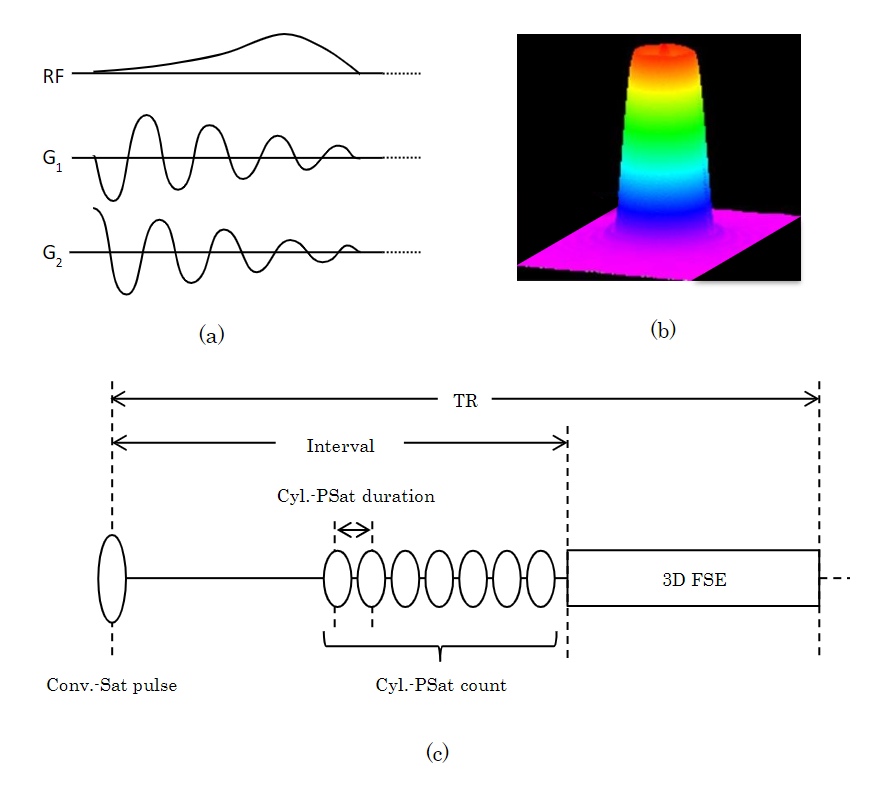
Figure 1 Pulse sequence
diagram of Cyl.-PSat pulse(a) and excitation profile of the pulse (b). Pulse
sequence diagram of 3D FSE with developed Cyl.-PSat pulse train (c).
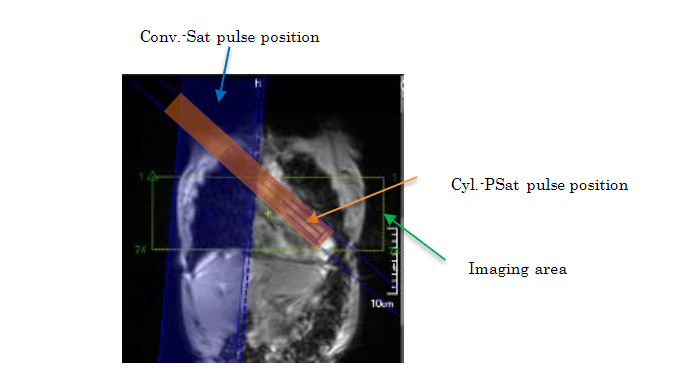
Figure 2. Each slice position of the new pulse
train in the case of right lung vessel imaging.
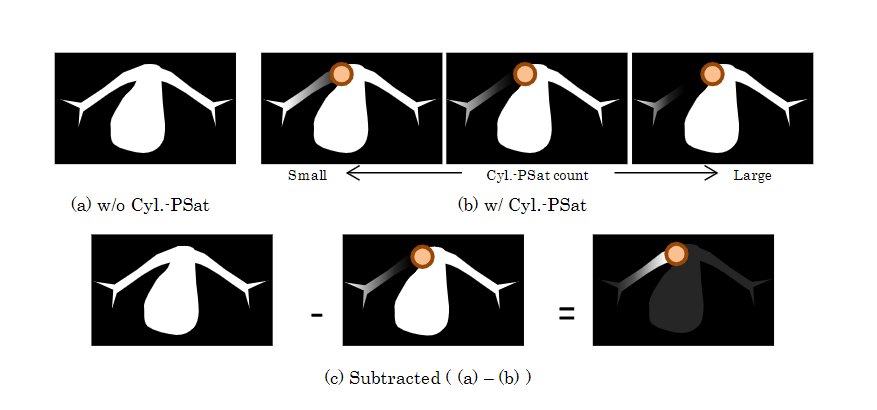
Figure 3. Correlation between the Cyl.-PSat count and the
length of artery in image.
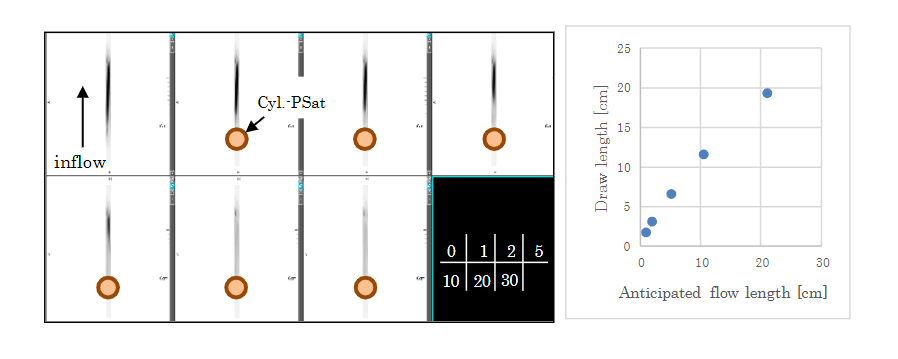
Figure 4. Suppressed inflow water signals according
to changing Cyl.-Psat count. (Gray scale reversed)
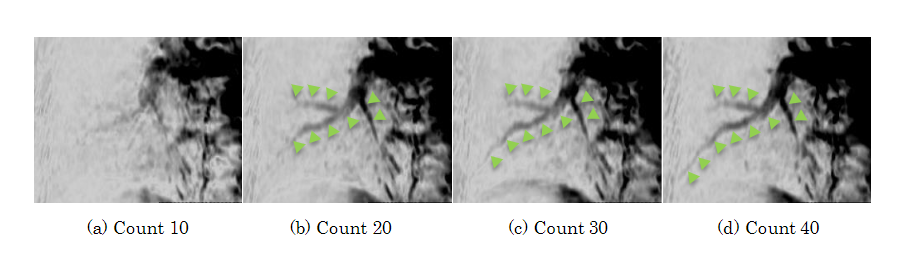
Figure 5. Subtracted
images of Cyl.-PSat count 10, 20, 30, and 40 cases. The pulmonary artery visualization length was changed
according to the Cyl.PSat counts. (Gray scale reversed)
DOI: https://doi.org/10.58530/2022/4173