4171
Comparison analysis of imaging techniques about routine, different acceleration factor coefficients of compressed sensing and PETRA TOF-MRA1Affiliated Hospital of Inner Mongolia Medical University, Hohhot, China, 2MR Scientific Marketing, Siemens Healthineers, Shanghai, China
Synopsis
We compare three MRA techniques between CS-TOF, PI-TOF and PETRA-TOF about imaging quality and speed, and also compared the effects of different acceleration factor coefficients (4.6×, 7.2×, 10.3×) on CS-TOF-MRA images on a 3T MR scanner.
Purpose
Time-of-flight (TOF)-MR angiography (MRA) is an important imaging sequence for the surveillance and analysis of cerebral artery[1-5]. However, this technique has the disadvantage of a relatively long scan time and also limited by flow related dephasing artifacts that could lead to substantial signal losses within vessels in the presence of turbulent or complex blood flow[6]. The aim of this study was to compare three MRA techniques between compressed sensing (CS)-TOF and conventional parallel imaging (PI)-TOF and pointwise encoding time reduction with radial acquisition in subtraction-based (PETRA)-TOF about imaging quality and speed, and also to compare the effects of different acceleration factor coefficients on CS-TOF-MRA images.Method
A total of 24 subjects (13 males and 11 females, aged 30-73 years, with an average age of 52.6±12.7 years) were enrolled in this study. We performed all MRA examinations using a 3-T MR imaging system (MAGNETOM Skyra, Siemens Healthineers, Erlangen, Germany) with a 32-channel head coil. Imaging parameters for PI-TOF-MRA were as follows: TR/TE, 28/4.81 ms; matrix size, 320 × 320; slice thickness, 0.8 mm; phase partial Fourier factor, 7/8; number of slabs, 4; acceleration factor, generalized auto calibrating partially parallel acquisition (GRAPPA) 3×. Imaging parameters for the prototype CS-TOF-MRA were as follows: TR/TE = 21/3.49 ms; matrix size, 320 ×320; slice thickness, 0.8 mm; acceleration factor, 4.6×, 7.2×, 10.3×. For PETRA-TOF-MRA, in the same section orientation, Imaging parameters were as follows: TR/TE, 3.32/0.07 ms; matrix size, 320 × 320; slice thickness, 0.8 mm; radial view number 45000. PETRA-MRA was subtracted from two imaging datasets with and without a slice-selective saturation slab in the bottom of the imaging volume. Image analysis includes subjective evaluation and objective evaluation. For subjective evaluation, Two radiologists with more than 10 years of experience analysised the images independently and blindly. The image quality was evaluated by two-level scoring criteria. For objective evaluation, the M1 segment of middle cerebral artery was selected to show the best layer, and the apparent signal-to-noise ratio (SNR) and contrast-to-noise ratio (CNR) of M1 segment were measured.Result
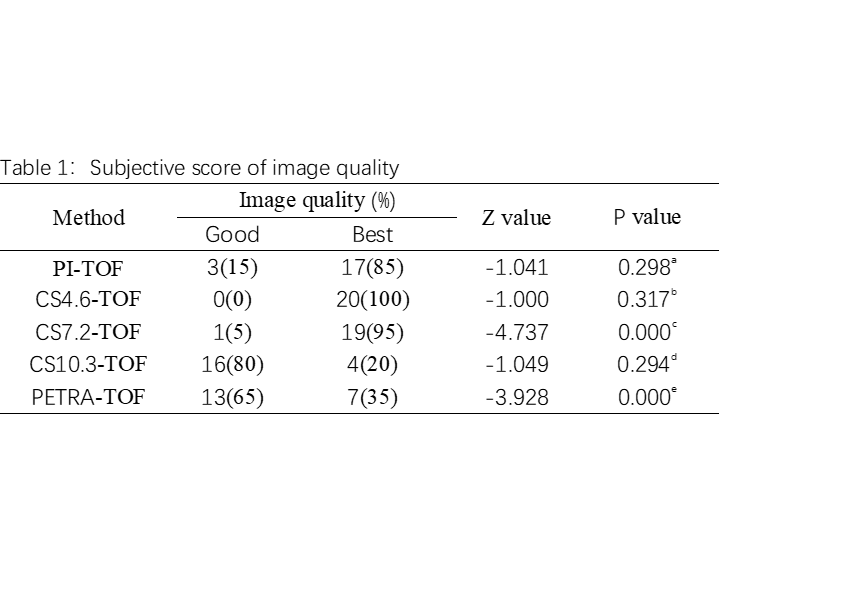
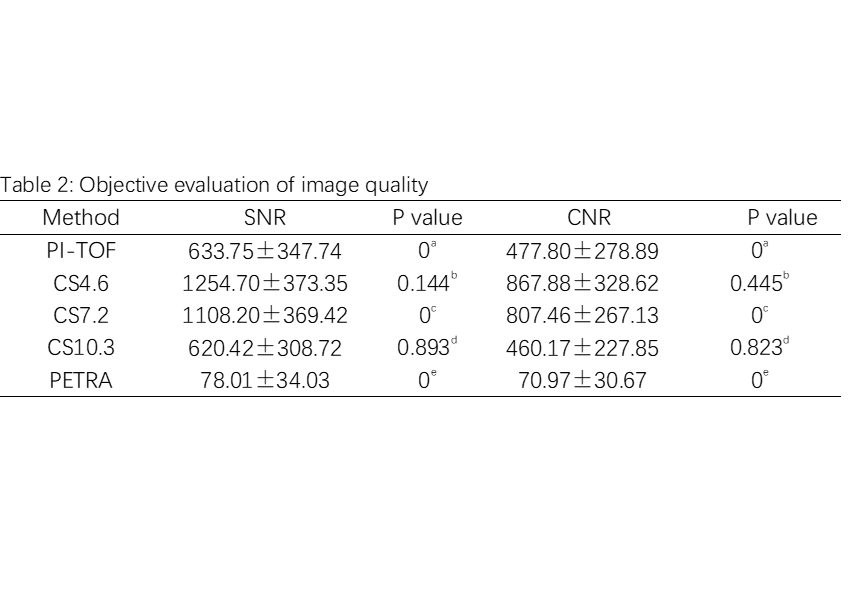
The scanning times of PI-TOF, CS4.6-TOF, CS7.2-TOF, CS10.3-TOF and PETRA-TOF were 10min 38S, 5min 38S, 3min 41s, 2min 42s and 7min 07s respectively. In subjective evaluation(Table 1), the diagnostic quality of cs4.6 and cs7.2 images was not significantly different from that of PI-TOF, which was better than that of cs10.3-TOF and PETRA-TOF. PI-TOF-MRA had better display ability in branch vessels, but Petra-MRA had more uniform signal in the siphon of internal carotid artery. In the objective evaluation(Table 2), the SNR and CNR of CS4.6-MRA and CS7.2-MRA in the middle cerebral artery segment were higher, and there was no significant difference between them.Conclusion
We compared the same voxel (0.8m ³ isotropic) MRA images about PI-TOF, CS-TOF and PETRA-TOF in this study. Combined with subjective and objective evaluations, the CS7.2-TOF-MRA sequence not only had higher image quality, SNR and CNR, but also can shorted the scanning time, which can be used as a routine clinical examination about MRA.Acknowledgements
Thanks for the technical support provided by MR scientific Marketing, Siemens Healthineers , China.References
- Attali J, Benaissa A, Soize S, Kadziolka K, Portefaix C, Pierot L. Follow-up of intracranial aneurysms treated by flow diverter: comparison of three-dimensional time-of-flight MR angiography (3D-TOF-MRA) and contrast-enhanced MR angiography (CE-MRA) sequences with digital subtraction angiography as the gold standard. J Neurointerv Surg. 2016;8(1):81-86. doi:10.1136/neurintsurg-2014-011449
- Lanzman RS, Kröpil P, Schmitt P, et al. Nonenhanced ECG-gated time-resolved 4D steady-state free precession (SSFP) MR angiography (MRA) of cerebral arteries: comparison at 1.5T and 3T. Eur J Radiol. 2012;81(4):e531-e535.
- Raoult H, Bannier E, Robert B, Barillot C, Schmitt P, Gauvrit JY. Time-resolved spin-labeled MR angiography for the depiction of cerebral arteriovenous malformations: a comparison of techniques. Radiology. 2014;271(2):524-533.
- Wu H, Block WF, Turski PA, Mistretta CA, Johnson KM. Noncontrast-enhanced three-dimensional (3D) intracranial MR angiography using pseudocontinuous arterial spin labeling and accelerated 3D radial acquisition. Magn Reson Med. 2013;69(3):708-715.
- HaiFeng L, YongSheng X, YangQin X, et al. Diagnostic value of 3D time-of-flight magnetic resonance angiography for detecting intracranial aneurysm: a meta-analysis. Neuroradiology. 2017;59(11):1083-1092. doi:10.1007/s00234-017-1905-0
- Wheaton AJ, Miyazaki M. Non-contrast enhanced MR angiography: physical principles. J Magn Reson Imaging. 2012;36(2):286-304. doi:10.1002/jmri.23641
Figures
Annotation: a is the comparison between conventional PI-TOF and CS7.2-TOF, b is the comparison between CS4.6 and CS7.2-TOF, c is the comparison between CS10.3 and CS7.2-TOF, d is the comparison between CS10.3 and Petra-TOF, and e is the comparison between PETRA-TOF and Cs7.2-TOF.
Annotation: a is the comparison between conventional PI-TOF and CS7.2-TOF, b is the comparison between CS4.6 and CS7.2-TOF, c is the comparison between CS10.3 and CS7.2-TOF, d is the comparison between CS10.3 and PI-TOF, and e is the comparison between PETRA-TOF and PI-TOF.
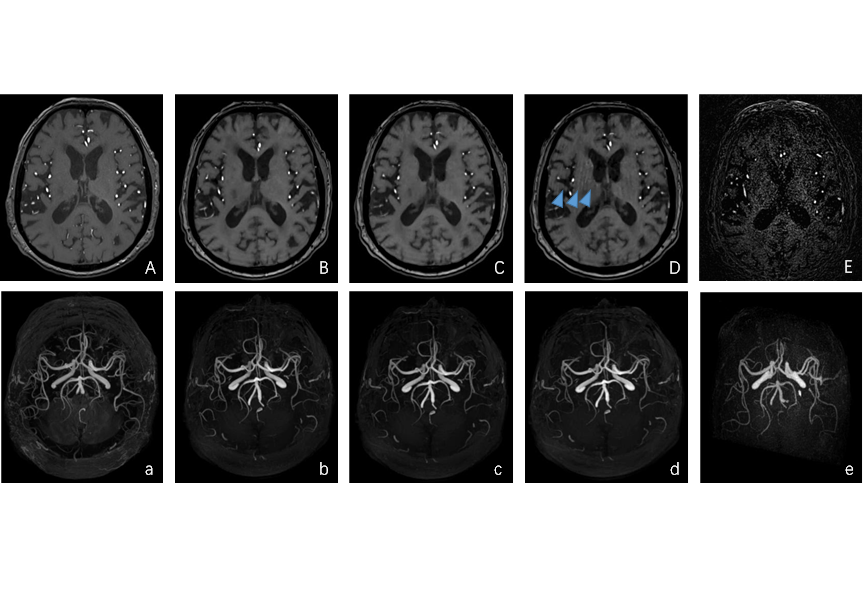
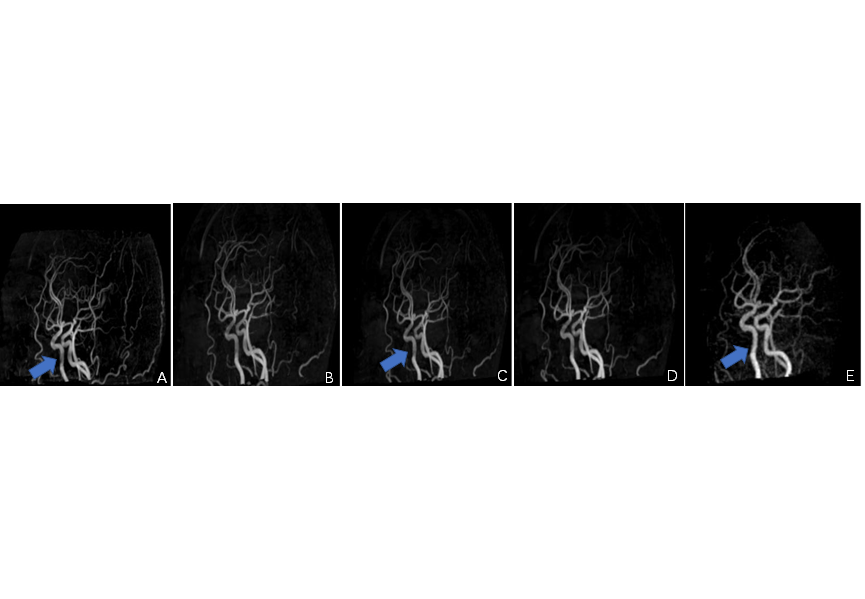
Fig 2. Oblique sagittal views of MIP imaging. A PI, B CS-4.6, C CS-7.2, D CS-10.3, E Petra. Petra-MRA had more uniform signal in the siphon of internal carotid artery.