4169
Small-patch CNN and random forest to model and quantify the lenticulostriate artery from 7T time-of-flight MR angiography1State Key Laboratory of Brain and Cognitive Science, Institute of Biophysics, Chinese Academy of Sciences, Beijing, China, Beijing, China, 2University of Chinese Academy of Sciences, Beijing, China, Beijing, China, 3The Innovation Center of Excellence on Brain Science, Chinese Academy of Sciences, Beijing, China, Beijing, China, 4Department of Neurology, Peking University First Hospital, Beijing, 100034, China, Beijing, China, 5Beijing Key Laboratory of Neurovascular Disease Discovery, Peking University First Hospital, Beijing, 100034, China, Beijing, China, 6Siemens Shenzhen Magnetic Resonance Ltd., Shenzhen, China, Shenzhen, China
Synopsis
Time-of-flight MR angiography at 7T allowed noninvasive visualization of the lenticulostriate artery (LSA). However, vasculature modeling of LSA remained challenging due to limited signal-to-noise ratio and pulsation artifact. In this study, we introduced an automated vascular segmentation and tracing method based on small-patch convolutional neural network (CNN), random forest, and multiple filtering. This method outperformed existing U-NET based methods and found radius changes of LSA branches in patients with cerebral small vessel diseases (cSVD). The automated quantification of LSA vasculatures will potentially facilitate diagnosis and clinical studies of cSVD.
Introduction
Time-of-flight MR angiography (TOF-MRA) at 7T allows noninvasive visualization of the lenticulostriate artery (LSA), which is closely related to cerebral small vessel disease (cSVD)1. However, vasculature modeling of LSA remains challenging due to limited signal-to-noise ratio and pulsation artifact in TOF-MRA images2,3. Deep learning could be an effective alternative to conventional approaches for cerebrovascular segmentation, but performs poorly in segmentation of smaller, yet critical vessels4,5. To solve this problem, we presented a composite framework based on small-patch CNN, random forest, and multiple filtering. The algorithms improved the accuracy of segmentation and generated 3D models and quantitative vasculature features of LSA.Methods
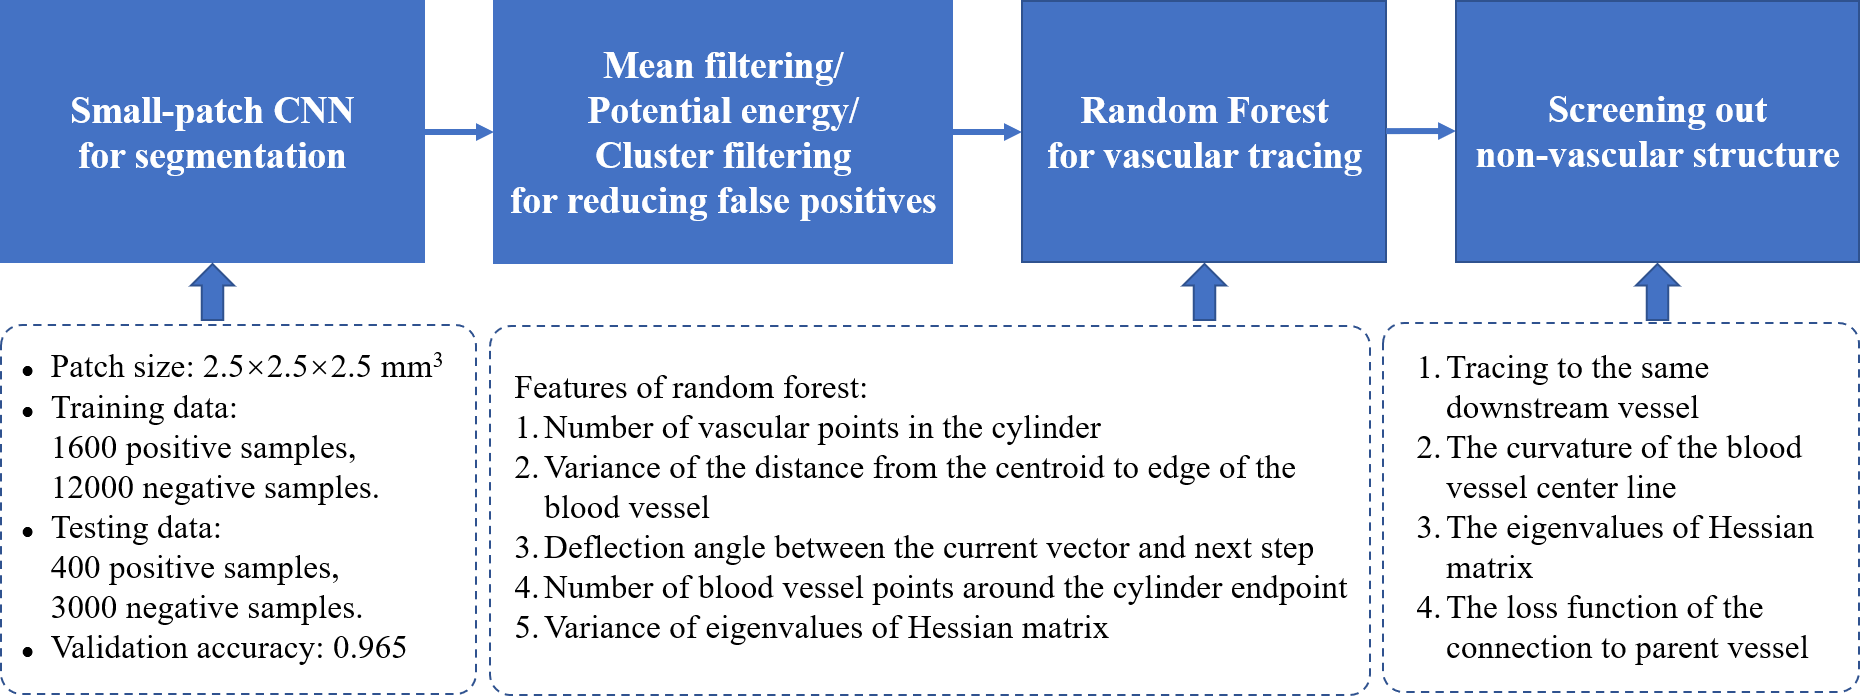
Schematic diagram of the algorithm is shown in Figure 1. Data from six subjects were used for training the CNN model and Random Forest. Images were acquired from a 7T research MRI system (Siemens Healthcare, Erlangen, Germany). The protocol of TOF-MRA was: resolution = 0.23×0.23×0.34 mm3, matrix = 576×768×144, TR = 15ms, TE = 3.57ms, FA = 20°.Data preprocessing steps included cropping the LSA region, skull stripping, and N4 bias field correction. In segmentation, large arteries (e.g., middle cerebral arteries, MCAs) were segmented by intensity thresholding, while small vessels (e.g., LSAs) were segmented by CNN. The proposed CNN model aimed to discern information on small vessels by using small patch size 2.5 × 2.5 × 2.5 mm3. In the training stage, 1600 positive patches and 12000 negative patches were distributed to the training and testing sets in a ratio of 8 to 2 to improve the vessel segmentation robustness and accuracy rate, which was 94%. The potential energy function was used to clarify the connectivity of small vessels where flow signal may be interrupted due to vascular pathologies. Mean and cluster filters were used to remove scattered false positive voxels and smooth vessel edges.
In each step of the tracing stage, potential endpoints of the vascular cylinder were defined as centroids of vascular cross sections on the normal plane of the tracing vector. The vascular cylinders were then determined by the random forest method, which had the following features: 1) number of blood vessel points in the cylinder, 2) variance of the distance from the centroid to edge of the blood vessel, 3) deflection angle between the current vector and next step, 4) number of blood vessel points around the cylinder endpoint, and 5) variance of eigenvalues of Hessian matrix.
According to features of random forest, our method allowed tracing over the interruption of blood flow in a short range, which was most often caused by pulsation artifacts. When tracking was complete, centerlines of cerebral small vessels were smoothed by Bezier spline.
Branching points were determined from vascular cross-sections on a spherical surface and the radius which was derived from the radius of the cylinder at the current position. Bifurcation points were added to candidate points to be screened.
Results
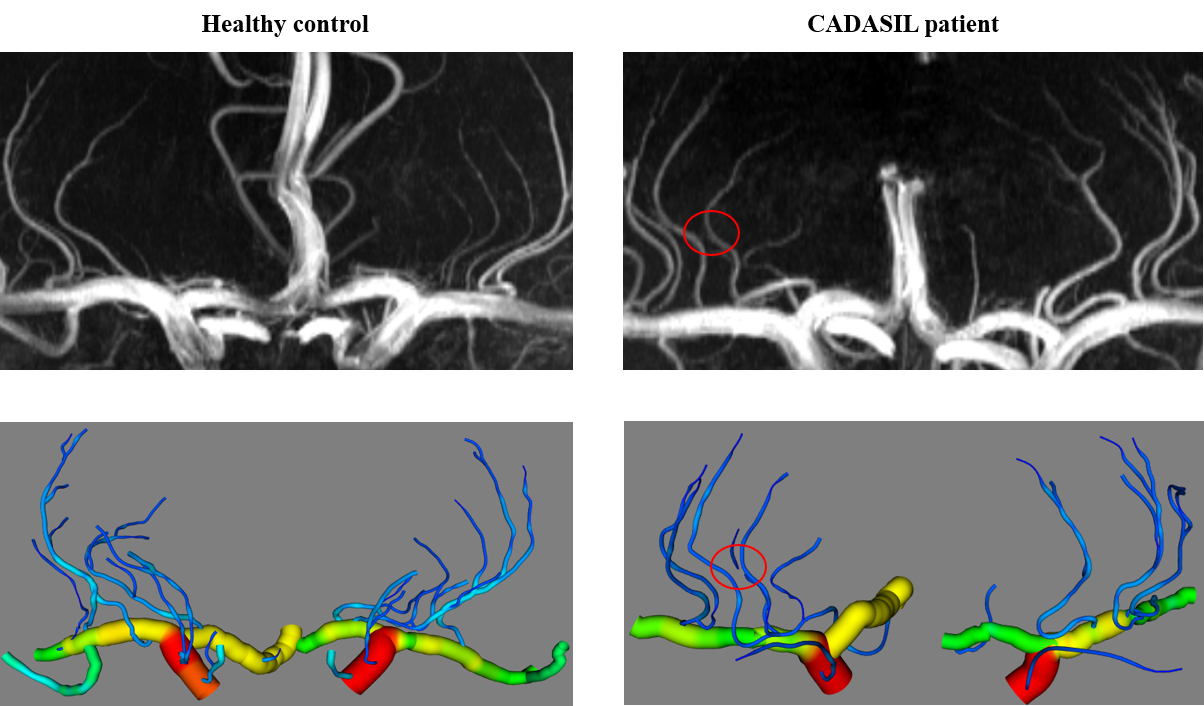
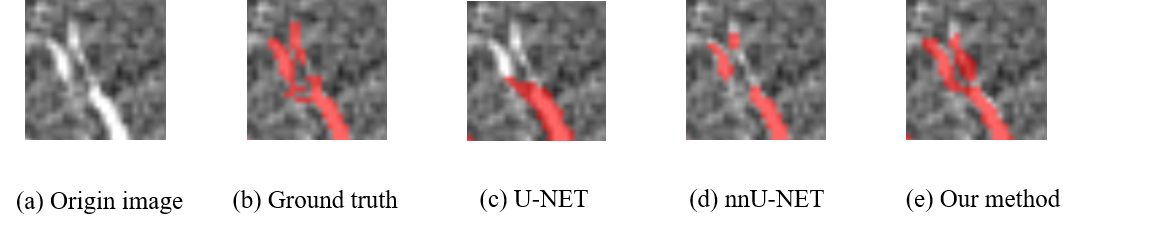
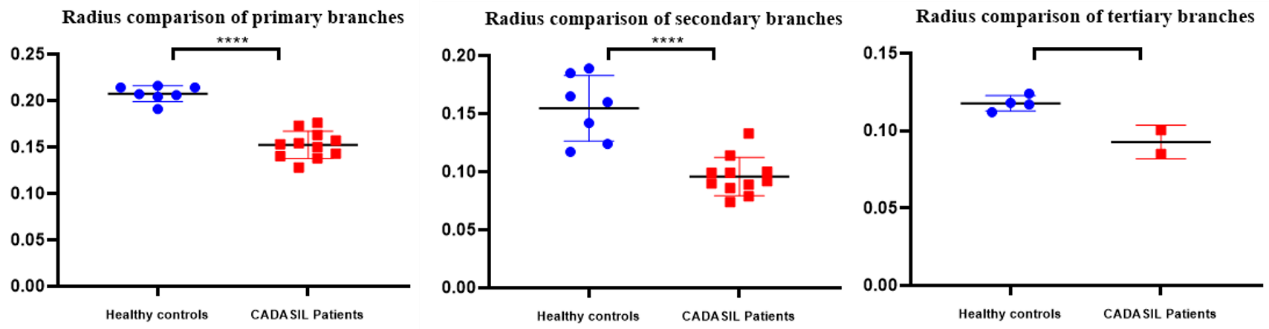
The 3D vascular models of a healthy control and patient with hereditary cerebral small vessel disease (CADASIL) are represented in Figure 2, in comparison with their maximal intensity projections. Compared with U-Net and nnU-Net, higher dice similarity coefficient (DSC) and lower Hausdorff distance were obtained by our method, as listed in Table 1. In vascular areas with small calibers and bifurcations, Figure 3 shows that our small-patch CNN outperformed U-Net and nnU-Net.After vascular modeling, structural features from 7 healthy controls and 11 CADASIL patients were obtained. Despite of the limited sample size, significantly smaller radiuses were found on primary and secondary branches of LSA in CADASIL patients. Statistics was shown in Figure 4.
Discussion
In this study, we proposed an automated segmentation and tracing method to model cerebral small vessels in TOF-MRA images, using small-patch CNN and random forest. In combination with the potential energy algorithm and filters, small-patch CNN pushes segmentation results closer to the ground truth. By considering the vascular features of cerebral small vessels in random forest method, complex structures of LSA are well reconstructed. This method has demonstrated its power at revealing structural changes of LSA in patients with CADASIL. Without need for manual analysis, automatic quantification of LSA vasculatures will greatly facilitate the trial study of cSVD.Technical improvements are still needed to make the framework more robust, especially in modeling the proximal part of LSA, which was sensitive to interference caused by pulsating artifacts of MCA.
Conclusions
We present an automated method to model LSAs from 7T TOF-MRA images. By using small-patch CNN and random forest, this method outperformed previous methods and identified abnormal radiuses of LSA branches in patients with cSVD.Acknowledgements
This work was supported by the National Natural Science Foundation of China (82001804, 81961128030), the Natural Science Foundation of Beijing Municipality (7191003), the Capital’s Funds for Health Improvement and Research (CFH2020-2-5115), and the Strategic Priority Research Program of Chinese Academy of Science (XDB32010300).References
1. Ling, C. et al. Lenticulostriate Arteries and Basal Ganglia Changes in Cerebral Autosomal Dominant Arteriopathy With Subcortical Infarcts and Leukoencephalopathy, a High-Field MRI Study. Front. Neurol. 10, 870 (2019).
2. W. Liao, M. Dalla Mura, J. Chanussot, et al. Fusion of Spectral and Spatial Information for Classification of Hyperspectral Remote-Sensed Imagery by Local Graph. IEEE. 2016 Feb. 9(2):583-594.
3. Kirbas, Cemil and Quek, et al. A Review of Vessel Extraction Techniques and Algorithms. Association for Computing Machinery.2004 June;36(2):0360-0300.
4. Tatsat R. Patel, Nikhil Paliwal, Prakhar Jaiswal, et al. Multi-resolution CNN for brain vessel segmentation from cerebrovascular images of intracranial aneurysm: a comparison of U-Net and DeepMedic. SPIE. 2020 March; 11314.
5. Livne, M., Rieger, J., Aydin, O. U., et al. A U-Net Deep Learning Framework for High Performance Vessel Segmentation in Patients With Cerebrovascular Disease. Front. Neurosci. 2019 February; 13(97).
Figures