4167
Early MR radiomic biomarkers for re-hemorrhage after Gamma Knife Radiosurgery in Cavernous Malformation
Pei-Hsuan Kuo1, Cheng-Chia Lee2,3,4, Huai-Che Yang2,3, Hsiu-Mei Wu3,5, and Chia-Feng Lu1
1Department of Biomedical Imaging and Radiological Sciences, National Yang Ming Chiao Tung University, Taipei, Taiwan, 2Department of Neurosurgery, Neurological Institute, Taipei Veteran General Hospital, Taipei, Taiwan, 3School of Medicine, National Yang Ming Chiao Tung University, Taipei, Taiwan, 4Brain Research Center, National Yang Ming Chiao Tung University, Taipei, Taiwan, 5Department of Radiology, Taipei Veteran General Hospital, Taipei, Taiwan
1Department of Biomedical Imaging and Radiological Sciences, National Yang Ming Chiao Tung University, Taipei, Taiwan, 2Department of Neurosurgery, Neurological Institute, Taipei Veteran General Hospital, Taipei, Taiwan, 3School of Medicine, National Yang Ming Chiao Tung University, Taipei, Taiwan, 4Brain Research Center, National Yang Ming Chiao Tung University, Taipei, Taiwan, 5Department of Radiology, Taipei Veteran General Hospital, Taipei, Taiwan
Synopsis
Cavernous malformation (CM) is one of the common cerebral vascular diseases. Hemorrhage is a common and dangerous symptom of CMs, and re-hemorrhage may still occur in 30% of patients after the treatment of Gamma Knife radiosurgery (GKRS). Till now, the prediction of occurrences of future re-hemorrhage in CMs are still less explored. In this study, we used statistical analyses to observe longitudinal changes in MRI radiomic features before re-hemorrhage after GKRS. We aimed to identify the reliable image biomarkers using the quantitative and non-invasive MRI technique as early predictors to guide the clinical management for CM patients.
Background and Purpose
Cavernous malformation (CM) in brain is one of the common neurovascular diseases. Most people with CM may experience serious signs and symptoms such as hemisensory deficits, cranial nerve deficits, hemiparesis, headaches, seizures, dizziness, and cerebral hemorrhage 1, 2. Gamma Knife radiosurgery (GKRS) is a viable alternative treatment option for patients with surgically-inaccessible CMs or significant medical comorbidities. The primary therapeutic goal of GKRS is to prevent re-hemorrhage of the lesion. However, about 30% of patients still experience re-hemorrhage after GKRS 3. We aimed to identify early image biomarkers associated with future re-hemorrhage events after GKRS based on MRI radiomics. This study reported the longitudinal changes of MRI radiomic features in CM to observe the subtle changes of lesions during follow-ups to guide the patient management and follow-up monitoring.Materials and Methods
We conducted a retrospective study of 162 CM patients treated by GKRS with overall 422 longitudinal imaging follow-ups within 4 years after GKRS, including 72 CMs with re-hemorrhage after GKRS (the hemorrhagic group) and the other 127 CMs without re-hemorrhage after treatment (the non-hemorrhagic group). Serial magnetic resonance images (MRI), including full series of T2-weighted images (T2W) and contrast-enhanced T1-weighted (CET1), were collected for each patient before GKRS and yearly follow-up thereafter from Taipei Veteran General Hospital between 1993 and 2020. The study was approved by the local Institutional Review Board.Several postprocessing steps on the MRI were applied to reduce the discrepancy of imaging parameters using our previously published MRI radiomics platform (MRP, http://www.ym.edu.tw/~cflu/MRP_MLinglioma.html) with a graphic user interface built on MATLAB programming environment 4. The adjustment of image resolution will be first performed to resample all voxel size to isotropic spatial resolution (1.00 x 1.00 x 1.00 mm3) for each MRI contrast according to Image biomarker standardisation initiative (IBSI) 5. The CM lesions were manually delineated at each time point followed by the extraction of 1178 radiomic features (including the gray-scale intensity patterns, lesion shape/size geometry, and texture features).
Subjects were divided into two subsets based on the re-hemorrhage time points. The first subset included bleeding in the first year after GKRS, and the second subset included bleeding between the second and fourth years after GKRS. For the first subset, we collected complete information of hemorrhage time point (HT) and one year before hemorrhage (BH1). For the second subset, we collected complete information of HT, BH1, and two years before hemorrhage (BH2). In order to reveal the time effects and group effects, both subsets were tested by the paired t-test (time effects) and two-sample t-test (group effects) separately. We first applied a paired t-test to identify the radiomic features with significant changes before re-hemorrhage events (p<0.05). A two-sample t-test was then used to determine the difference of radiomic features between hemorrhagic and non-hemorrhagic groups for selecting radiomic features as early biomarkers (p<0.05). The processing workflow is shown in Figure 1.
Results and Discussion
Table 1 lists the clinical characteristics of 162 enrolled patients with 199 CM lesions. Results of statistical analysis showed that no significant difference (p>0.05) in age, gender, size of CCM, clinical symptoms, average max dose, and average isodose level between the re-hemorrhage and hemorrhage-free group. Few clinical characteristics, including the lesion location and the average margin dose of GKRS, showed significant differences (p<0.05) between the two groups.For the re-hemorrhage at the first year after GKRS (the first subset), we identified six MRI radiomics features with significant differences (p<0.05 in Table 2). For the re-hemorrhage among the second to fourth year after GKRS (the second subset), we identified twenty MRI radiomics features with significant differences (p<0.05 in Table 2).
We further used these radiomic features to forecast the re-hemorrhage of CM before the bleeding occurrence. We found all of the selected radiomic features were texture features. Therefore, the conventional visual inspection without quantitative analysis based on radiomics would be difficult to find changes in lesion inhomogeneity. The changed score of the re-hemorrhagic group had a wide margin than the hemorrhagic-free group. This phenomenon indicated that the re-hemorrhagic lesions were relatively unstable.
For the first subset, the significant differences in raw BH1 scores between the two groups could warn us about future re-hemorrhage (Figure 2). For the second subset, most of the significant features showed a progressively increase or decrease during the two years before bleeding, only a few features showed an increase (p<0.05) followed by a slight decrease (Figure 3). Although the decreases were not statistically significant (p>0.05), the changes between BH2 and HT were increasing (p<0.05). However, the slight decrease in these features is still a cause for attention, and we expect that the dynamic changes of CM before re-hemorrhage would be further investigated in future studies. The significant differences in the changed scores among BH1 and BH2 could warn us about the bleeding that might occur in the future, once the scores increase or decrease beyond the normal ranges.
Conclusions
This study investigated the longitudinal changes of MRI radiomics features in patients with CM after receiving GKRS treatment. The observation of longitudinal changes of MRI radiomic features before re-hemorrhage could be helpful to identify early changes before bleeding and be beneficial to monitor the re-hemorrhages after GKRS.Acknowledgements
This study was supported by Ministry of Science and Technology of Taiwan (109-2314-B-010-022-MY3), Taipei Veterans General Hospital, National Yang Ming Chiao Tung University, and University System of Taiwan (VGHUST110-G7-2-2).References
- Dalyai, R.T., et al., Management of incidental cavernous malformations: a review. Neurosurg Focus, 2011. 31(6): p. E5.
- Kondziolka, D., L.D. Lunsford, and J.R. Kestle, The natural history of cerebral cavernous malformations. J Neurosurg, 1995. 83(5): p. 820-4.
- Lee, C.C., et al., Gamma Knife radiosurgery for cerebral cavernous malformation. Sci Rep, 2019. 9(1): p. 19743.
- Lu, C.F., et al., Machine Learning-Based Radiomics for Molecular Subtyping of Gliomas. Clin Cancer Res, 2018. 24(18): p. 4429-4436.
- Zwanenburg, A., et al., The Image Biomarker Standardization Initiative: Standardized Quantitative Radiomics for High-Throughput Image-based Phenotyping. Radiology, 2020. 295(2): p. 328-338.
Figures

Table 1. Clinical
characteristics of 162 patients with 199 CMs treated with GKRS.
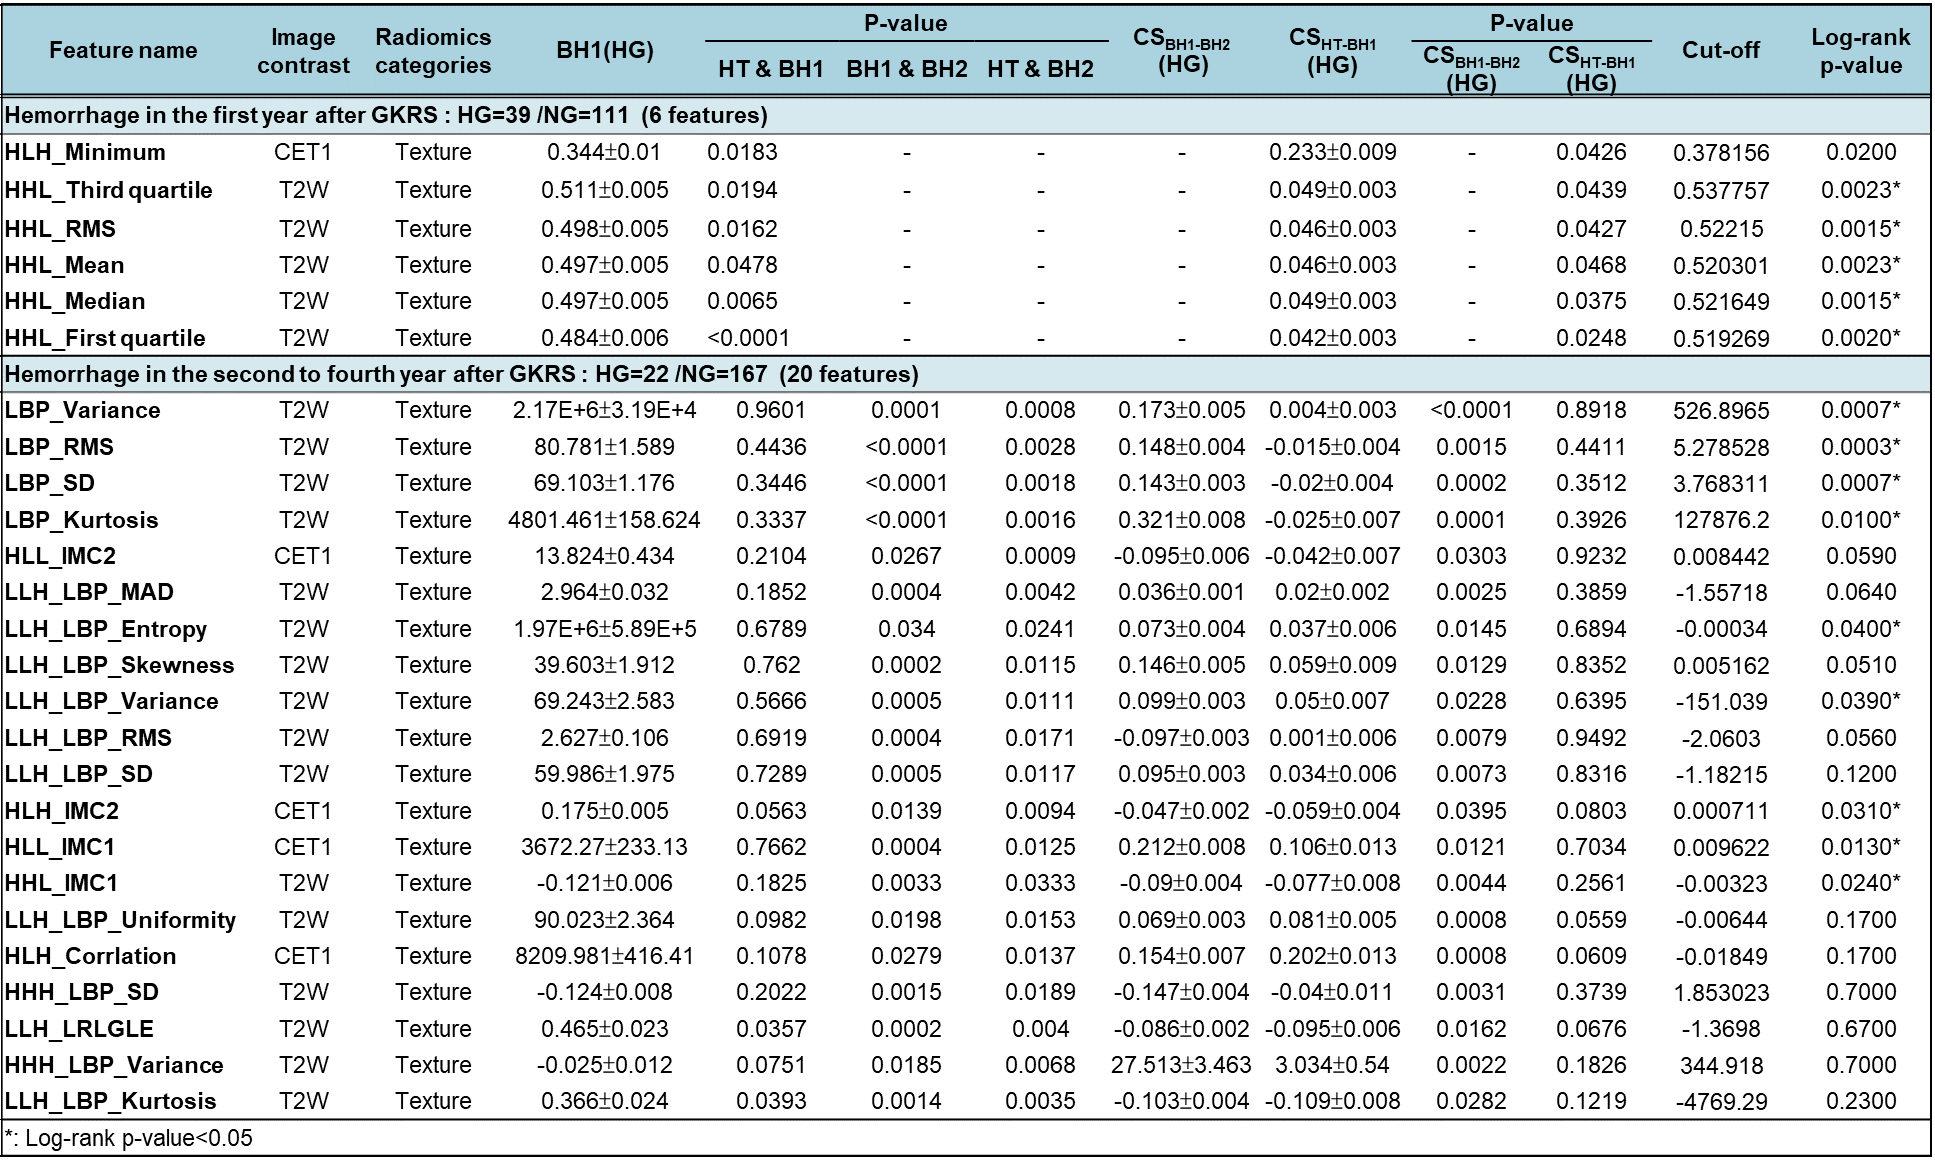
Table 2. Significant radiomic features between re-hemorrhagic (HG) and hemorrhagic-free (NG) groups. RMS: Root mean square; SD: Standard deviation; MAD: Mean absolute deviation; IMC1: Informational measure of correlation 1; IMC2: Informational measure of correlation 2; LRLGLE: Long Run Low Gray-Level Emphasis.

Figure 1. Three-stage statistical process to identify
the re-hemorrhage radiomic predictors. For the first subset, the three-stage
process combines one set of paired t-test and two sets of two-sample t-tests. For
the second subset, the three-stage process combines two sets of paired t-tests
and one set of two-sample t-test. HT: Hemorrhage time point; CS: Changed score;
BH1: One year before hemorrhage; BH2: Two years before hemorrhage.
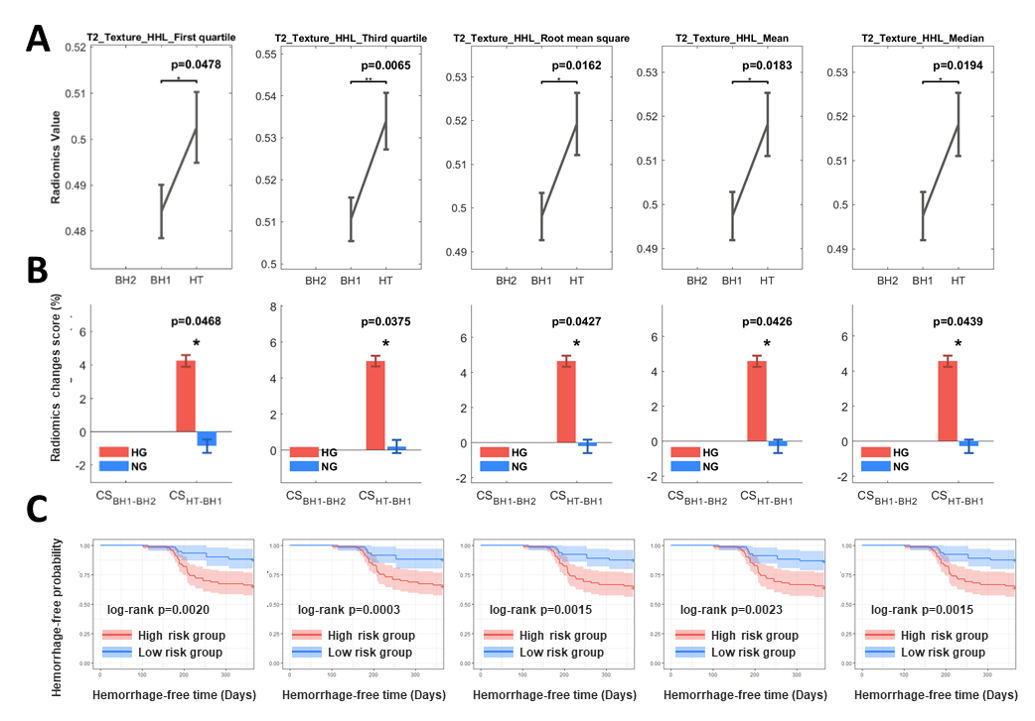
Figure 2. Representative radiomic
features between re-hemorrhage (HG) and hemorrhage-free (NG) groups for
one-year follow-up after GKRS. Representative selected radiomic features presented the
dynamic changes of MR radiomics values (A),
radiomics changes score (B) and
hemorrhage-free probability (C) between
re-hemorrhage (HG) and hemorrhage-free (NG) groups for one-year follow-up after
GKRS.

Figure 3. Representative radiomic
features between re-hemorrhage (HG) and hemorrhage-free (NG) groups for the
second to forth follow-ups after GKRS. Representative selected radiomic
features presented the dynamic changes of MR radiomics values (A), radiomics changes score (B) and hemorrhage-free probability (C) between re-hemorrhage (HG) and
hemorrhage-free (NG) groups for the second to forth follow-ups after GKRS.
DOI: https://doi.org/10.58530/2022/4167