4162
The feasibility of evaluating acute ST-segment elevation myocardial infarction by using diffusion weighted imaging and T2* mapping1Department of Cardiology, the Second Affiliated Hospital of Harbin Medical University, Harbin, China, 2Philips Healthcare, Beijing, China
Synopsis
Acute myocardial infarction is the result of occlusion of cardiac arteries, which leads to myocardial ischemic injury and even necrosis. Diffusion weighted imaging (DWI) and T2* mapping were performed to investigate the correlation between apparent diffusion coefficient (ADC) and T2* values in ST-segment elevation myocardial infarction (STEMI) patients here. ADC values of infarct regions were higher than those in border regions, remote regions in patients with STEMI, and also higher when compared with control group. Conversely, T2* values showed opposite trend. What’s more, there was a negative correlation between T2* and ADC values (r = 0.-734; P < .001).
Introduction
The traditional assessment of acute myocardial infarction is limited because of its invasiveness, radiation and inablility to further quantitatively evaluate patients’ condition [1, 2]. Functional magnetic resonance imaging (fMRI) has the advantages of non-radiation and non-invasive, which can provide not only qualitative but also quantitative parameters. The use of diffusion weighted imaging (DWI) technology to measure apparent diffusion coefficient (ADC) as an early marker of tissue injury has been widely studied in stroke and intracranial lesion [3]. DWI is sensitive to random motion of water molecules, which can be used to characterize tissue microarchitecture. What’s more, ADC is proved to be more sensitive to probe myocardial injury in acute phase of ST-segment elevation myocardial infarction (STEMI) [4]. T2* is sensitive to the magnetic field changes associated with byproducts of hemoglobin degradation [5]. Therefore, T2* relaxation time is widely used to evaluate myocardial iron content and intramyocardial hemorrhage (IMH) [6]. However, there are few studies to explore the relationship between ADC and T2* values in patients with myocardial infarction. The aim of this study was to investigate the correlation between ADC and T2* values in patients with STEMI.Methods
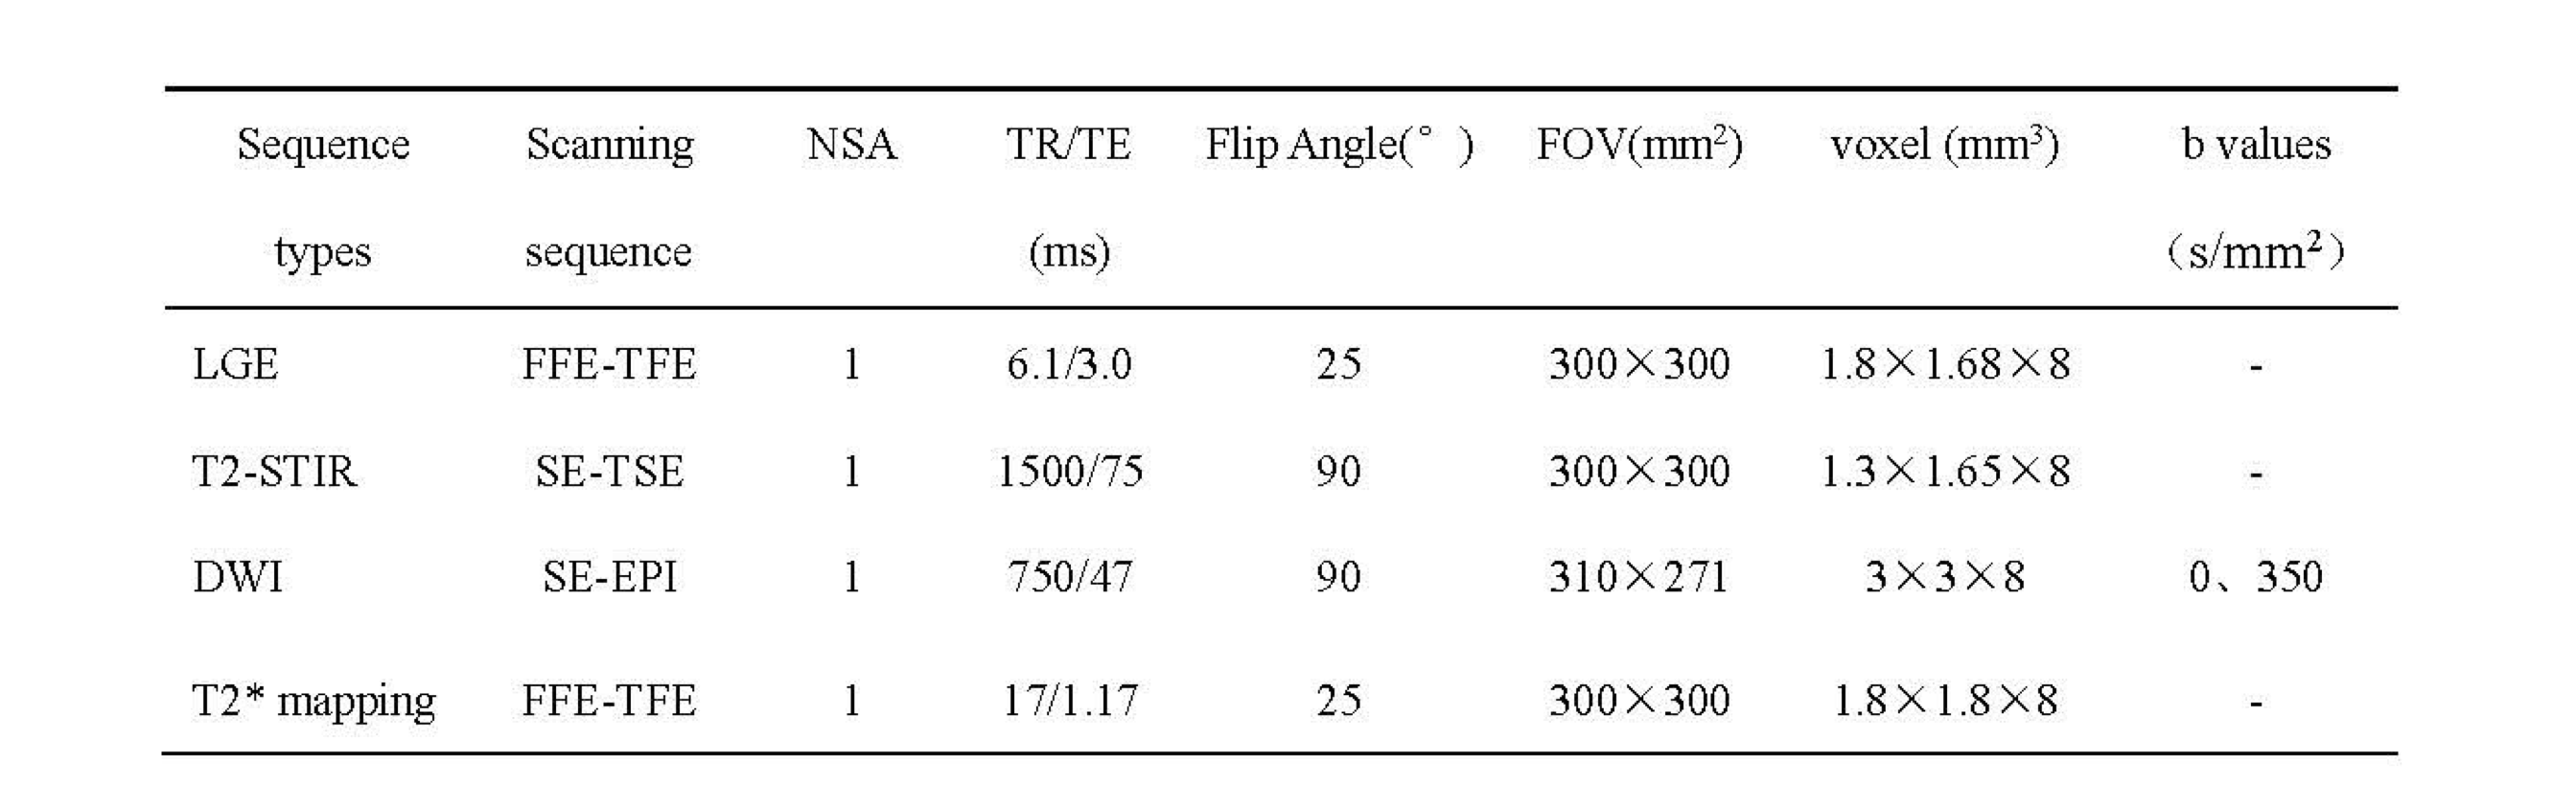
Patients with first STEMI undergoing primary percutaneous coronary intervention (PPCI) within 12h after onset of symptoms were prospectively enrolled from May 2021 to September 2021, CMR was carried out within 5 days after PPCI. Healthy volunteers with similar sex and age distribution who were free of any history of medical conditions were also recruited. CMR sequences were performed by using a 3.0T system (Ingenia CX, Philips Healthcare, the Netherlands) with 32-channel abdomen coil. The scanning protocols included late gadolinium enhancement (LGE), T2-weighted short-tau inversion recovery (T2-STIR), DWI and T2* mapping. A spin-echo echo-planar (SE-EPI) sequence was performed for acquiring DWI imaging with eletrocardiogram (ECG)-triggered and navigator-gating at short-axis plane. The detailed scanning parameters were summarized in Table 1. DWI and T2* mapping imaging were then transferred to the workstation (Intellispace Portal version 10.1; Philips Healthcare) for post-processing. Three regions of interest (ROI) were determined by LGE and T2-STIR imaging, which were infarct, border and remote regions in patients with STEMI by an experienced radiologist (with 3-year experience). The values of ADC and T2* were recorded according to the corresponding region and the values of healthy volunteers were also recorded. One-way analysis of variance (ANOVA) tests were calculated to analyze the differences between different groups and regions. Levene’s test was used to assess the homogeneity of variance among groups with Bonferroni for multiple tests. Spearman’s test was used to explore the correlation between T2* and ADC values. All data were analyzed by using SPSS (version 19.0.0) software. P < 0.05 was considered as significant difference.Results
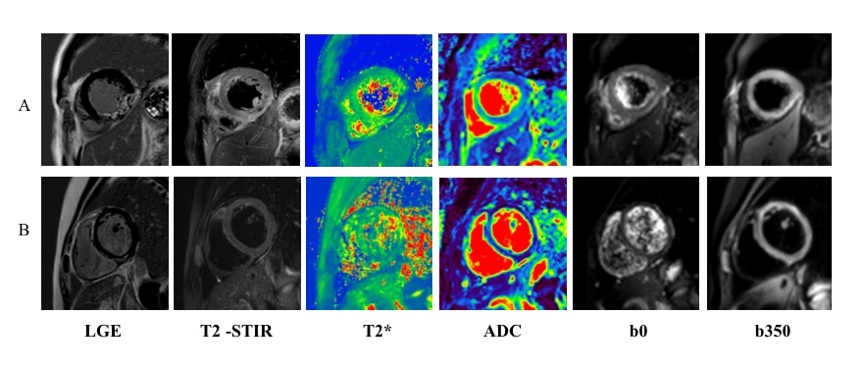
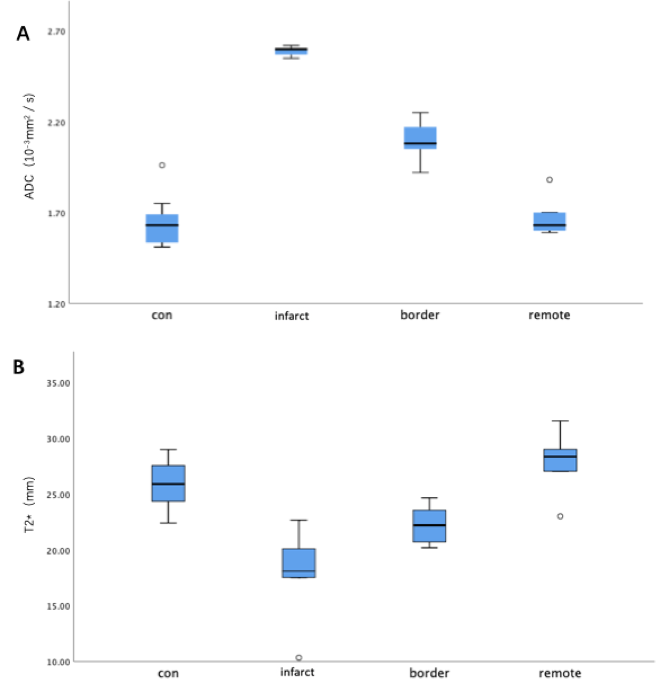
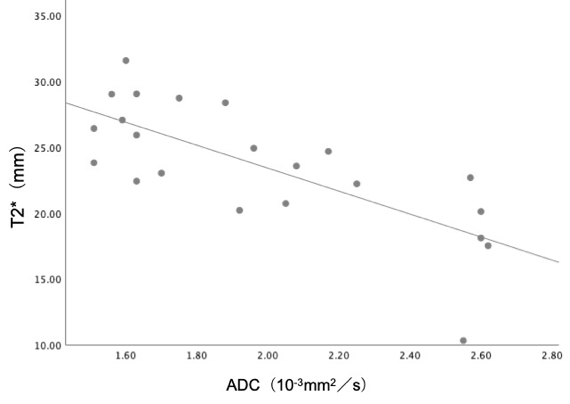
A total of 8 patients with STEMI (58.63 ± 10.65 years; 50 % men) and 7 control healthy volunteers (48.00 ± 17.91 years; 42.9 % men) were finally recruited. The images of STEMI and healthy control were shown in Figure 1. There were remarkably differences in these groups for ADC values and T2* values and their distributions in control, infarct, border and remote groups as shown in Figure 2. Bonferroni tests revealed that the ADC values of infarct regions (2.59 × 10⁻³ mm2/s; 95 % CI: 2.55, 2.62) were higher than those in border regions (2.09 × 10⁻³ mm2/s; 95 % CI: 2.55, 2.62; P < .001), and remote regions (1.68 × 10⁻³ mm2/s; 95 % CI: 1.53, 1.83; P < .001), and control group (1.65 × 10⁻³ mm2/s; 95 % CI: 1.50, 1.80; P < .001). And there were no significant differences between remote regions and control group. As for T2* values, infarct regions (17.74 ms; 95 % CI: 12.02, 23.46) were lower than those in remote regions (27.79 ms; 95 % CI: 23.90, 31.69; P < .001) and control group(25.87 ms; 95 % CI: 23.63, 28.12; P = 0.002), but had no significant differences when compared with border regions. Furthermore, there was a negative correlation between T2* and ADC values (r = 0.-734;P < .001; Figure 3).Discussion
DWI has been widely used in clinical studies to measure the motion of water molecules at microscopic level. Previous study revealed that the ADC values were remarkably higher in infarct regions than those in the other regions, indicating that the water diffusivity in infarcted area was higher, which was consistent with our study [4]. T2* value less than 20 milliseconds indicated microvascular injury and accumulation of iron in STEMI patients [7]. This study showed that there was a negative correlation between ADC and T2*, which indicated that the diffusion degree of water molecules was related with the concentration of iron in the infarct area of STEMI patients. The reason for the increase of ADC value and the decrease of T2* value might because myocardial injury caused by artery occlusion and the increase of myocardial iron content caused by hemoglobin degradation. Thus, follow-up research is necessary to explore the relationship between the changes of ADC、T2* and cardiac functional parameters or clinical characteristics in the future.Conclusion
In the infarct area of patients with STEMI, the ADC value increased and the T2* value decreased, there was a negative correlation between ADC and T2*.Acknowledgements
None.References
1. Dai, J., et al., In vivo predictors of plaque erosion in patients with ST-segment elevation myocardial infarction: a clinical, angiographical, and intravascular optical coherence tomography study.Eur Heart J, 2018. 39(22): p. 2077-2085.
2. Shlofmitz, E., et al., Impact of intravascular ultrasound on Outcomes following PErcutaneous coronary interventioN for In-stent Restenosis (iOPEN-ISR study).Int J Cardiol, 2021. 340: p. 17-21.
3. Adam, G., et al., Magnetic resonance imaging of arterial stroke mimics: a pictorial review.Insights Imaging, 2018. 9(5): p. 815-831.
4. Moulin, K., et al., MRI of Reperfused Acute Myocardial Infarction Edema: ADC Quantification versus T1 and T2 Mapping.Radiology, 2020. 295(3): p. 542-549.
5. Bradley, W.G., Jr., MR appearance of hemorrhage in the brain.Radiology, 1993. 189(1): p. 15-26.
6. Triadyaksa, P., M. Oudkerk, and P.E. Sijens, Cardiac T2 * mapping: Techniques and clinical applications.J Magn Reson Imaging, 2020. 52(5): p. 1340-1351.
7. Robbers, L., et al., The influence of microvascular injury on native T1 and T2* relaxation values after acute myocardial infarction: implications for non-contrast-enhanced infarct assessment.Eur Radiol, 2018. 28(2): p. 824-832.
Figures