4160
T1 rho mapping and native T1 mapping for endogenous assessment of myocardial fibrosis in hypertrophic cardiomyopathy1Fuwai Hospital, Beijing, China, 2Philips Healthcare, Beijing, China
Synopsis
This study is to examine the feasibility of T1 rho and native T1 mapping for endogenous detection of diffuse and focal myocardial fibrosis in patients with hypertrophic cardiomyopathy (HCM). Results showed that absolute T1 rho increased progressively and significantly from healthy controls to HCM without LGE and then to HCM with LGE, whereas T1 native increased significantly only from healthy controls to HCM with LGE. Besides, both T1 rho and native T1 had moderate correlation with LGE ratio in severe segments.
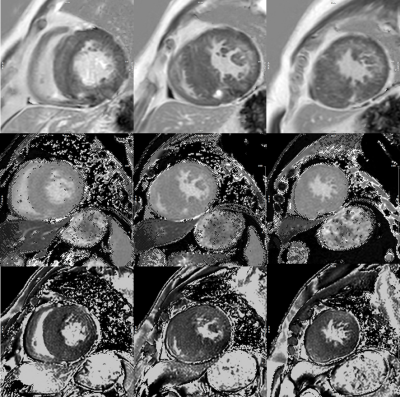
Methods 28 patients with HCM and 8 healthy volunteers were prospectively enrolled. All the CMR protocols were conducted in 3.0T MR system (Ingenia 3.0T, Philips Healthcare, the Netherlands). T1 rho mapping, T1 mapping, and late enhancement (LGE) imaging were in 28 patients with HCM. T1 rho mapping and T1 mapping were performed in 8 healthy volunteers. T1 rho and T1 time in each segment of left ventricle were measured according to AHA 16-segment model. All segments were graded as group 1( The ratio of LGE in each segment:<10%), group 2(LGE ratio: 10-50%) or group 3 (LGE ratio:>50%). Segmental values were compared among 3 groups. Global values of were compared among LGE positive, LGE negative HCM patients and healthy controls.
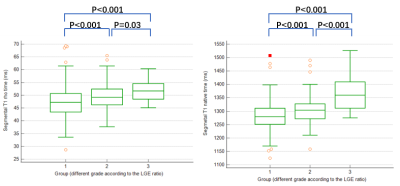
Results LGE were detected in 22 HCM patients. Among three groups of all 448 segments , significant differences were existed in T1 native time (group 1, 268 segments, 1280.5±49.0ms; group2, 148 segments, 1303.6±46.4ms; group 3, 32 segments, 1366.1±63.5ms,p<0.001) as well as in T1 rho time (group 1, 47.4±5.7ms; group2, 49.6±4.9ms; group 3, 51.8±4.4ms,p<0.001) . Among LGE positive(n=22), LGE negative(n=8) HCM patients and healthy controls(n=8), there were also significant differences in global T1 native time (LGE positive, 1300.4±40.0ms; LGE negative, 1278.0±31.7;healthy controls, 1263.4±28.8ms, p=0.04) and global T1 rho time(LGE positive, 48.6±3.2ms; LGE negative, 46.5±3.1;healthy controls, 42.3±2.9ms, p<0.001). In further pairwise analysis, the global T1 native time in LGE positive HCM patients was significantly elevated compared with healthy controls(p=0.015) and there was no significant difference between LGE negative HCM patients and healthy controls(p=0.454). On the contrary, the global T1 rho time in HCM patients was significantly elevated compared with healthy controls, regardless of LGE positive (p<0.001) or negative (p=0.018). In all segments(n=448) in patients with HCM, T1 native time has a moderate correlation with LGE ratio (Spearman r=0.383, p<0.001) whereas T1 rho time had a mild correlation (Spearman r=0.229, p<0.001). In severe LGE segments (group 3, n=32) in patients with HCM, both T1 rho time (Pearson r=0.483, p<0.006) and T1 native time (Pearson r=0.475, p<0.005) had moderate correlation with LGE ratio.
Conclusion Both T1 rho and native T1 map can endogenously evaluate the severity of the fibrosis in patients with HCM. Besides, T1 rho can distinguish HCM patients without LGE from health controls.
Acknowledgements
No acknowledgement found.References
1. Geske JB, Ommen SR, Gersh BJ. Hypertrophic Cardiomyopathy: Clinical Update. JACC Heart failure. 2018;6(5):364-375.
2. Małek Ł A, Werys K, Kłopotowski M, et al. Native T1-mapping for non-contrast assessment of myocardial fibrosis in patients with hypertrophic cardiomyopathy--comparison with late enhancement quantification. Magnetic resonance imaging. 2015;33(6):718-724.
3. Wu CW, Wu R, Shi RY, et al. Histogram Analysis of Native T(1) Mapping and Its Relationship to Left Ventricular Late Gadolinium Enhancement, Hypertrophy, and Segmental Myocardial Mechanics in Patients With Hypertrophic Cardiomyopathy. Journal of magnetic resonance imaging : JMRI. 2019;49(3):668-677.
4. Thompson EW, Kamesh Iyer S, Solomon MP, et al. Endogenous T1ρ cardiovascular magnetic resonance in hypertrophic cardiomyopathy. Journal of cardiovascular magnetic resonance : official journal of the Society for Cardiovascular Magnetic Resonance. 2021;23(1):120.
Figures

