4159
Combination of strain with LGE can improve diagnostic ability for differentiation hypertrophic cardiomyopathy from hypertensive heart disease1Department of Cardiology, the Second Affiliated Hospital of Harbin Medical University, Harbin, China, 2Philips Healthcare, Beijing, China
Synopsis
To evaluate the value of left ventricular radial strain (LVRS) and left ventricular circumferential strain (LVCS) in discriminating between hypertrophic cardiomyopathy (HCM) and hypertensive heart disease (HHD) by using cardiac magnetic resonance feature tracking (CMR-FT). HCM patients presented higher values of LVRS and LVCS when compared with HHD patients. And both LVRS and LVCS correlated obviously with left ventricular ejection fraction (LVEF) in HCM patients. Furthermore, the combination of strain with LGE can significantly improve the diagnostic ability for differentiation HCM from HHD (AUC: 0.86; sensitivity: 86.9 %; specificity: 76.3 %).
Introduction
Hypertrophic cardiomyopathy (HCM) is the most ordinary inherited cardiomyopathy, which is associated with abnormally hypertrophied heart muscle and disarray of cardiomyocytes [1, 2]. Hypertensive heart disease (HHD) is characterized by increased left ventricular wall thickness (LVWT) due to changes adapted to uncontrolled increased afterload [3]. HCM and HHD have similar features in clinical diagnosis, and both of them are related to LVWT. Cardiac magnetic resonance feature tracking (CMR-FT) technology provides methods for analysis of myocardial deformation and determination of myocardial strain parameters [4]. Global left ventricular longitudinal strain (LVLS) and circumferential transmural strain difference (cTSD) have been proved to be sensitive for evaluating HCM [5, 6]. However, few studies have focused on left ventricular radial strain (LVRS) and left ventricular circumferential strain (LVCS) for differentiation HCM from HHD, especially the lack of combination with late gadolinium enhancement (LGE) images. The purpose of this study is to distinguish HCM and HHD by using CMR-FT and LGE parameters.Methods
A systematically analysis was conducted in HCM and HHD patients who underwent cardiac MRI from September 2020 to April 2021. All of CMR images were acquired by MRI (Ingenia 3.0T CX, Philips Healthcare the Netherlands) using a 32 channel phased-array abdomen coil. Steady-state free precession (SSFP) cine with breath-hold and ECG trigger was used for cardiac morphologic and functional analysis. Late gadolinium enhancement (LGE) images were acquired ten minutes after injection of gadolinium-based contrast agent (Bayer Healthcare, Germany) by using a three-dimensional phase sensitive inversion recovery (PSIR) sequence. CVI software (cvi42, Circle Cardiovascular Imaging Inc., Calgary, Alberta, Canada) was used for post-processing. LV was assessed by 17 segments according to American Heart Association [7]. The segments 8 and 9 were defined as mid interventricular septal (mIVS) in this study. Comparisons for parameters were performed by Student’s t-test or Mann-Whitney U test for normally and nonnormally distribution respectively. Pearson or Spearman’s correlation coefficients were calculated to assess the correlations between quantitative parameters. Univariate and multivariate logistic regression were calculated to test the diagnostic ability for distinguishing these two deseases. Area under the curves (AUCs), specificity, sensitivity and Youden’s index were analyzed by receiver-operating characteristic (ROC) curve. Delong’s test was used to compare AUCs among LGE (mIVS), LCRS, LVCS and their combination. All data were calculated by SPSS (version 19.0.0; International Business Machines Corp., Armonk, New York, USA). P < 0.05 was considered to be statistically significant.Results
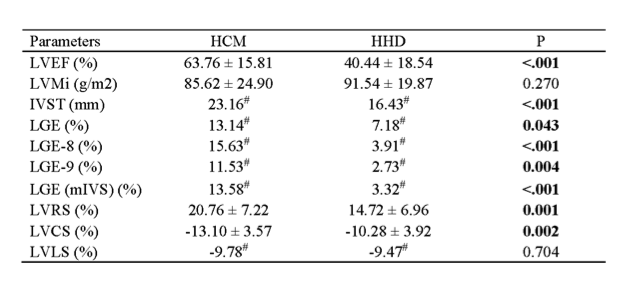
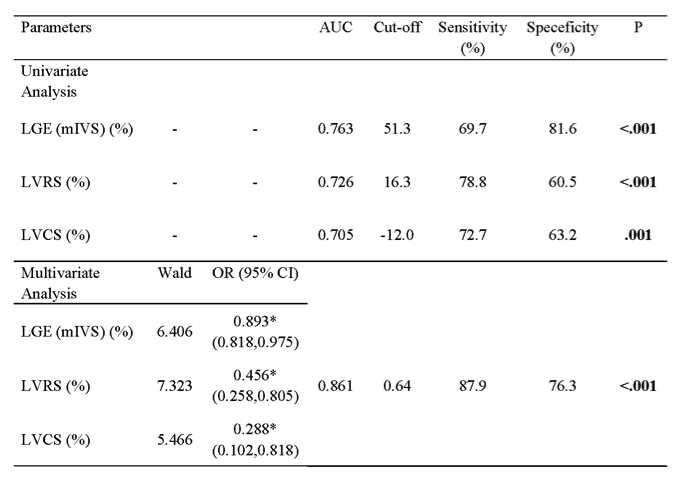
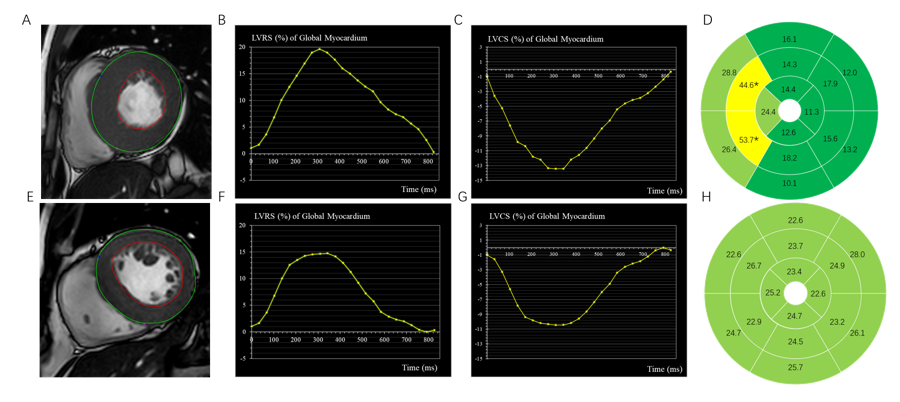
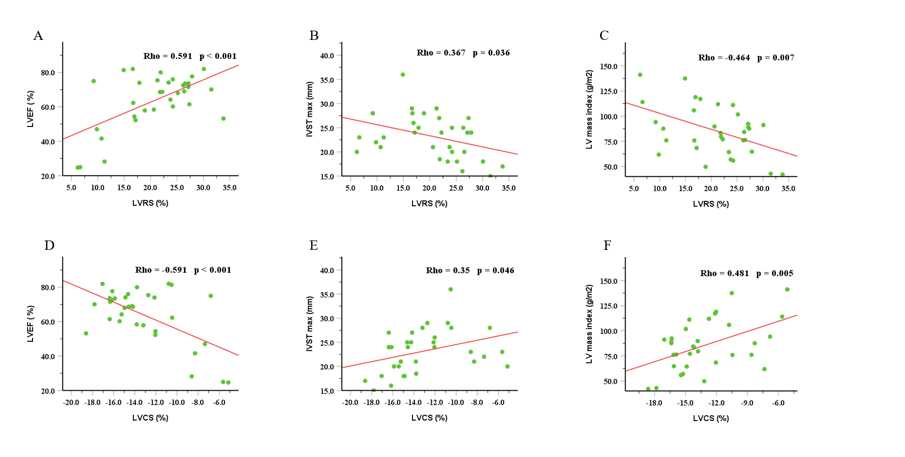
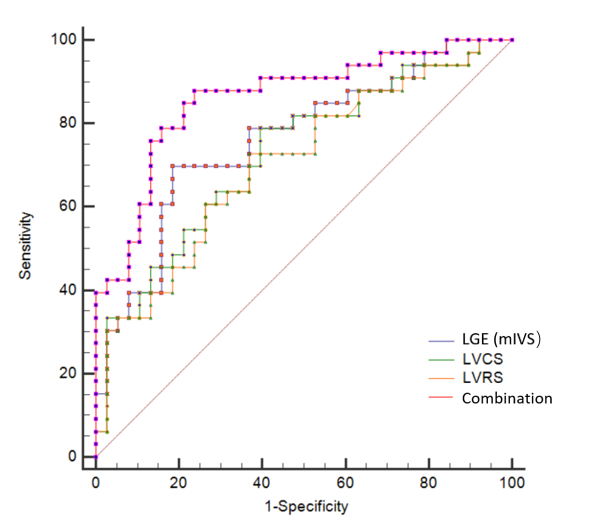
33 patients with HCM (56.83 ± 11.86 years; 66.7 % men) and 38 patients with HHD (49.06 ± 15.32 years; 78.9 % men) were included in this study. HCM patients presented higher values of LVRS and LVCS relative to HHD patients (LVRS, 20.76 ± 7.22 % vs. 14.72 ± 6.96 %; LVCS, -13.10 ± 3.57 % vs. -10.28 ± 3.92 %; both P < 0.05) (Table 1). HCM in comparison to HHD patients had higher values of LGE (segments 8, 9 mIVS) (all P < 0.05). In addition, both LVRS and LVCS had correlations with left ventricular ejection fraction (LVEF), interventricular septum thickness (IVST) and left ventricular mass index (LVMi) in HCM patients, especially for LVEF (LVRS, R = 0.591, P < 0.001; LVCS, R = -0.591, P < 0.001) (Figure 2). Furthermore, the AUCs of LVRS, LVCS and LGE (mIVS) for distinguishing HCM and HHD were 0.726 (sensitivity: 78.8 %, specificity: 60.5 %, P < 0.001), 0.705 (sensitivity: 72.7 %, specificity: 63.2 %, P = 0.001) and 0.763 (sensitivity: 69.7 %, specificity: 81.6 %, P < 0.001) respectively (Table 2). In addition ,the combination model of LGE (mIVS), LVRS and LVCS obtained highest AUC value, which was 0.861 with 86.9% sensitivity and 76.3% specificity. Delong’s test showed that AUC of combination model with LGE was higher than LVRS (P = 0.002) and LVCS (P = 0.003) (Figure 3).Discussion
HCM patients had higher IVST and EF than HHD patients, however, these physiological indexes were not enough to distinguish the two diseases clinically. The results of this study demonstrated that LVRS, LVCS, LGE (mIVS) and their combination could be used to differentiate HCM and HHD. Moreover, there were strong correlations between LVRS, LVCS and LVEF for HCM patients. Previous studies showed myocardial strain can reflect cardiac characteristics in preclinical stage, even before obvious changes of cardiac structure and function [6]. This maybe mean that radial and circumferential motion abilities of these two diseases are different during cardiac cycle in early clinical practice. Segmental analysis was used because IVS was the most common involved segment of the two diseases. Our study found that there was significant difference in LGE of mIVS between the two groups, which indicated that the degree of interstitial fibrosis and scar formation in HCM was higher [8], which tended to lead to adverse prognosis, such as malignant arrhythmia and even sudden death. Besides, our results showed that combination of LGE with LVRS, LVCS can achive the highest diagnostic ability, this may provide more valuable information for clinical diagnosis.Conclusion
The measurement of myocardial LVRS and LVCS by CMR-FT, as well as LGE in mIVS can provide an effective method to distinguish HCM from HHD. Combination of multiparameters can significantly improve the diagnostic ability.Acknowledgements
None.References
1. Maron, B.J., Clinical Course and Management of Hypertrophic Cardiomyopathy.N Engl J Med, 2018. 379(20): p. 1977.
2. Grupa Robocza Europejskiego Towarzystwa Kardiologicznego do spraw rozpoznawania i postepowania w kardiomiopatii, p., et al., [2014 ESC Guidelines on diagnosis and management of hypertrophic cardiomyopathy].Kardiol Pol, 2014. 72(11): p. 1054-126.
3. Chobanian, A.V., et al., Seventh report of the Joint National Committee on Prevention, Detection, Evaluation, and Treatment of High Blood Pressure.Hypertension, 2003. 42(6): p. 1206-52.
4. Neisius, U., et al., Cardiovascular magnetic resonance feature tracking strain analysis for discrimination between hypertensive heart disease and hypertrophic cardiomyopathy.PLoS One, 2019.14(8): p. e0221061.
5. Xu, J., et al., MRI T1 Mapping in Hypertrophic Cardiomyopathy: Evaluation in Patients Without Late Gadolinium Enhancement and Hemodynamic Obstruction.Radiology, 2020. 294(2): p. 275-286.
6. Vigneault, D.M., et al., Left Ventricular Strain Is Abnormal in Preclinical and Overt Hypertrophic Cardiomyopathy: Cardiac MR Feature Tracking.Radiology, 2019. 290(3): p. 640-648.
7. Fattori, R., et al., Significance of magnetic resonance imaging in apical hypertrophic cardiomyopathy.Am J Cardiol, 2010. 105(11): p. 1592-6.
8. Giusca, S., et al., Multi-parametric assessment of left ventricular hypertrophy using late gadolinium enhancement, T1 mapping and strain-encoded cardiovascular magnetic resonance.J Cardiovasc Magn Reson, 2021. 23(1): p. 92.
Figures