4158
3D free-breathing simultaneous whole heart T1 and T2 mapping based on SAturation Recovery and Variable flip Angle (SAVA)1Center for Biomedical Imaging Research, Department of Biomedical Engineering, Tsinghua University, Beijing, China, 2Department of Medicine, Beth Israel Deaconess Medical Center and Harvard Medical School, Boston, MA, United States, 3National Heart, Lung, and Blood Institute, National Institutes of Health, Bethesda, MD, United States
Synopsis
Myocardial T1 and T2 mapping enable quantitative detection of various cardiac diseases. Here we propose a fast 3D free-breathing simultaneous T1 and T2 mapping sequence, which acquires four volumes for joint estimation of T1 and T2. A very small flip angle is used for efficient sampling of the equilibrium longitudinal magnetization. Whole-heart T1 and T2 maps were acquired with high resolution of 1.5×1.5×4mm3 within 5 min in normal human subjects with image quality comparable to conventional 2D methods.
INTRODUCTION
Cardiovascular magnetic resonance parametric mapping can provide quantitative tissue characterization in various cardiac disease such as fibrosis, myocarditis, iron, and amyloid (1) among others. Many approaches are commercially available for both T1 (e.g. Modified look-locker inversion recovery (MOLLI) (2), Saturation recovery single-shot acquisition (SASHA) (3)) and T2 (e.g. Gradient Spin Echo (GraSE) (4) and T2-Prep based (5)) and are now widely used in clinical practice. However, 2D sequences are limited in the spatial coverage. Separate mapping acquisitions increase the total scan time and can result in spatial mismatch which hampers voxel-based analysis. Simultaneous whole-heart T1 and T2 mapping sequences have been proposed (6–8). While these 3D sequences have higher resolution and larger coverage, long scan times remain a major limitation (6,7). We propose a 3D free-breathing simultaneous whole heart T1 and T2 mapping sequence, SAturation recovery and Variable flip Angle (SAVA), which enables highly efficient and simultaneous acquisition of inherently co-registered T1 and T2 maps.METHODS
Sequence Design: The proposed free-breathing sequence, referred to as SAVA T1-T2, sequentially acquires four 3D volumes with hybrid T1 and T2 weighting (Figure 1). The first volume (IMG1) is sampled without preparation pulses to measure the equilibrium longitudinal magnetization. A very small flip angle (FA) of 2° is used to minimize the impact of imaging on the magnetization and shorten the recovery time before the subsequent readout (9). The following three volumes (IMGi, i=2,3,4) are prepared by both saturation (SAT) and T2 preparation (T2 PREP). The delay times after SAT (TSAT i) and echo times (TEi) of T2 PREP are variable. TSAT i linearly distributed from 0.5×TMAX to TMAX, where TMAX was the maximal available TSAT in one cardiac cycle. FA = 15° is used for readout to obtain a high signal to noise ratio. The signal intensity of the ith volume (Si) is formulated in the following equation:$$$S_i=S_0 (1-e^{\frac{-T_{SATi}}{T_1} } ) e^{\frac{-TE_i}{T_2}} \sin(FA_i)$$$ [1]
where S0 is the steady-state signal.
Joint T1 and T2 calculation: T1 and T2 are jointly calculated voxel by voxel from the four volumes using a dictionary matching method combined with an orthogonal matching pursuit algorithm (10). The dictionary is generated using Equation 1, with T1 ranging from 60ms to 2500ms in 5ms steps while T2 ranges from 4ms to 100ms in 1ms steps, from 102ms to 200ms in 2ms steps, and from 210ms to 450ms in 10ms steps (11).
Experiments: The study was approved by the local institutional review board. Four normal human subjects (2 males, 23 ± 4 years) were recruited and imaged with SAVA T1-T2, MOLLI and GraSE on a 3.0T MR scanner (Ingenia CX, Philips Healthcare, Best, Netherlands). Written informed consent was obtained from all subjects. SAVA T1-T2 imaging parameters were: FOV 300×300×92mm3, voxel size1.5×1.5×8mm3 reconstructed to 1.5×1.5×4 mm3, TR/TE 4.3ms/1.35ms, 35 readouts per shot, TSATi/TEi 0.5×TMAX/0ms, 0.75×TMAX/25ms, TMAX/45ms for i=2,3,4, and CS-SENSE factor 2. MOLLI and GraSE acquired three slices in three breath-holds. Imaging parameters were: FOV 300×300mm2, voxel size 2×2×10mm3. MOLLI was performed using 5s(3s)3s scheme, TR/TE/flip angle 2.1ms/0.97ms/35°, SENSE factor 2. GraSE used nine echo times ranging from 8.8ms to 79.6ms, TR 1 heartbeat, EPI factor 7.
The left ventricle (LV) was manually segmented on T1 and T2 maps and divided into the 16 AHA segments (excluding apex). The mean, standard deviation (SD), of T1 and T2 within each segment were calculated.
RESULTS
SAVA T1-T2 was successful for all subjects within 4.9 ± 0.5 min (mean heart rate 61 ± 7 bpm). Representative whole heart T1 and T2 maps from one normal human subject are shown in Figures 2 and 3. Homogeneous T1 and T2 values were observed throughout the whole heart as shown by the histograms in Figures 2B and 3B. High spatial resolution and coverage allowed excellent delineation of the ventricular structure (Figures 2C and 3C). The image quality of SAVA T1-T2 was comparable with MOLLI and better than GraSE as shown in Figure 4. SAVA T1-T2 estimated a higher T1 than MOLLI, and T2 comparable to GraSE (Figure 5).DISCUSSION
In this study we proposed a highly efficient sequence for simultaneous whole heart T1 and T2 mapping. A very small flip angle was used for the acquisition of equilibrium signal to reduce the disturbance to the magnetization, thus removing the next for extended recovery times and increasing efficiency. Additionally, the use of a dictionary approach required only four volumes for successful parameter recovery via joint estimation. As MOLLI had a T1 underestimation (12), SAVA T1-T2 tend to have a better accuracy with higher T1 than MOLLI. Further investigation is warranted on both phantom and in-vivo experiments on patients.CONCLUSION
The proposed SAVA T1-T2 sequence can provide efficient whole heart T1 and T2 mapping with a high resolution of 1.5×1.5×4mm3 in 5 min.Acknowledgements
No acknowledgement found.References
1. Messroghli DR, Moon JC, Ferreira VM, et al. Clinical recommendations for cardiovascular magnetic resonance mapping of T1, T2, T2 and extracellular volume: A consensus statement by the Society for Cardiovascular Magnetic Resonance (SCMR) endorsed by the European Association for Cardiovascular Imagin. J. Cardiovasc. Magn. Reson. 2017;19:1–24 doi: 10.1186/s12968-017-0389-8.
2. Messroghli DR, Radjenovic A, Kozerke S, Higgins DM, Sivananthan MU, Ridgway JP. Modified look-locker inversion recovery (MOLLI) for high-resolution T 1 mapping of the heart. Magn. Reson. Med. 2004;52:141–146 doi: 10.1002/mrm.20110.
3. Chow K, Flewitt JA, Green JD, Pagano JJ, Friedrich MG, Thompson RB. Saturation recovery single-shot acquisition (SASHA) for myocardial T 1 mapping. Magn. Reson. Med. 2014;71:2082–2095 doi: 10.1002/mrm.24878.
4. Sprinkart AM, Luetkens JA, Träber F, et al. Gradient Spin Echo (GraSE) imaging for fast myocardial T2 mapping. J. Cardiovasc. Magn. Reson. 2015;17:1–9 doi: 10.1186/s12968-015-0127-z.
5. Giri S, Chung Y-C, Merchant A, et al. T2 quantification for improved detection of myocardial edema. J. Cardiovasc. Magn. Reson. 2009;11:56 doi: 10.1186/1532-429X-11-56.
6. Guo R, Chen Z, Herzka DA, Luo J, Ding H. A three‐dimensional free‐breathing sequence for simultaneous myocardial T 1 and T 2 mapping. Magn. Reson. Med. 2019;81:1031–1043 doi: 10.1002/mrm.27466.
7. Milotta G, Bustin A, Jaubert O, Neji R, Prieto C, Botnar RM. 3D whole‐heart isotropic‐resolution motion‐compensated joint T 1 /T 2 mapping and water/fat imaging. Magn. Reson. Med. 2020;84:3009–3026 doi: 10.1002/mrm.28330.
8. Guo R, Cai X, Kucukseymen S, et al. Free‐breathing simultaneous myocardial T 1 and T 2 mapping with whole left ventricle coverage. Magn. Reson. Med. 2021;85:1308–1321 doi: 10.1002/mrm.28506.
9. Guo R, Chen Z, Si D, Herzka DA, Luo J, Ding H. Combined SAturation recovery and Variable flip Angle ( SAVA ) for free-breathing high- resolution three-dimensional cardiovascular magnetic resonance T1 mapping at 3T. Proc. 27th Annu. Meet. ISMRM 2019.
10. Pati YC, Rezaiifar R, Krishnaprasad PS. Orthogonal matching pursuit: recursive function approximation with applications to wavelet decomposition. In: Proceedings of 27th Asilomar Conference on Signals, Systems and Computers. IEEE Comput. Soc. Press; 1993. pp. 40–44. doi: 10.1109/ACSSC.1993.342465.
11. Hamilton JI, Jiang Y, Chen Y, et al. MR fingerprinting for rapid quantification of myocardial T 1 , T 2 , and proton spin density. Magn. Reson. Med. 2017;77:1446–1458 doi: 10.1002/mrm.26216.
12. Kellman P, Hansen MS. T1-mapping in the heart: accuracy and precision. J. Cardiovasc. Magn. Reson. 2014;16:2 doi: 10.1186/1532-429X-16-2.
Figures
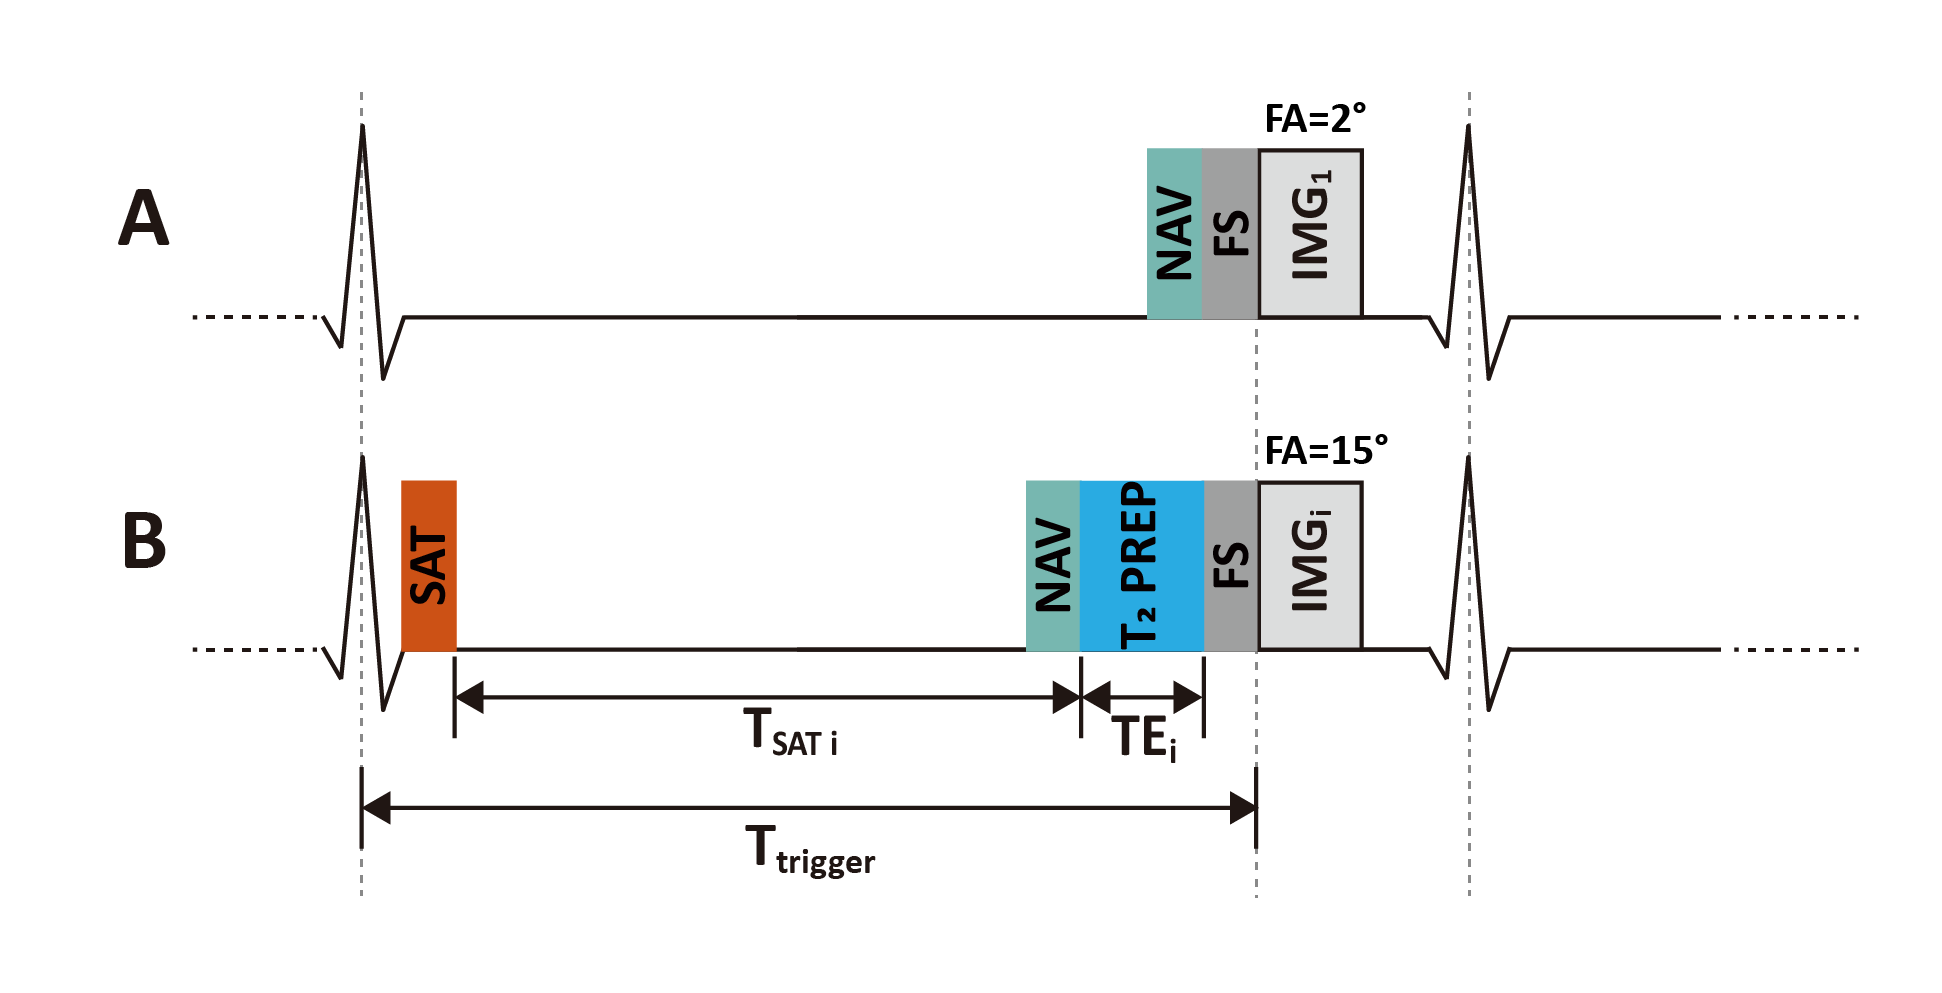
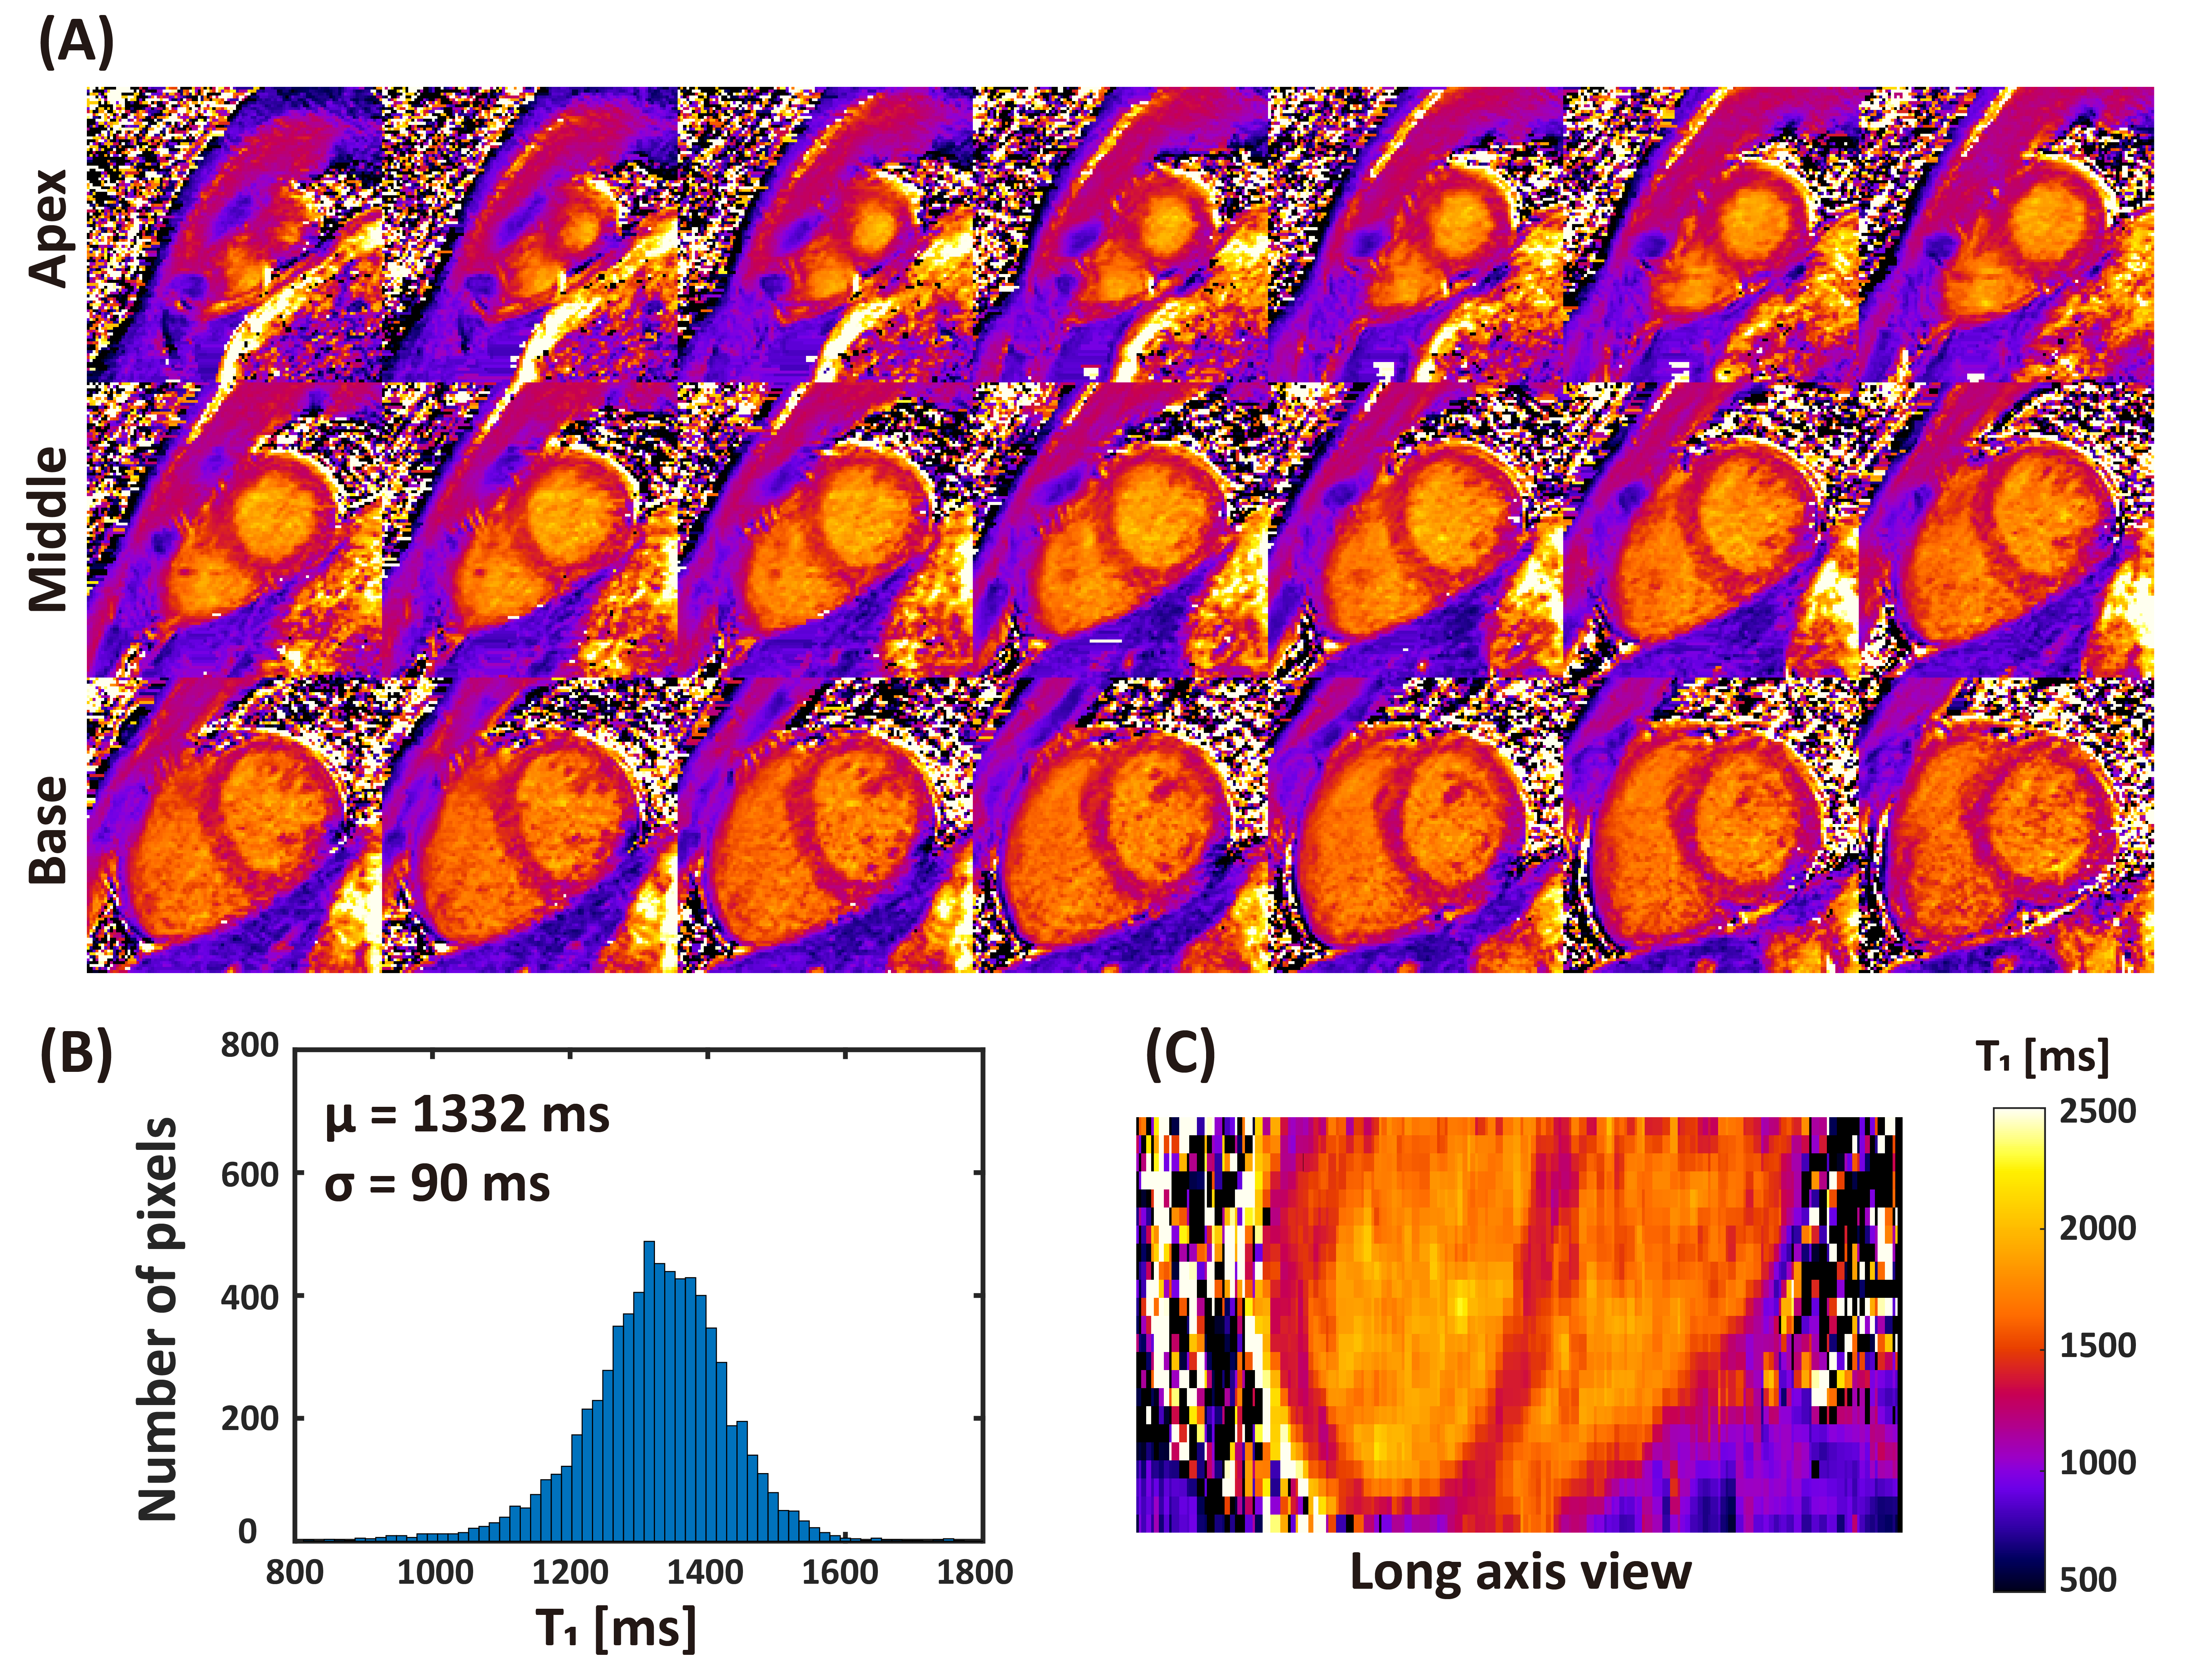
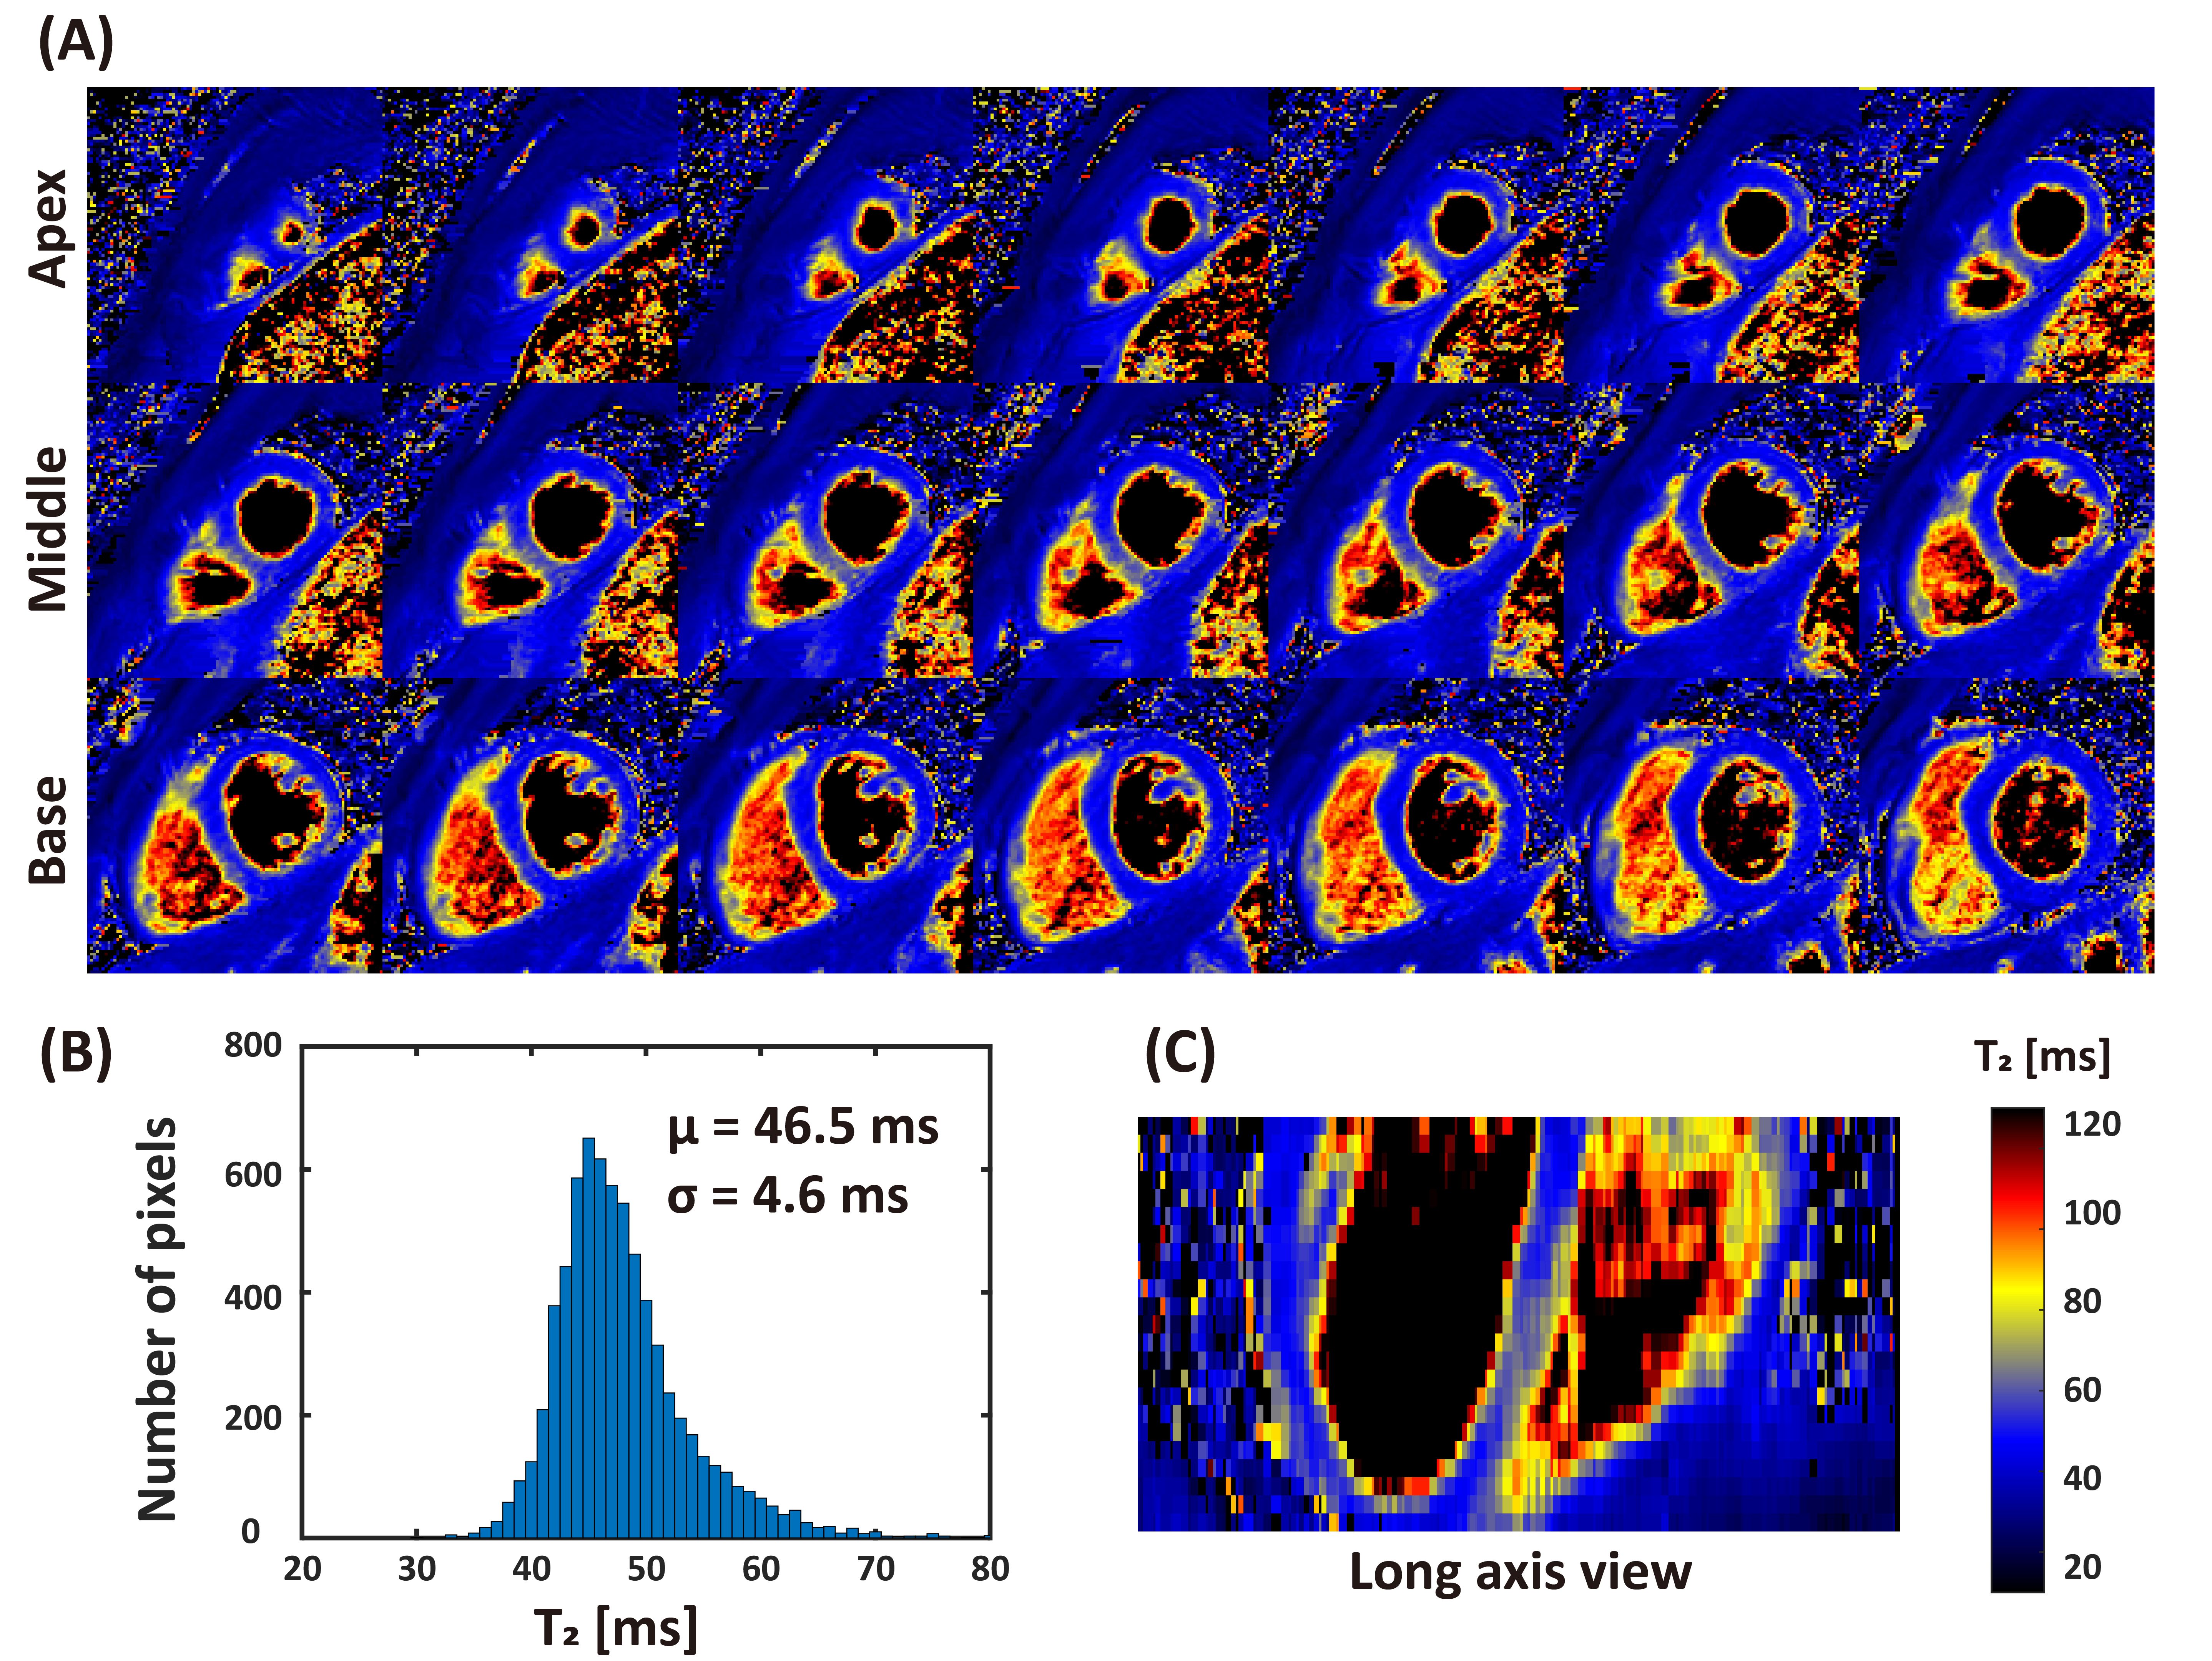
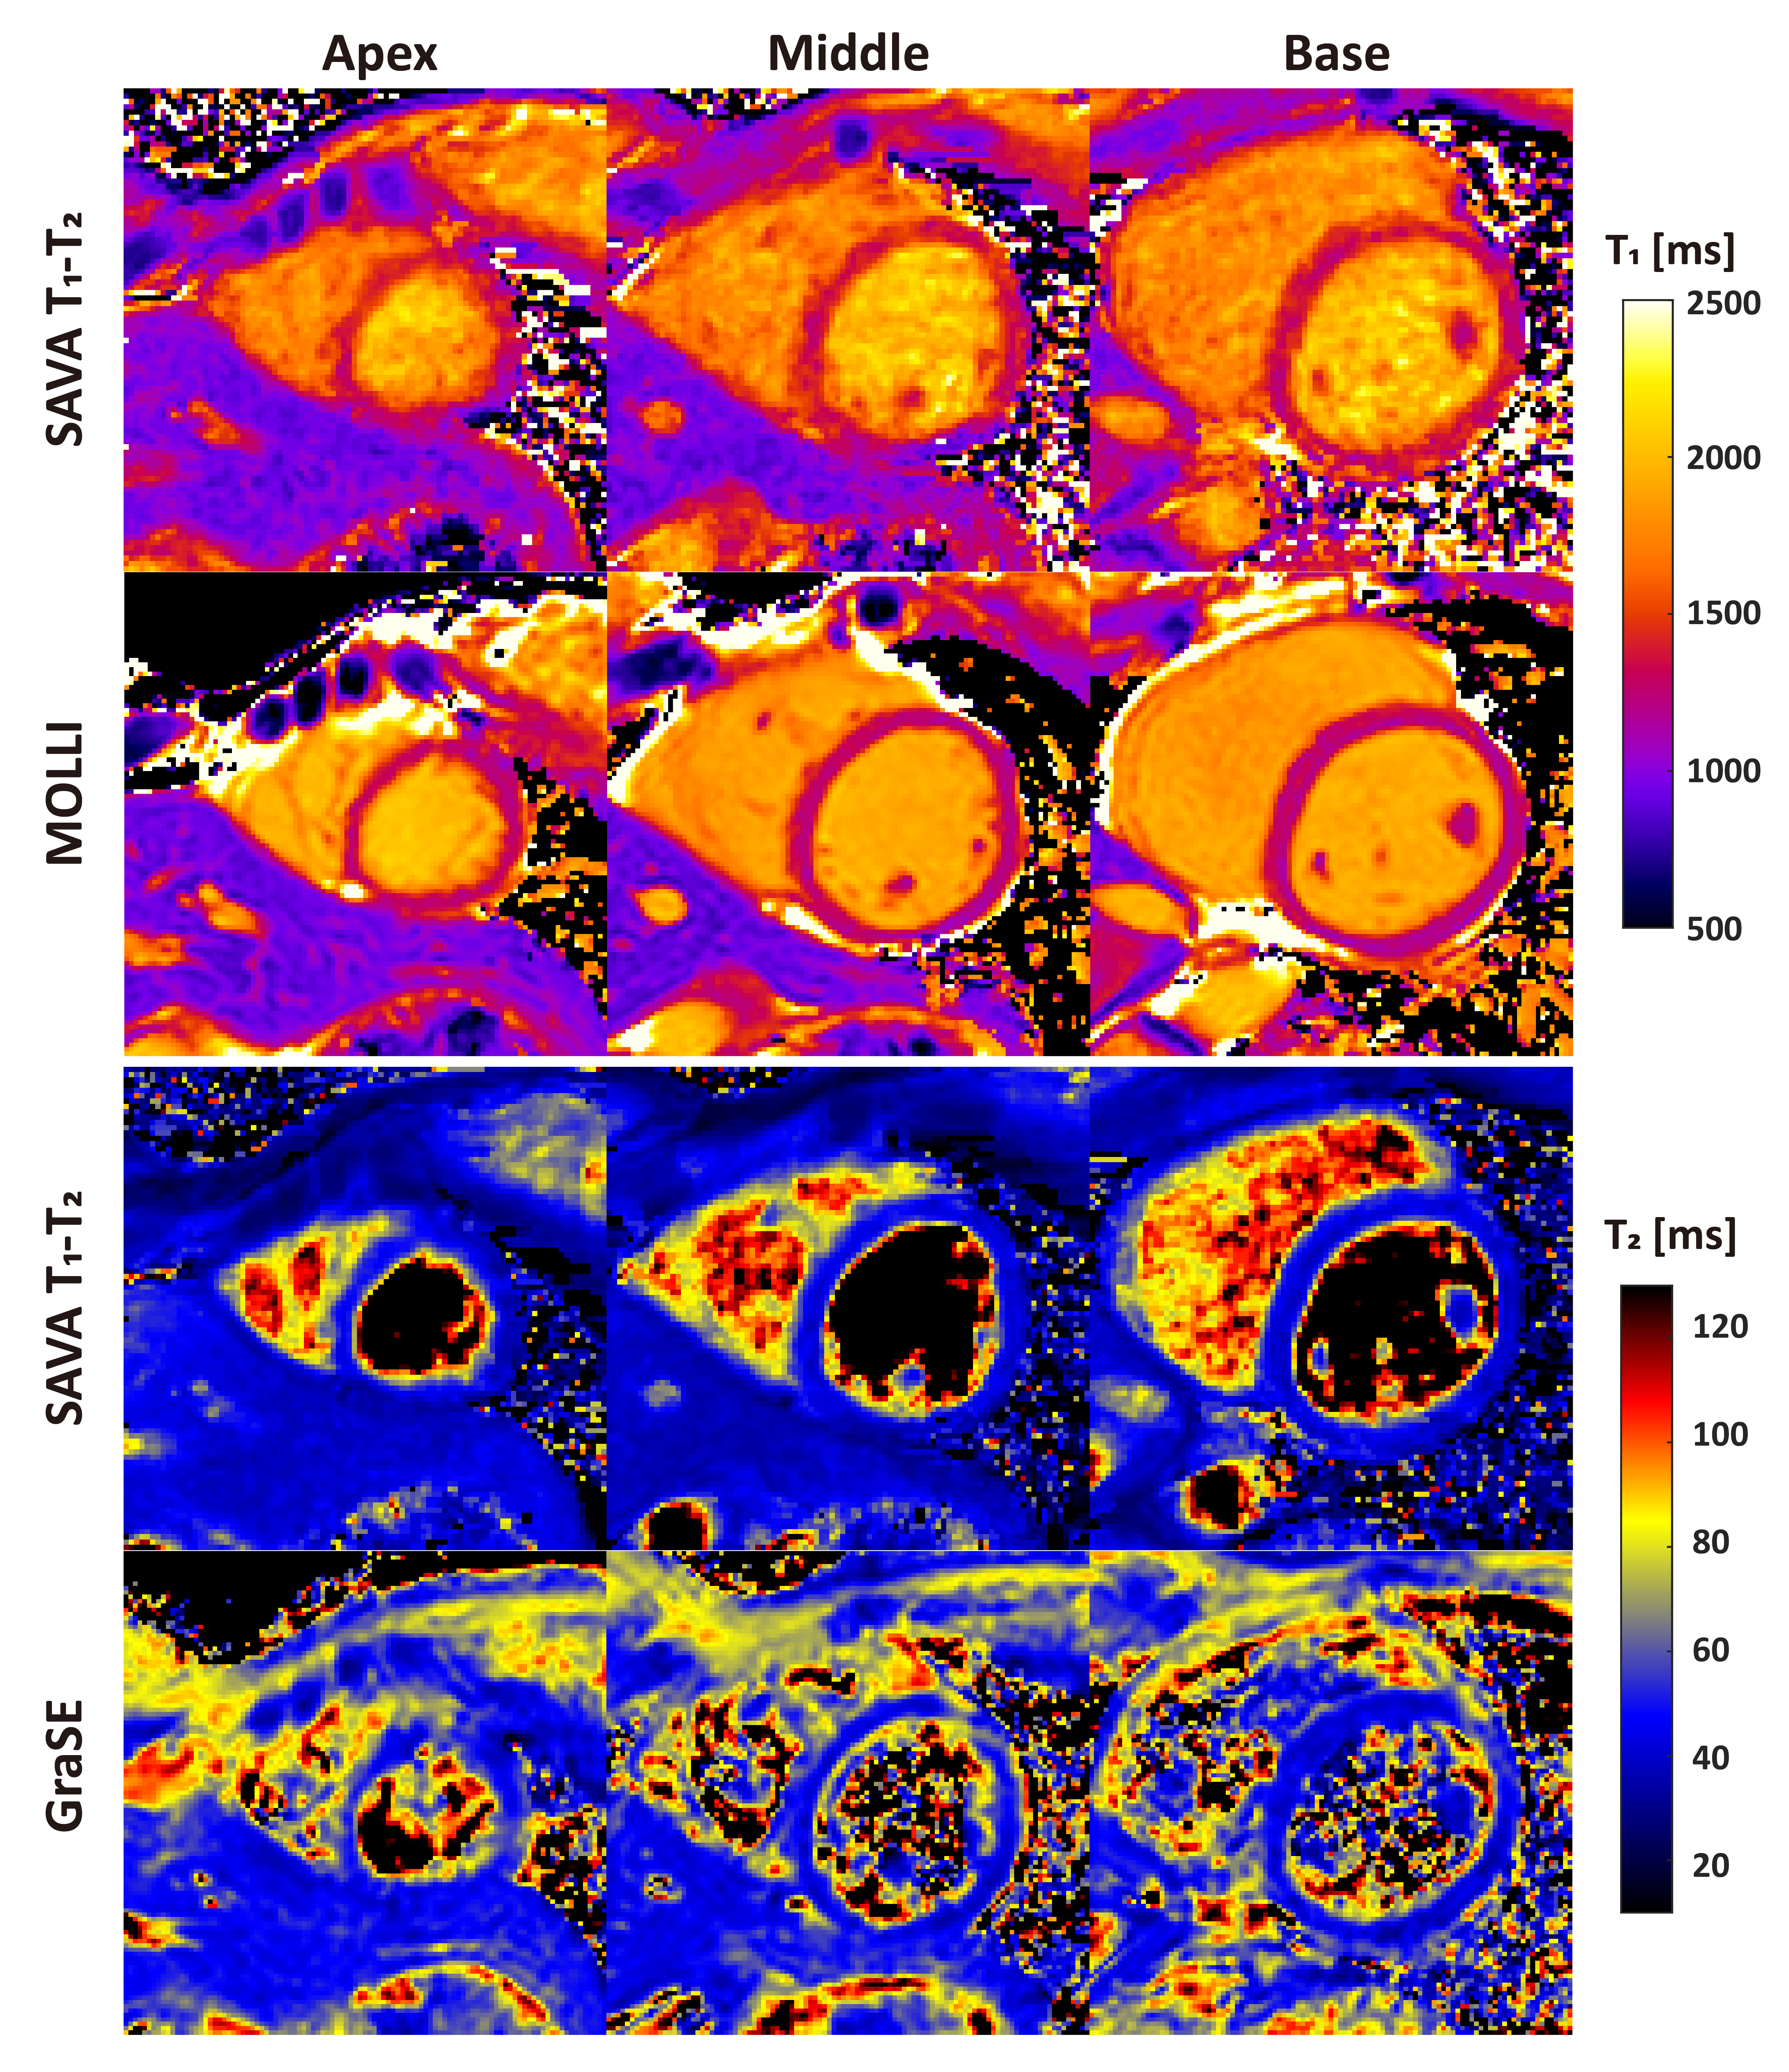
Figure 5. Bullseye plots of mean (top) and standard deviation (SD, bottom) averaged across subjects. Apical T1 and T2 were higher than from mid and basal slices. Compared with MOLLI, SAVA T1-T2 has higher T1 estimation and higher standard deviation (1339ms v.s. 1222ms and 98ms v.s. 49ms). SAVA T1-T2 demonstrated comparable T2 estimation with GraSE (mean 45.1ms vs 45.8ms and SD 4.4ms vs 4.4ms). Variation can be viewed at inferolateral segment due to field inhomogeneity.
A: apex; M: middle; B: base