4157
The feasibility of radiomic analysis based on T1 mapping to distinguish between hypertensive heart disease and hypertrophic cardiomyopathy1Department of Cardiology, the Second Affiliated Hospital of Harbin Medical University, Harbin, China, 2Philips Healthcare, Beijing, China
Synopsis
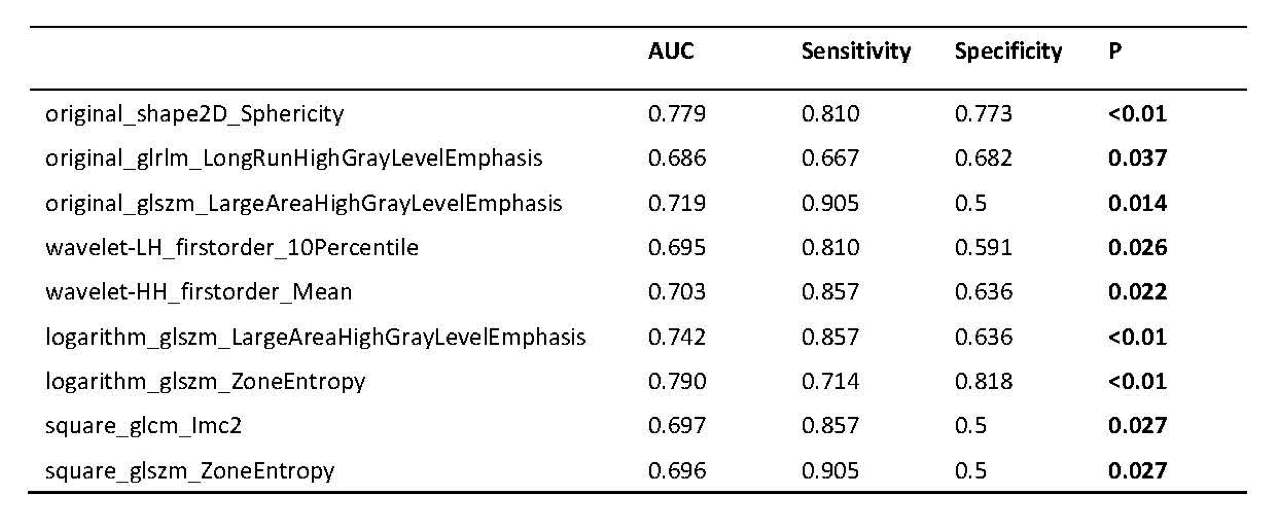
Hypertrophic cardiomyopathy (HCM) and hypertensive heart disease (HHD) share similar features, such as thickened left ventricular (LV) wall and reduced compliance, which make it difficult to distinguish HCM from HHD clinically. In this retrospective study, patients with HCM and HHD were enrolled to evaluate the feasibility of radiomic analysis to differentiate between these two diseases. For all calculated texture analysis (TA) features, AUCs of nine parameters had the values above 0.65, Logarithm_glszm_ZoneEntropy reached the best performance than other parameters (AUC: 0.790, sensitivity: 71.4 %, specificity: 81.8 %, P < 0.01).
Introduction
Hypertensive heart disease (HHD) is characterized by arranged hyperplastic myocytes and increased interstitial tissue due to changes compensated for increased arterial hypertension [1]. Hypertrophic cardiomyopathy is involved in abnormally hypertrophied heart muscle, disarray of cardiomyocytes and increased interstitial connective tissue [2]. Frequently, discrimination is not evident, especially when it comes to slight changes in early clinical stage, the differences become obscure [3, 4]. Thus, novel techniques and extensive experiences based on cardiac magnetic resonance (CMR) are urgently needed. Radiomics plays an increasingly important role in clinical decision-making by mining quantitative texture analysis (TA) features from medical images and screening the valuable organizational features by statistical or machine learning methods [5]. TA involves spatial arrangement and relationship of adjacent pixels, which provides an approach to quantify subtle imaging abnormalities. Relaxation time of longitudinal or spin lattice can be measured by T1 mapping, and biological determinants of increase of T1 values are edema and fibrosis, which have been widely studied in cardiomyopathy [6]. Furthermore, previous study showed that CMR histogram analysis of T1 mapping in white rabbit model could be an effective method to predict liver fibrosis stage [7]. Thus, we hypothesize that radiomic analysis based on T1 mapping could extract valuable TA features in the two diseases. The purpose of this study is to distinguish HHD and HCM by using as comprehensive TA features as possible.Methods
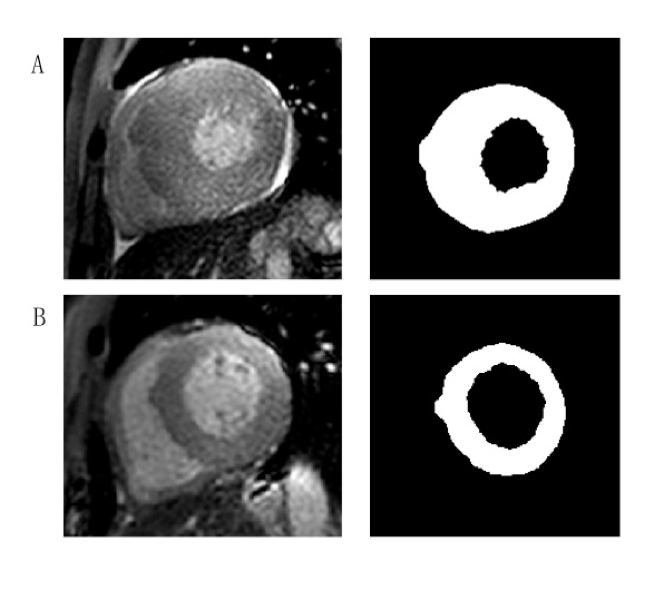
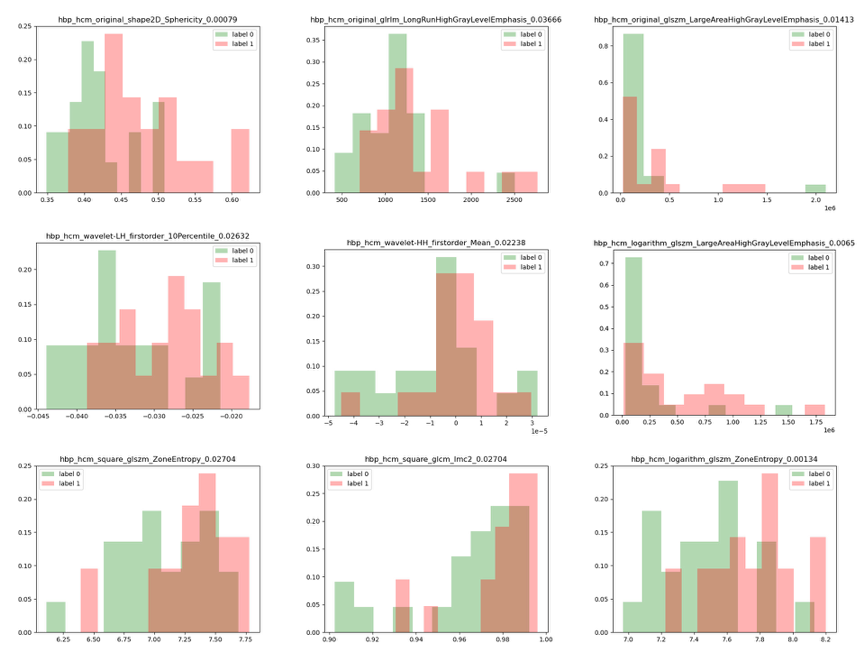
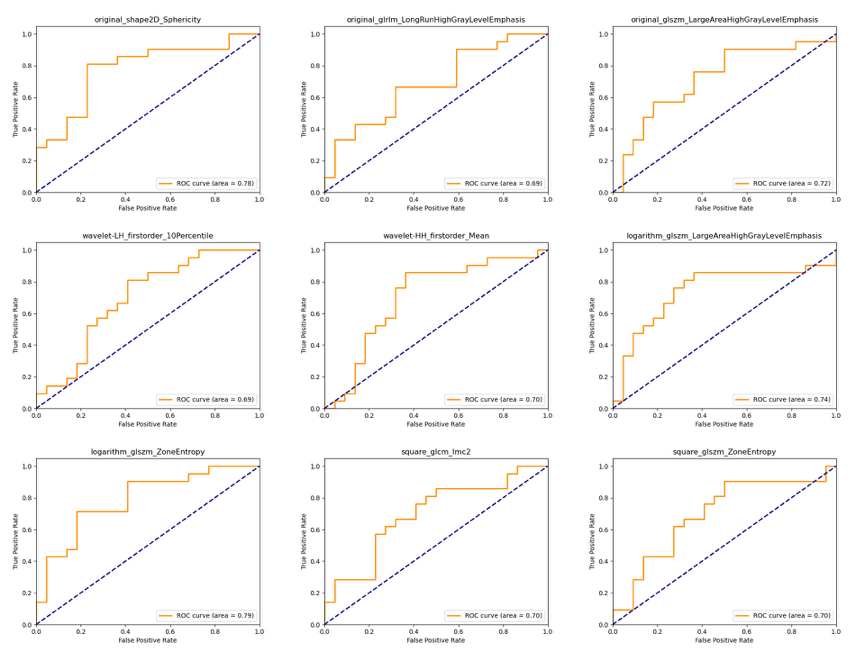
Patients with HHD and HCM were enrolled from September 2020 to April 2021 in this study. CMR images were obtained by a 3.0T system (Ingenia CX, Philips Healthcare, the Netherlands) with 32-channel abdomen coil. Modified Look-Locker inversion recovery (MOLLI) sequence with a short-axis stack covering the base, mid-ventricular and apex level were performed and detailed scanning parameters of T1 mapping were as follows, repetition time (TR) / echo time (TE) = 3.3 / 1.6 ms, field of view (FOV) = 300 × 300 mm2, voxel = 2 × 2 × 2.5 mm, flip angle = 20°, no slice gap. CVI software (cvi42, Circle Cardiovascular Imaging Inc., Calgary, Alberta, Canada) was used for the post-processing of T1 mapping images. The thickest section of left ventricular (LV) wall was chosen in HCM patients and mid-ventricular segment was chosen in HHD patients. LV epicardial and endocardial borders were delineated on T1 mapping using ITK-SNAP software (version 3.8.0, US) by an experienced radiologist (with three years of experience) (Figure 2).Types of images used in this study were as follows: original, wavelet, logarithm and square. TA features were calculated by using Pyradiomics, an open-source python package. Seven subsets of features were acquired including First Order Statistics, Shape-based (2D), Gray Level Cooccurence Matrix (glcm), Gray Level Run Length Matrix (glrlm) and Gray Level Size Zone Matrix (glszm), Neighbouring Gray Tone Difference Matrix (ngtdm) and Gray Level Dependence Matrix (gldm). Independent t-test or Manne-Whitney U test was used to compare between two groups. Histograms were used to visualize different TA features for distinguishing these two diseases. Receiver-operating characteristic (ROC) curves were used to evaluate the diagnostic efficiency and Delong’s test was calculated to compare AUCs among groups.Results
Twenty-three patients with HHD (50.65 ± 16.62 years; 82.6 % men) and twenty-one patients with HCM (54.10 ± 12.57 years; 71.4 % men) were enrolled in this study. Results showed that there were no significant differences in myocardial T1 value between the two groups (1288.5 ± 58.4 ms; 1281.9 ± 50.5 ms, P = 0.691). For all calculated TA features, AUCs of selected parameters had the values above 0.65 were as shown in Table 1. Logarithm_glszm_ZoneEntropy (AUC: 0.790, sensitivity: 71.4 %, specificity: 81.8 %, P < 0.01) showed slightly higher value than original_shape2D_Sphericity (AUC: 0.779, sensitivity: 81.0 %, specificity: 77.3 %, P < 0.01). Besides, the AUCs of original_glszm_LargeAreaHighGrayLevelEmphasis, wavelet-HH_firstorder_Mean and logarithm_glszm_LargeAreaHighGrayLevelEmphasis were 0.719 (sensitivity: 90.5 %, specificity: 50.0 %, P = 0.014), 0.703 (sensitivity: 85.7 %, specificity: 63.6 %, P = 0.022) and 0.742 (sensitivity: 85.7 %, specificity: 63.6 %, P < 0.01) respectively. Histograms and P values of extracted TA features were as shown in Figure 2. ROC curves of TA features were displayed in Figure 3.Discussion
This study showed that myocardial T1 values were not enough to distinguish between HCM and HHD, which is consistent with previous studies [1]. However, radiomics analysis of Logarithm_glszm_ZoneEntropy and original_shape2D_Sphericity showed better diagnostic efficiency in the presented study, which meant that the chaotic distribution of logarithmic transformed image in T1 space and the sphericity on original plane image are of great significance to distinguish the two diseases. These results may explain that in clinical diagnosis, Late gadolinium enhancement (LGE) performances of the two diseases are mostly different in CMR, which represent extent of myocardial fibrosis are not identical. That is, HCM tends to show patchy enhancement in middle layer of ventricular wall, enhancement of HHD tends to be diffuse and subtle. Therefore, TA features showed great potential in differentiation HCM and HHD, which represented their advantages of discovering hidden specific regional features. In the future, more studies of radiomic analysis on T1 mapping would be needed for further verification.Conclusion
Myocardial T1 values cannot distinguish between HCM and HHD, but TA features may become valuable diagnostic method.Acknowledgements
No acknowledgement.References
1. Shi, R.Y., et al., Texture analysis applied in T1 maps and extracellular volume obtained using cardiac MRI in the diagnosis of hypertrophic cardiomyopathy and hypertensive heart disease compared with normal controls.Clin Radiol, 2021. 76(3): p. 236 e9-236 e19.
2. Baxi, A.J., et al., Hypertrophic Cardiomyopathy from A to Z: Genetics, Pathophysiology, Imaging, and Management.Radiographics, 2016. 36(2): p. 335-54.
3. Wu, C.W., et al., Histogram Analysis of Native T1 Mapping and Its Relationship to Left Ventricular Late Gadolinium Enhancement, Hypertrophy, and Segmental Myocardial Mechanics in Patients With Hypertrophic Cardiomyopathy.J Magn Reson Imaging, 2019. 49(3): p. 668-677.
4. Wu, L.M., et al., Hypertrophic cardiomyopathy and left ventricular hypertrophy in hypertensive heart disease with mildly reduced or preserved ejection fraction: insight from altered mechanics and native T1 mapping.Clin Radiol, 2017. 72(10): p. 835-843.
5. Lambin, P., et al., Radiomics: the bridge between medical imaging and personalized medicine.Nature reviews. Clinical oncology, 2017. 14(12): p. 749-762.
6. Haaf, P., et al., Cardiac T1 Mapping and Extracellular Volume (ECV) in clinical practice: a comprehensive review.J Cardiovasc Magn Reson, 2016. 18(1): p. 89.
7. Wang, Q., et al., Feasibility of T1 mapping with histogram analysis for the diagnosis and staging of liver fibrosis: Preclinical results.Magn Reson Imaging, 2021. 76: p. 79-86.
Figures