4156
Assessment of myocardial involvement in patients with Fabry disease using metabolic imaging by 1H-MR Spectroscopy (1H-MRS)
Masaru Shiotani1, Yoshiaki Morita1, Yoshito Ichiba2, Yasuhiro Nagai1, Wataru Ueki1, Tatsuhiro Yamamoto1, Yasutoshi Ohta1, Keizo Murakawa1, and Tetsuya Fukuda1
1Department of Radiology, National Cerebral and Cardiovascular Center, Suita, Osaka, Japan, 2MR Research & CollaborationDpt. Diagnostic Imaging Division, Siemens Healthcare K.K., Shinagawa-ku, Tokyo, Japan
1Department of Radiology, National Cerebral and Cardiovascular Center, Suita, Osaka, Japan, 2MR Research & CollaborationDpt. Diagnostic Imaging Division, Siemens Healthcare K.K., Shinagawa-ku, Tokyo, Japan
Synopsis
The peak ratio of 3.5ppm to water in 1H-MRS of myocardium showed the higher values in Fabry disease and the association with native T1 values and regional function. 1H-MRS has a potential as disease-specific imaging biomarker for direct quantification of myocardial sphingolipid accumulation of Fabry disease.
INTRODUCTION
Fabry disease is characterized by a progressive deposition of sphingolipids (one of the glycolipid) in multiple organs caused by a deficiency of the enzyme alpha-galactosidase A and cardiac involvement is crucial for morbidity and mortality. Cardiac MRI have been recently used to assess the tissue characterization and cardiac function in Fabry disease, using late gadolinium enhancement (LGE), T1 mapping and cine MRI. 1,2 Metabolic imaging by 1H-MR Spectroscopy (1H-MRS) enable to assess the direct measurement of sphingolipid deposition3 and has a potential as a disease-specific imaging biomarker beyond the conventional MRI sequences. However, feasibility of 1H MRS for Fabry disease is still uncertain. This study aimed to assess the myocardial metabolic abnormality in patients with Fabry disease using 1H-MRS compared with the pre-contrast T1 values (=native T1) reflected by deposition of glycolipid and the myocardial strain as regional cardiac functional parameter.METHODS
Seven patients with Fabry disease (1 male, 6 females; mean age 44.3 ± 18.5 years) and 7 healthy volunteers (4 males, 3 females; mean age 61 ± 14.3 years) underwent cardiac MRI including 1H-MRS, cine MRI and T1 mapping (MOLLI method) on 3T machine (MAGNETOM® Vida, Siemens AG Healthcare Sector, Erlangen, Germany). 1H-MRS was obtained with a single voxel PRESS sequence with a single breath-hold (voxel size=10 × 10 × 20 mm3, TR of at least one heartbeat; TE = 33 msec, 8 averages, scan time = 21sec). The voxel was positioned within the interventricular septum on the four-chamber and short-axis images, thereby avoiding contamination by epicardial fat (Figure1a).The obtained 1H-MRS data were analyzed using the software provided with the instrument, and the peak ratios of 3.5 ppm (glycolipid peak3) and 0.9 ppm + 1.3 ppm (lipid peak) to 4.7 ppm (water peak) were used as metabolic indicators of myocardium (Figure1b). The each peak ratio was compared between Fabry disease patients and volunteers. Native T1 relaxation time obtained by MOLLI method and myocardial strain (circumferential and longitudinal) obtained by feature tracking method using cine images were also measured, and we assessed the correlation between the peak ratio and these parameters.RESULTS
Compared with the volunteer group, the glycolipid (3.5ppm) / water peak (4.7ppm) ratio in the Fabry group was significantly higher (Figure2a), and there was no significant difference in the glycolipid + lipid (3.5+0.9+1.3ppm) / later peak (4.7ppm) ratio and lipid (0.9+1.3ppm) / water (4.7ppm) peak ratio (Figure2b, c). The native T1 of the Fabry group was significantly shorter than that of the volunteer group. Figure-3 showed the correlation between native T1 and each peak ratio. The glycolipid (3.5ppm) / water peak (4.7ppm) ratio showed a better negative correlation with native T1 (r=-0.484). In circumferential strain, glycolipid (3.5ppm) / water peak (4.7ppm) ratio showed weak positive correlation with peak strain values. In longitudinal strain, glycolipid + lipid (3.5+0.9+1.3ppm) / water peak (4.7ppm) ratio showed weak positive correlation with peak strain values.DISCUSSION
The results of this study indicated that the 3.5ppm peak of 1H-MRS was associated with abnormal myocardial accumulation in Fabry disease, whereas no significant difference between in lipid (0.9+1.3ppm) peak in Fabry patients and healthy controls. Previous ex-vivo study showed 1H-MRS revealed the resonance of glycolipids at near 3.5ppm3, which is in accordance with our results. To our knowledge, this is the first study to assess the myocardial abnormal content in Fabry disease using 3.5ppm peak of 1H-MRS. Our proposed assessment using 3.5ppm spectral peak has a potential as non-invasive novel biomarker in direct quantification of abnormal glycolipids accumulation in Fabry disease, such as for the early cardiac involvement and the indication of enzyme replacement therapy.T1 mapping in cardiac MRI have been recently used to assess the Fabry disease as the shortening of native T1 value. In this study, 3.5ppm peak was better correlated with native T1 compared to lipid peak (3.5+0.9+1.3ppm), suggesting short T1 were attributed to glycolipid accumulation in Fabry disease. T1 mapping have a problem of the measurement variation due to other tissue characterization (fibrosis, fat, iron and so on) and influencing factors (heart rate, sequence design, misregistration and so on)4. We considered that 1H-MRS enable more accurate and early detection of the specific proton resonance including sphingolipids components.In this study, the 3.5ppm peak ratio showed negative but weak correlation with strain value. Myocardial dysfunction may be attributed to other myocardial damage (such as fibrosis) not only to glycolipids deposition.Future work will focus on the clinical performance of 1H-MRS such as the comparison with endomyocardial biopsy, monitoring of the therapeutic effect, andCONCLUSION
The peak ratio of 3.5ppm to water in 1H-MRS showed the higher values in Fabry disease and the association with myocardial native T1 relaxation time and regional function. 1H-MRS has a potential as disease-specific imaging biomarker for direct quantification of myocardial sphingolipid accumulation of Fabry disease.Acknowledgements
No acknowledgement found.References
- Xinying Hong, Michael H. Gelb. One-step synthesis of carbon-13-labeled globotriaosylsphingosine (lyso-GB3), an internal standard for biomarker analysis of Fabry disease. Mol Genet Metab. Author manuscript; available in PMC 2019 November 01.
- Roller FC et al. Assessment of Cardiac Involvement in Fabry Disease (FD) with Native T1 Mapping. Fortschr Röntgenstr 2019; 191: 932–939.
- B. Petritsch, H. Köstler, et al. Myocardial lipid content in Fabry disease: a combined 1H-MR spectroscopy and MR imaging study at 3 Tesla. BMC Cardiovascular Disorders (2016) 16:205 DOI 10.1186/s12872-016-0382-4.
- Peter Kellman, et al. T1 mapping in the heart: accuracy and precision. Journal of Cardiovascular Magnetic Resonance 2014, 16:2
Figures
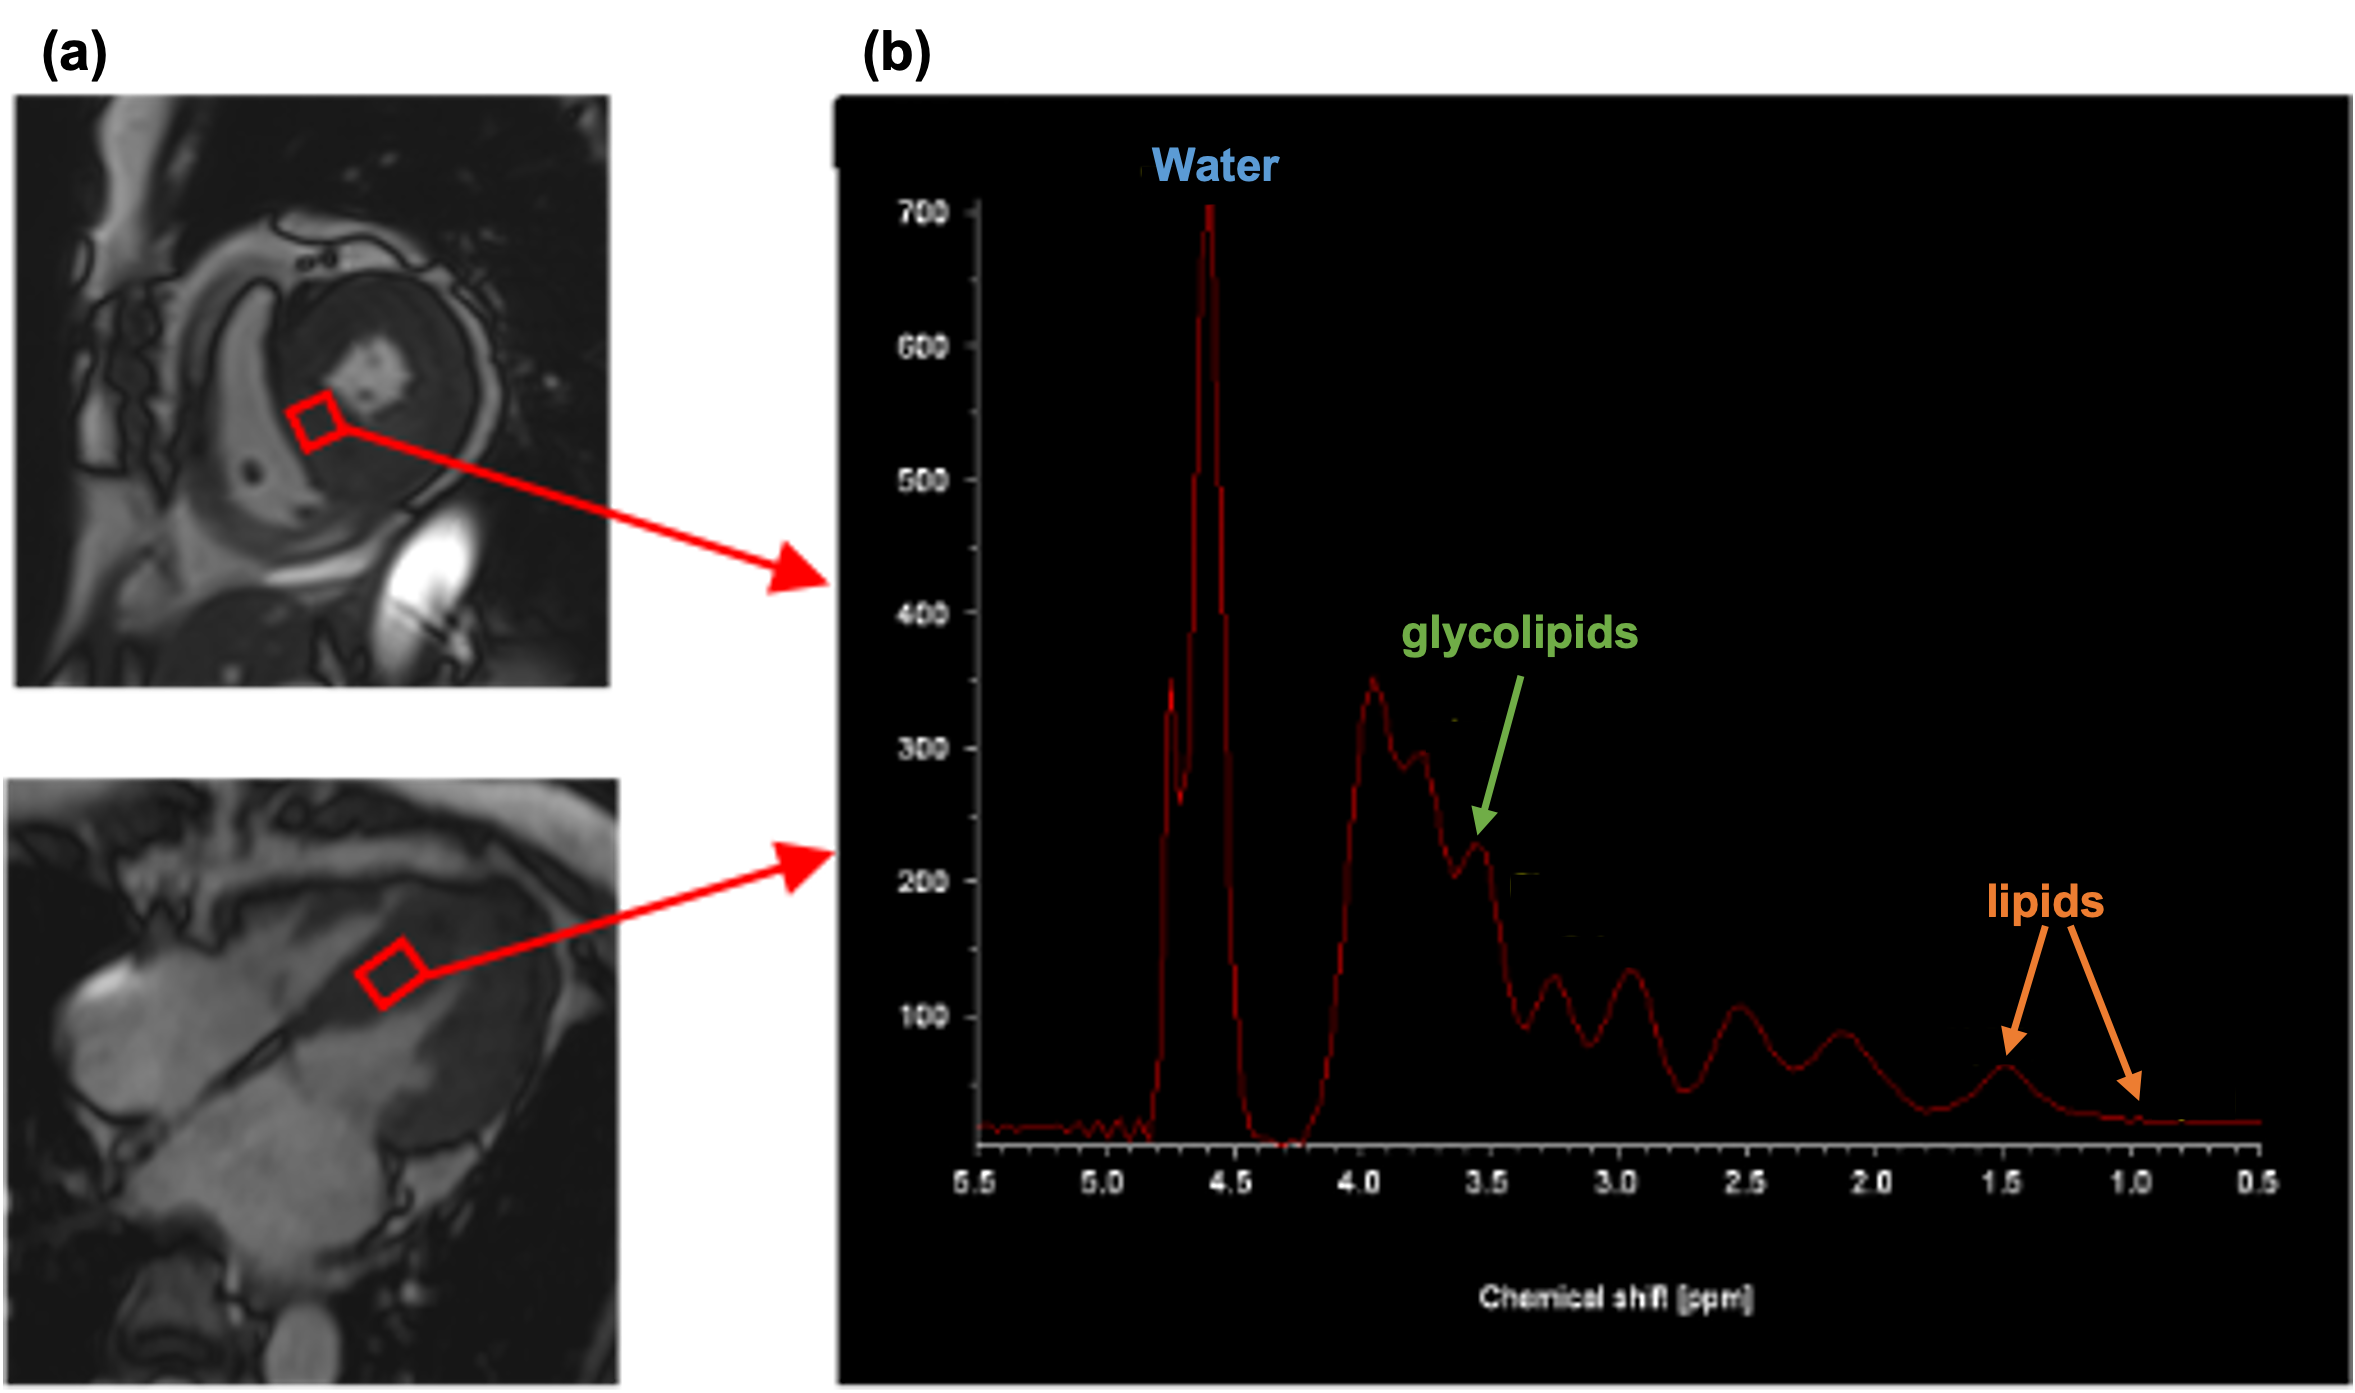
Representative spectrum of 1H-MR Spectroscopy in patients with Fabry disease:4.7 ppm (water peak), 0.9 ppm + 1.3 ppm (lipid peak) and 3.5 ppm (glycolipid peak).
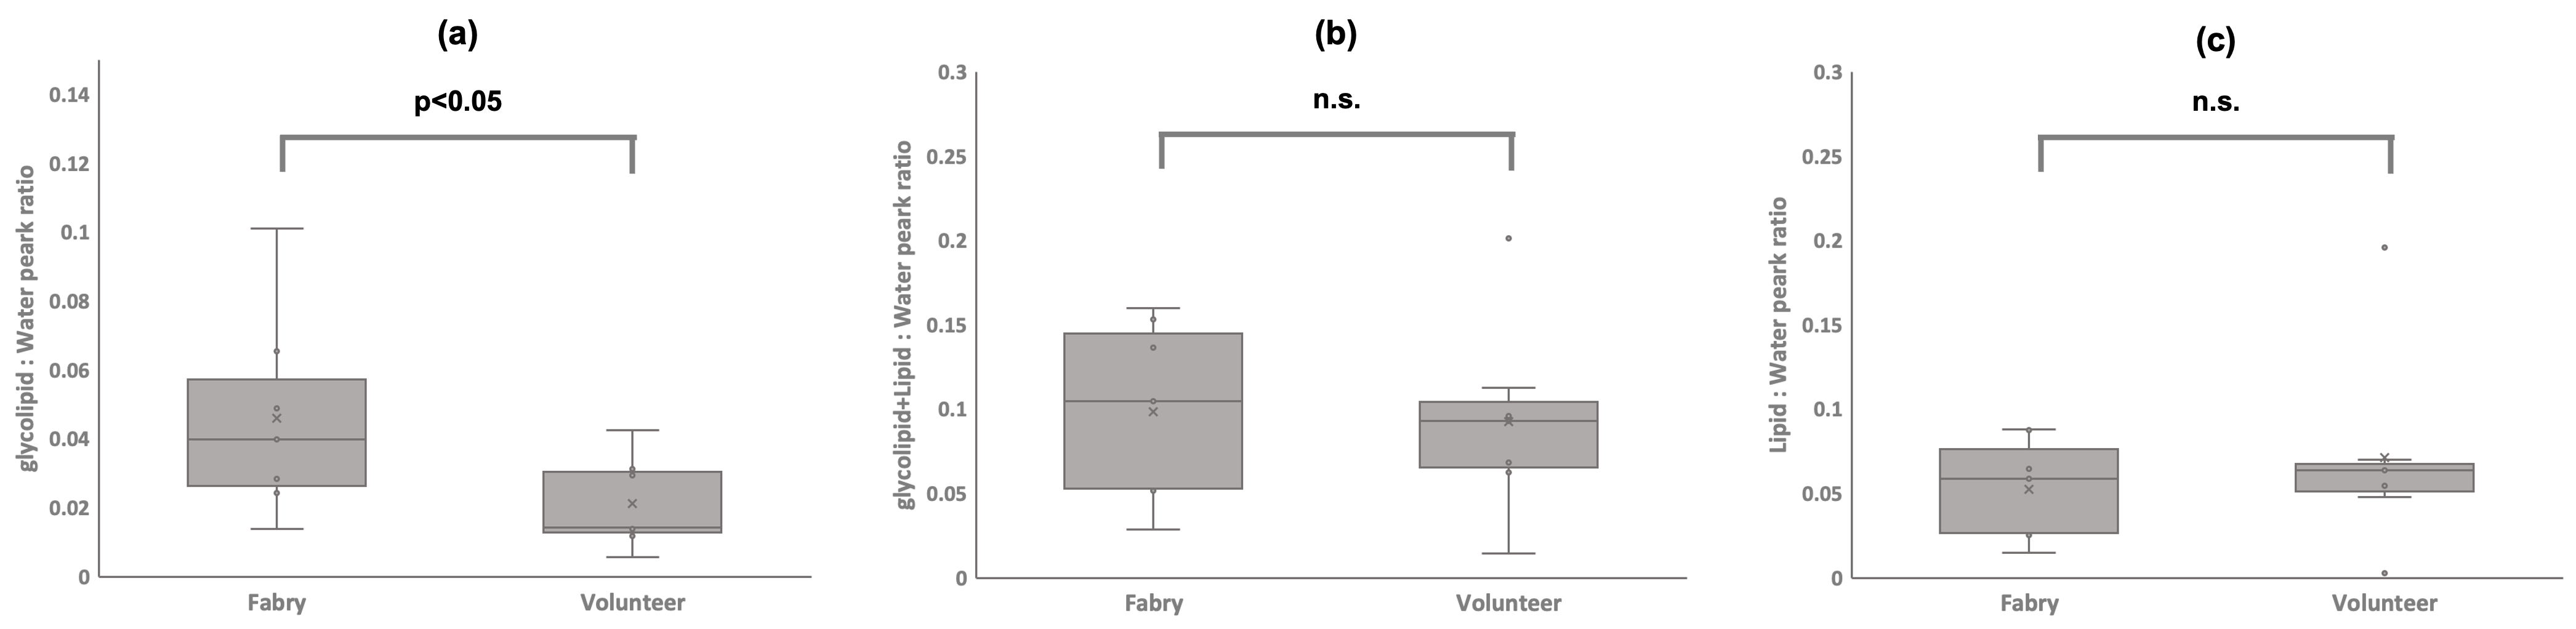
Comparison of (a)glycolipid / water peak ratio, (b) glycolipid + lipid / water peak ratio, (c) lipid / water peak ratio between Fabry and volunteer group.

Correlation between Native T1 and each peak ratio (glycolipid/water, glycolipid + lipid/water and lipid/water).
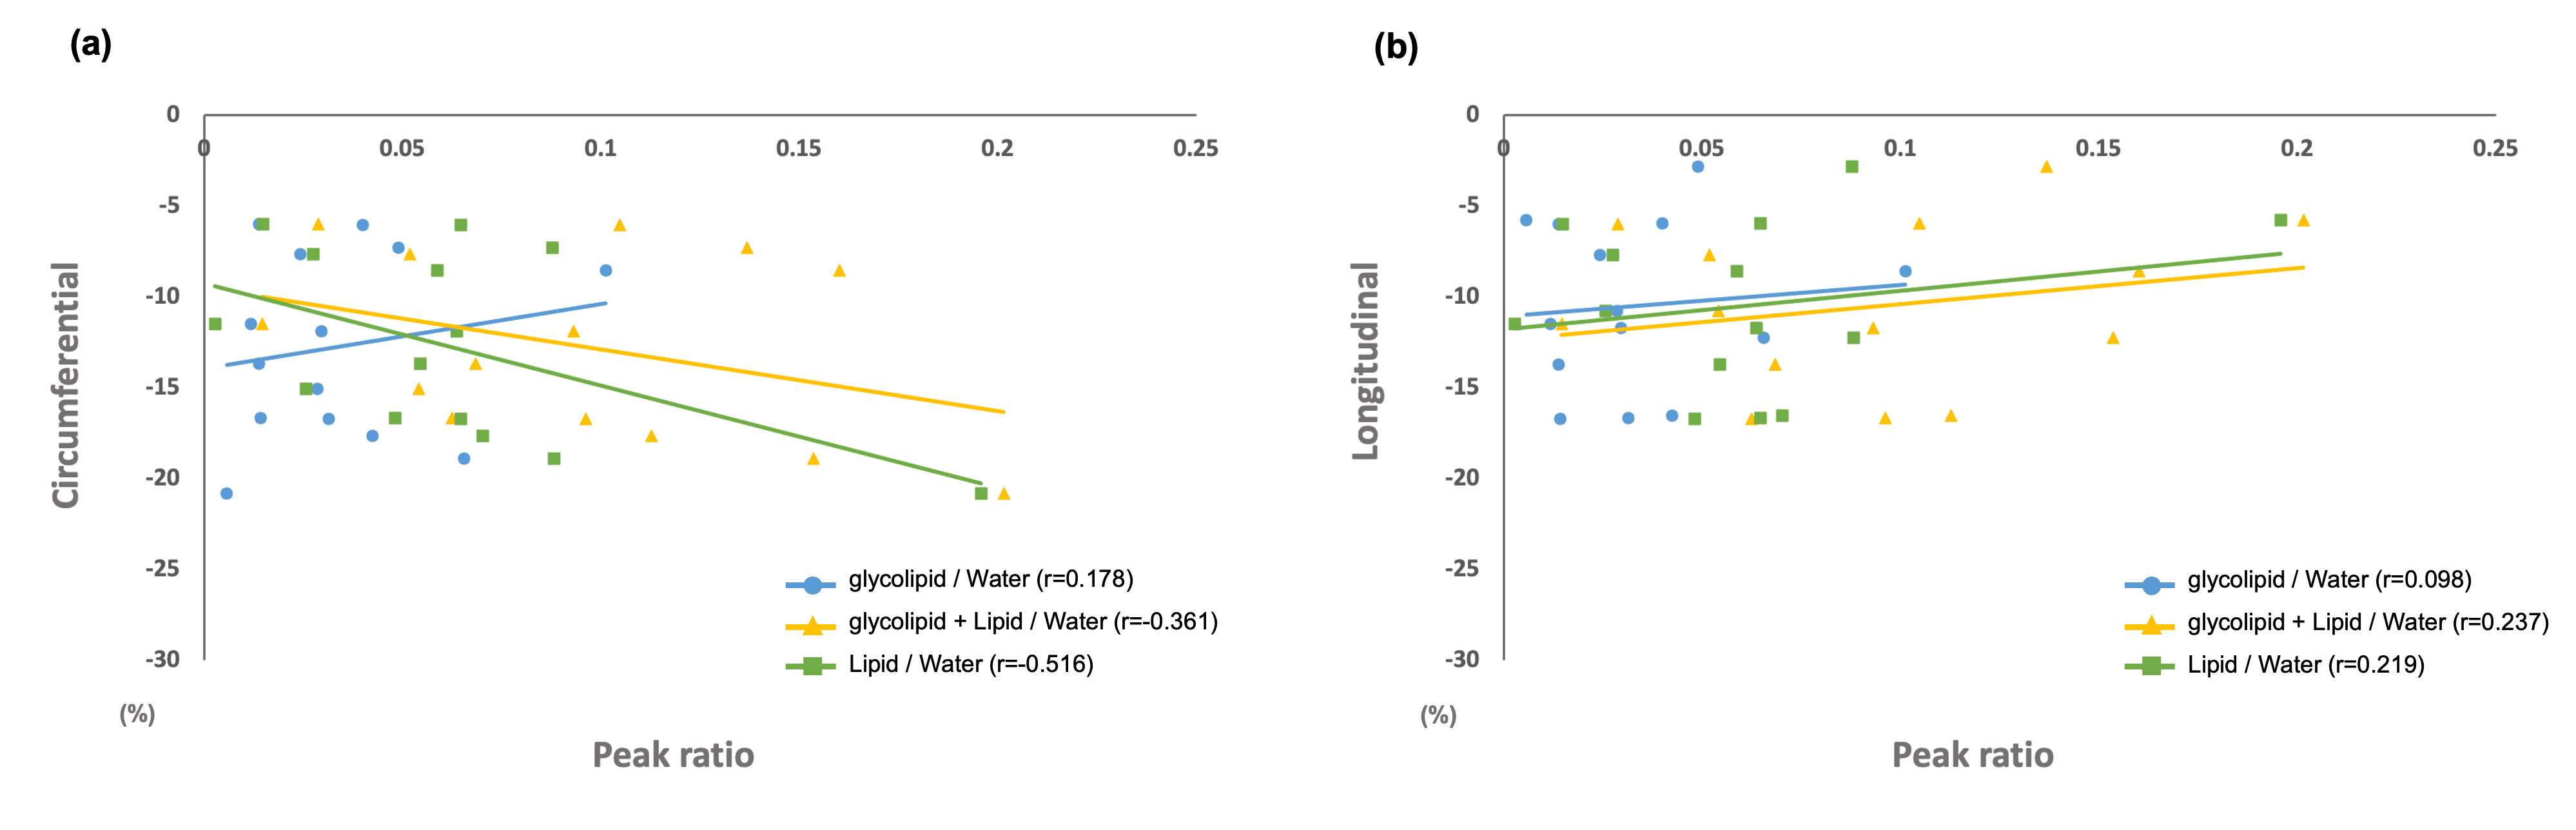
Correlation between peak strain (a. circumferential, b. longitudinal) and each peak ratio (glycolipid/water, glycolipid + lipid/water and lipid/water).

Representative cases of Fabry disease and volunteer: In Fabry disease,1H-MRS in septal wall detected the higher peak ratio of glycolipid / Water, and short native T1 and reduced strain value were also shown. In volunteer, 1H-MRS showed the lower peak ratio of glycolipid / water, and normal native T1 and strain values were shown.
DOI: https://doi.org/10.58530/2022/4156