4153
Application of Electric Properties Tomography to Ischemic Stroke: Comparison of Conductivity between Infarct and Contralateral Brain1Department of Artificial Intelligence Convergence, Chonnam National University, Gwangju, Korea, Republic of, 2Department of Biomedical Science, Chonnam National University, Gwangju, Korea, Republic of, 3Philips Korea, Seoul, Korea, Republic of, 4Philips Research Laboratories, Hamburg, Germany, 5Department of Radiology, Chonnam National University, Gwangju, Korea, Republic of
Synopsis
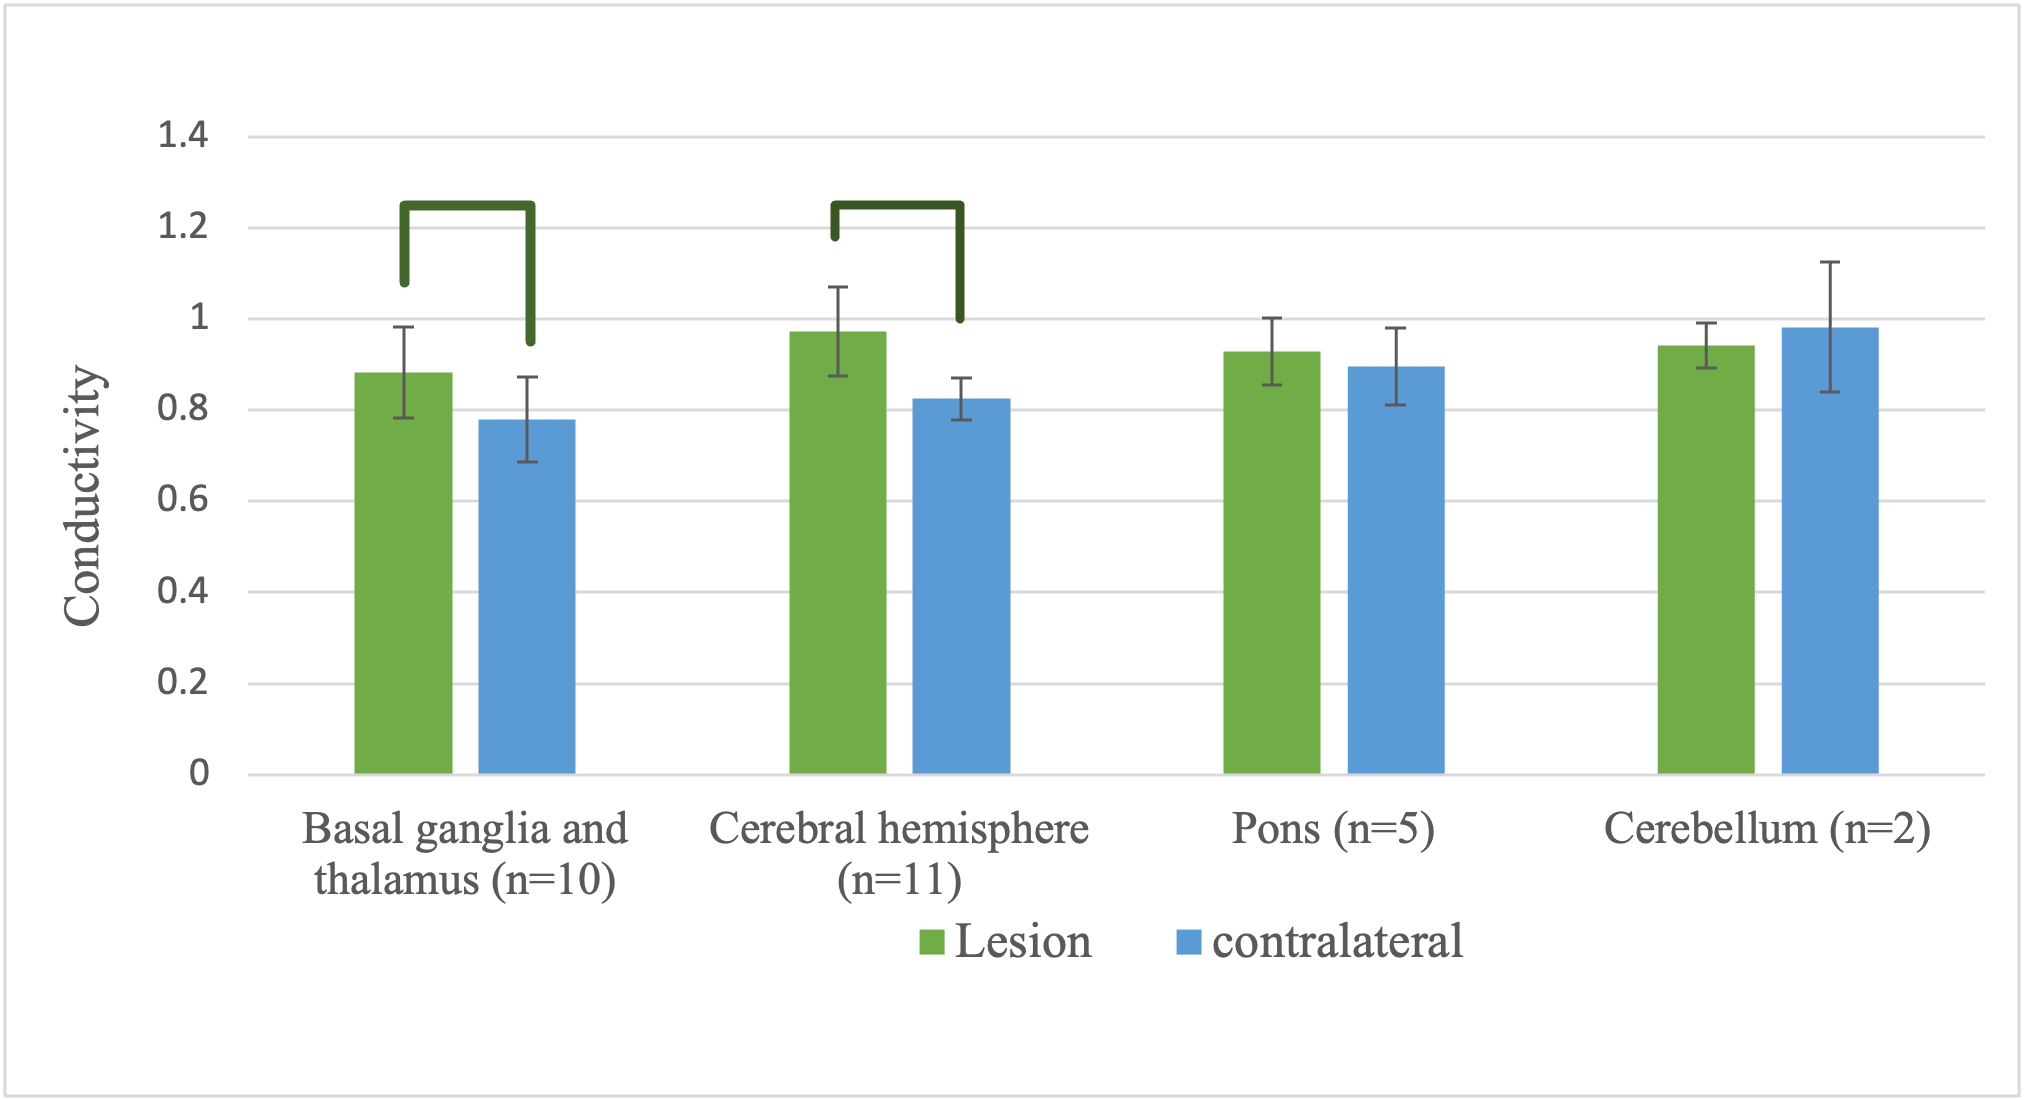
We demonstrate the feasibility of obtaining conductivity using EPT from patients with stroke. The ischemic lesion exhibited significantly higher conductivity values than the contralateral brain tissue in the cerebral brain, while the pons and cerebellum showed similar levels of conductivity values between the ischemic lesion and the contralateral brain tissue. The levels of conductivity value appeared to be specific to regions. The infratentorial normal brain exhibited a significantly higher level of conductivity than the supratentorial brain. In addition, the levels of conductivity were significantly different between the ischemic lesions of basal ganglia & thalamus and cerebral hemisphere.
INTRODUCTION
Ischemic stroke is one of the most important causes of neurological morbidity and mortality in the world and remains to be the leading cause of death and disability [1]. Electrical Properties Tomography (EPT) is a new MRI technique that delivers information on tissue electrical properties [2]. Previous studies explored the feasibility of EPT for tumor imaging [3]. The aim of this study was to measure the conductivity values in infarct lesions and compare them to the contralateral normal brain tissue from patients with ischemic stroke. To our knowledge, this was the first effort in applying EPT to stroke patients.METHOD
Twenty-seven patients who presented with acute stroke at a tertiary stroke center were included in this study. The patients consisted of 19 adult males (mean age, 73; range 54-84) and 8 adult females (mean age, 76; range 68-90). The EPT data were acquired using a balanced-Fast Field Echo (b-FFE) sequence (TR/TE = 3/1.62 ms, flip angle=30°, pixel size=1.15×1.15×2 mm) from a clinical 3T scanner (Philips, Netherlands, Amsterdam). The mean time from stroke onset to the EPT scan was 102 hours (range, 19 – 193 hr). The EPT data were reconstructed using the previously described method [4]. The conductivity (σ) map was quantified and created using EXPRESS 2.0 (EXtended Philips REsearch Software Solution).The entire data were categorized into four groups depending on the location of ischemic lesion: basal ganglia & thalamus (n=10), cerebral hemisphere (n=11), pons (n=5), and cerebellum (n=2). A total of 28 ROIs for the ischemic lesion and their corresponding contralateral normal brain tissue were drawn from 27 patients. The mean and standard deviation of conductivity were calculated from the ROIs and compared between the lesion and the contralateral brain tissue using a paired t-test. The conductivity values in the lesion and contralateral brain were compared between different groups using an unpaired t-test.
RESULTS and DISCUSSION
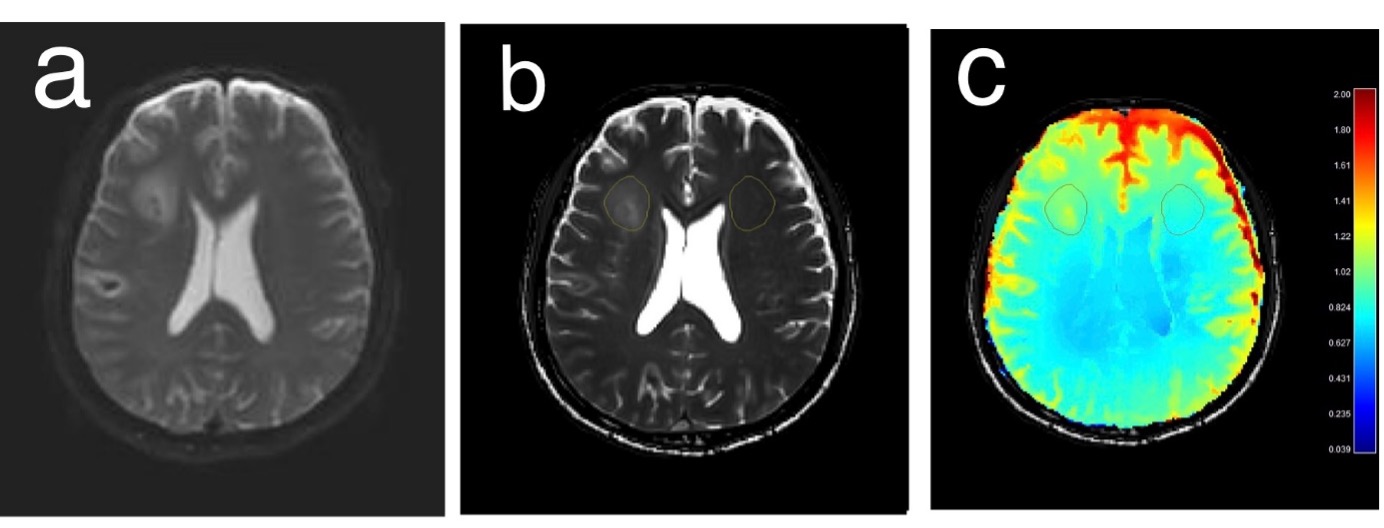
For the entire dataset, the ischemic lesion demonstrated a significantly higher mean conductivity value (0.93 ± 0.097 S/m) than the contralateral brain tissue (0.83 ± 0.095 S/m, p=0.00004). This pattern, however, was specific to the location of the infarct. Both basal ganglia & thalamus and cerebral hemisphere demonstrated significantly higher levels of conductivity (0.88 ± 0.1 S/m and 0.97 ± 0.097 S/m, respectively) than their corresponding contralateral normal brain tissues (0.78 ± 0.093 S/m, p=0.00009 for basal ganglia & thalamus and 0.83 ± 0.046 S/m, p=0.0008 for cerebral hemisphere, respectively). In contrast, the mean conductivity values were comparable between the lesion and the contralateral brain tissue in pons and cerebellum. The mean conductivity values for the lesion and the contralateral brain tissue in each region of the brain are shown in Figure 1.Figure 2 shows DWI, b-FFE images and the corresponding conductivity map from a 54-year-old male who had ischemic stroke in cerebral hemisphere. The infarct lesion demonstrated a higher conductivity value compared to the contralateral brain tissue. A 73-year-old male with ischemic infarction in cerebellum is shown in figure 3. The lesion exhibited a lower conductivity value compared to the contralateral brain tissue.
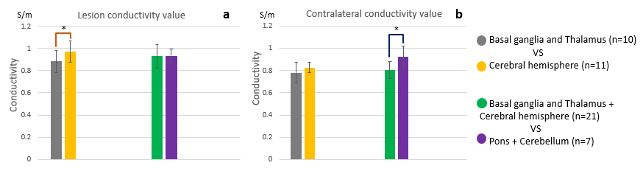
Figure 4 shows the comparison of conductivity value between different parts of the brain. The mean conductivity values between basal ganglia & thalamus and cerebral hemisphere were significantly different (p=0.05), while the level of conductivity in pons and cerebellum were similar to those in basal ganglia & thalamus, cerebral hemisphere, and the combined region of these two locations (Fig 4a). Interestingly, the levels of conductivity were significantly different between the contralateral normal tissue of supra- and infra-tentorial brains. The mean conductivity in the contralateral brain tissue of the combined basal ganglia & thalamus and cerebral hemisphere (0.80 ± 0.07 S/m) were significantly lower than that of combined pons and cerebellum (0.92 ± 0.1 S/m, p=0.003).
CONCLUSION
We demonstrate the feasibility of obtaining conductivity using EPT from patients with stroke. The comparison of conductivity values in different parts of the brain revealed that the ischemic lesion exhibited significantly higher conductivity values than the contralateral brain tissue in the cerebral brain, while the pons and cerebellum showed similar levels of conductivity values between the ischemic lesion and the contralateral brain tissue. The levels of conductivity value appeared to be specific to regions. The infratentorial normal brain exhibited a significantly higher level of conductivity than the supratentorial brain. In addition, the levels of conductivity were significantly different between the ischemic lesions of basal ganglia & thalamus and cerebral hemisphere. The results from this study warrant further investigation of this method with the broader range of patients with stroke.Acknowledgements
This study was supported by the Ministry of Education, Republic of Korea (2019R1I1A3A01059201).References
1. Maida CD, Norrito RL, Daidone M, Tuttolomondo A, Pinto A. Neuroinflammatory Mechanisms in Ischemic Stroke: Focus on Cardioembolic Stroke, Background, and Therapeutic Approaches. Int J Mol Sci. 2020;21(18).
2. Voigt T, Katscher U, Doessel O. Quantitative conductivity and permittivity imaging of the human brain using electric properties tomography. Magn Reson Med. 2011 Aug;66(2):456-66.
3. Katscher U, van den Berg CAT. Electric properties tomography: Biochemical, physical and technical background, evaluation and clinical applications. NMR Biomed. 2017;30(8).
4. Liu J, Wang Y, Katscher U, He B. Electrical Properties Tomography Based on B1 Maps in MRI: Principles, Applications, and Challenges. IEEE Trans Biomed Eng. 2017;64(11):2515-30.
Figures