4145
Rapid high-resolution mapping of cerebral blood flow and volume by dynamic BOLD MRI with transient hypoxia in mice1Center for Neuroscience Imaging Research, Institute for Basic Science, Suwon, Korea, Republic of
Synopsis
Noninvasive perfusion mapping is important to determine perfusion changes due to molecular and neuropathological modifications as well as pharmaceutical interventions. Here, we adopted a dynamic BOLD-MRI method for quantifying whole brain perfusion, such as cerebral blood volume (CBV) and cerebral blood flow (CBF) without the use of exogenous contrast agents in mice. High-resolution perfusion maps allow us to determine regional perfusion values and cortical depth-dependency. The proposed technique is non-invasive and repeatable with every <1 min temporal resolution and can combine with evoked fMRI studies for determining a neural activity-induced quantitative change of perfusion parameters.
INTRODUCTION
Perfusion is a critical physiological parameter, thus noninvasive measurement is important to determine perfusion changes due to molecular and neuropathological modifications as well as pharmaceutical interventions. Recently, a transient hypoxia paradigm has been proposed as a deoxygenation-based cerebral perfusion mapping method by delivering a bolus of paramagnetic deoxygenated hemoglobin to the cerebral vasculature in human1,2. Here, we adopted a blood oxygenation level dependent (BOLD) MRI approach with transient hypoxia in mice (see a submitted ISMRM abstract for optimization of stimulus; Le et al.). We determined cerebral blood volume (CBV) and cerebral blood flow (CBF) of mice on a region-by-region and voxel-by-voxel basis3. High-resolution mapping allows us to examine depth-dependency or hippocampal subfields in a detail. Potential applications of this technique include research on brain tumor and stroke where conventional perfusion MRI is widely used, and furthermore, research on functional MRI.METHODS
Animal preparationWild type male mice (C57BL/6, 25‒34 g, ages 2-5 months old, n=15) was prepared under intraperitoneal ketamine and xylazine anesthesia. Mice physiology was controlled by monitoring heart rates, respiration rates, rectal temperature, and SpO2.
Data acquisition
BOLD-MRI was performed on 9.4T/30 cm Bruker scanner. GE-EPI sequence: TR/TE = 1000/11ms, 20 slices without gap, FA = 50°, spatial resolution: 156×156×500 µm3. 7:3 air:O2 mixture was used for a baseline condition. Transient hypoxic gas stimulus (100% N2, 5-second) was applied for perfusion mapping.
Perfusion analysis
Since the change in deoxyhemoglobin concentration is directly related to $$$\triangle R_2^*$$$, $$$C\left(t\right)$$$ is simply denoted to $$$\triangle R_2^*$$$. Then, $$C\left(t\right)=\triangle R_2^*=\frac{1}{k}\cdot CBF\cdot (C_a\left(t\right)\otimes R\left(t\right))\quad\quad[1]$$ where $$$C_a\left(t\right)$$$ is the arterial input function (AIF); $$$R\left(t\right)$$$ is the tissue residue function; ⊗ indicates the convolution operation; and $$$k$$$ depends on the brain tissue density (1.04 g tissue/ml volume)4 and the hematocrit level difference between tissue blood and systemic arterial blood (Hcttissue/Hctartery=0.8)5,6. CBV (unit of ml blood/g tissue) can be quantified from the area under the $$$\triangle R_2^*$$$ curve and the integration of AIF as $$CBV=\frac{1}{k}(\frac{\int_{}^{}C(t)dt}{\int_{}^{}C_a(t)dt})\quad\quad[2]$$CBF was obtained using Eq. 1 by deconvoluting the measured tissue concentration time curve with AIF using a singular value decomposition (SVD) method3.
Determination of perfusion parameters
In each animal, perfusion values were determined on a voxel-by-voxel basis. The voxel-wise mean CBV and CBF maps were generated, and the perfusion maps were co-registered with the high resolution T2-weighed reference image. ROIs were selected based on the Allen mouse brain atlas and the mean perfusion value of each ROI was calculated. Cortical depth and structural analysis were performed on primary somatosensory cortex and hippocampus brain regions.
RESULTS
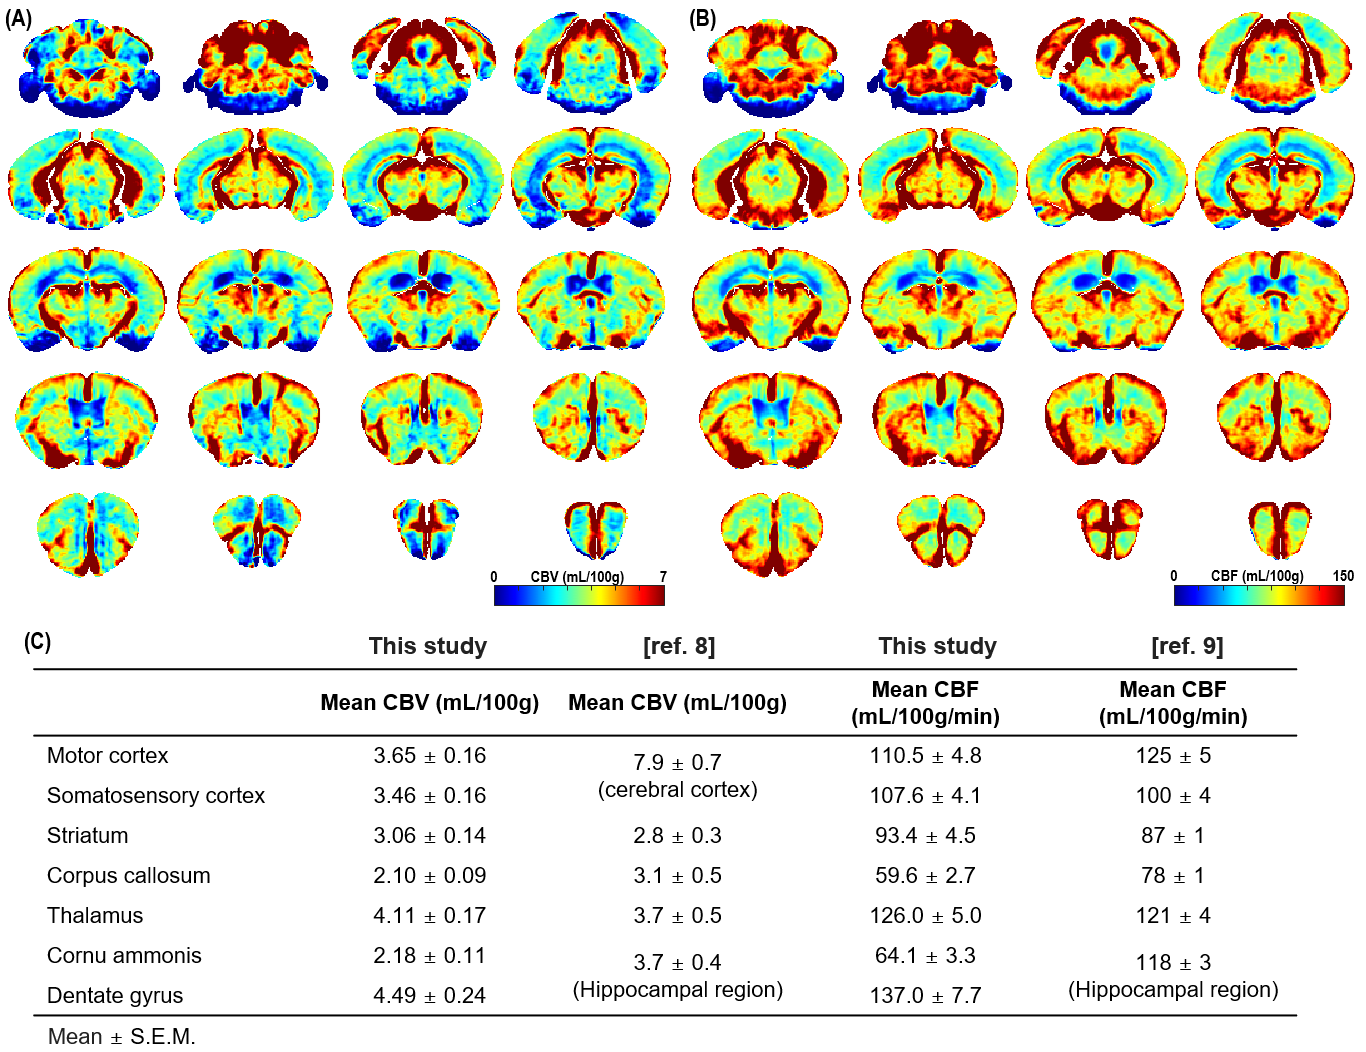
Voxel-wise mean perfusion maps of the fifteen mice (n=15) were generated as shown in Figure 1A,B. Differences in perfusion values in cortical, white matter, and hippocampal regions are clearly distinguished. In general, both CBV and CBF maps showed similar contrast. In both maps, the white matter corpus callosum showed low perfusion values (greenish color), while some brain regions had high perfusion values (red) possibly due to the high sensitivity of gradient-echo imaging to large vessels. The high-perfusion band around the thalamus resembles the large vasculature architecture identified from vasculature atlas7. To obtain a microvascular volume, SE EPI can be utilized with a cost of low TR and temporal resolution.Perfusion values from representative regions were quantified from 15 mice (Fig. 1C). The regional perfusion values determined from our data are in good agreement with perfusion values measured by micro-CT (CBV) and autoradiography (CBF) under K/X anesthesia 8,9. In the hippocampus, the CA region has much lower perfusion values compared to the dental gyrus (DG)10. The average perfusion value of CA and DG regions is similar to reported hippocampal perfusion value8,9.
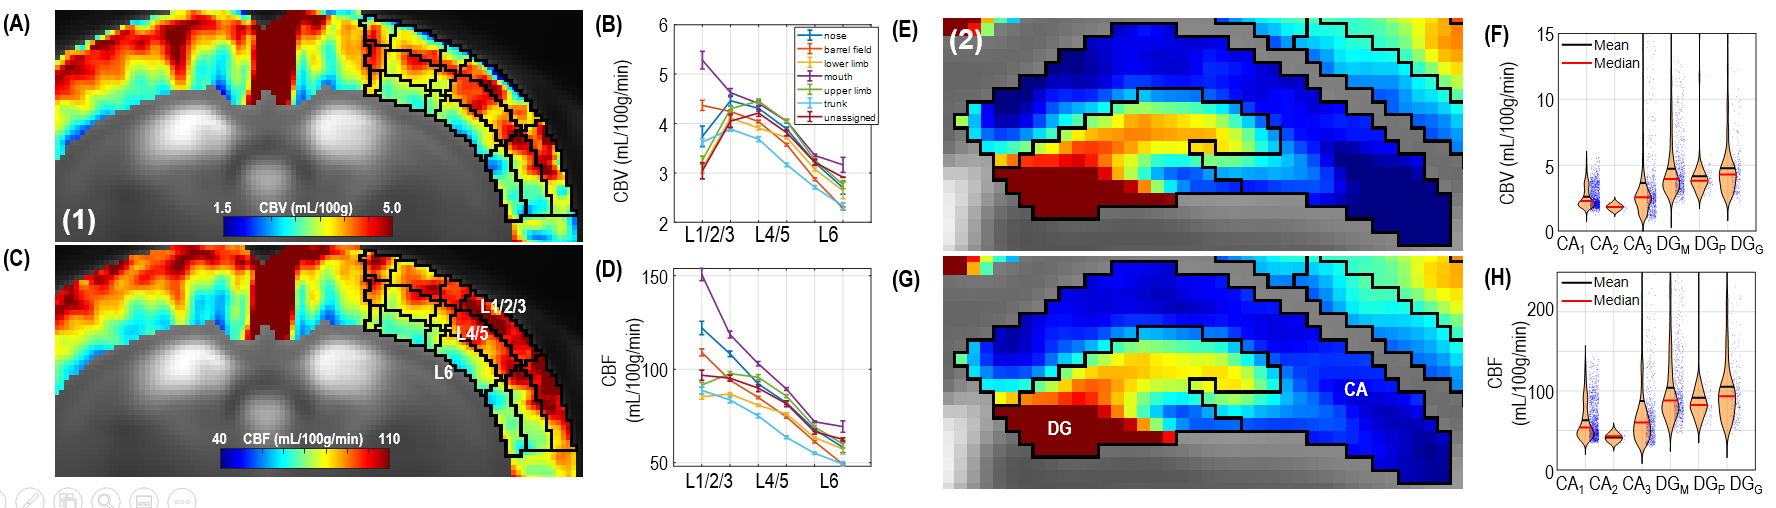
Cortical depth- and hippocampal subfield-dependent perfusion was examined (Figure 2). CBV and CBF values showed clear differences depending on the structure or layer. In the primary somatosensory cortex (S1) region, CBV showed the highest value in the middle layer, while CBF showed the highest value in the top layer. Both CBV and CBF values decrease gradually toward the deeper layer. In the hippocampal region, contrast due to large blood vessels near the dentate gyrus was clearly observed. Both CBV and CBF showed higher values in the dentate gyrus region compared to CA region. The high perfusion value in DG can be due to the contamination of microvasculature.
CONCLUSION
We demonstrated a BOLD-MRI method for quantifying the whole brain CBV and CBF without the use of exogenous contrast agent in mice. This technique is non-invasive and repeatable with every <1 min temporal resolution. In addition, this approach can combine with evoked fMRI studies for determining neural activity-induced quantitative change of perfusion parameters. As a future work, we plan to measure perfusion values of dysfunctional mouse brains (stroke and tumor) and of fMRI responses.Acknowledgements
No acknowledgement found.References
1. Ogawa, S., Lee, T. M., Kay, A. R., & Tank, D. W. (1990). Brain magnetic resonance imaging with contrast dependent on blood oxygenation. proceedings of the National Academy of Sciences, 87(24), 9868-9872.
2. Vu, C., Chai, Y., Coloigner, J., Nederveen, A. J., Borzage, M., Bush, A., & Wood, J. C. (2021). Quantitative perfusion mapping with induced transient hypoxia using BOLD MRI. Magnetic Resonance in Medicine, 85(1), 168-181.
3. Østergaard, L., et al. (1996). "High resolution measurement of cerebral blood flow using intravascular tracer bolus passages. Part I: Mathematical approach and statistical analysis." Magnetic Resonance in Medicine 36(5): 715-725.
4. Bothe, H.-W., et al. (1984). "Relationship between specific gravity, water content, and serum protein extravasation in various types of vasogenic brain edema." Acta neuropathologica 64(1): 37-42.
5. Cremer, J. E., & Seville, M. P. (1983). Regional brain blood flow, blood volume, and haematocrit values in the adult rat. Journal of cerebral blood flow & metabolism, 3(2), 254-256.
6. Levin, V. A., & Ausman, J. I. (1969). Relationship of peripheral venous hematocrit to brain hematocrit. Journal of applied physiology, 26(4), 433-437.
7. Xiong, B., Li, A., Lou, Y., Chen, S., Long, B., Peng, J., ... & Gong, H. (2017). Precise cerebral vascular atlas in stereotaxic coordinates of whole mouse brain. Frontiers in neuroanatomy, 11, 128.
8. Chugh, B. P., Lerch, J. P., Lisa, X. Y., Pienkowski, M., Harrison, R. V., Henkelman, R. M., & Sled, J. G. (2009). Measurement of cerebral blood volume in mouse brain regions using micro-computed tomography. Neuroimage, 47(4), 1312-1318.
9. LaRue, B., Hogg, E., Sagare, A., Jovanovic, S., Maness, L., Maurer, C., ... & Zlokovic, B. V. (2004). Method for measurement of the blood–brain barrier permeability in the perfused mouse brain: application to amyloid-β peptide in wild type and Alzheimer’s Tg2576 mice. Journal of neuroscience methods, 138(1-2), 233-242.
10. Zhang, X., et al. (2019). "High-resolution mapping of brain vasculature and its impairment in the hippocampus of Alzheimer's disease mice." National Science Review 6(6): 1223-1238.
Figures