4143
Non-Contrast Time-Resolved MR Angiography with Consecutive Beam Pulse with Variable Saturation Flip Angle1Department of Integrated Health Scieneces, Nagoya University Graduate School of Medicine, Nagoya, Japan, 2Department of Radiology, Nagoya City University Graduate School of Medical Sciences, Nagoya, Japan, 3Department of Radiology, Nagoya City University Hospital, Nagoya, Japan, 4FUJIFILM Healthcare Corp., Tokyo, Japan, 5Department of Radiology, Nagoya City University Graduate School of Medical Scieneces, Nagoya, Japan, 6Nagoya City University Hospital, Nagoya, Japan
Synopsis
To develop and validate the non-contrast time-resolved MR angiography (NC TR-MRA) with consecutive beam pulse with variable saturation flip angle method, we performed a phantom study using steady flow and the volunteer study targeted to the pulmonary artery. The length of visualized flow signals was exhibited proportional to the number of beam saturation pulses in the phantom study. In human study, the visualization range of the pulmonary artery was also extended with increasing the number of beam pulses. The novel consecutive beam pulse with variable saturation flip angle method can depict blood vessels in each flow phase.
Introduction
Time-resolved MR angiography (TR-MRA) using contrast agents helps diagnose recanalization of pulmonary arteriovenous malformation (PAVM) in patients undergone coil embolization1. However, the use of contrast agents increases the risk of a paradoxical embolism if recanalization is present. The TR-MRA without contrast agents may be a more appropriate method for a survey of recanalization and follow-up of the lesions that underwent coil embolization. To develop and validate the non-contrast TR-MRA (NC TR-MRA) with consecutive beam pulse with variable saturation flip angle method, we performed a phantom study using steady flow and the volunteer study targeted to the pulmonary artery.Methods
All studies were conducted on 3 T MRI (FUJIFILM Healthcare Corp.).Non-contrast time-resolved MR angiography
This sequence is based on the three-dimensional fast spin-echo sequence (FSE) with respiratory trigger (Figure 1a). The beam saturation pulses2 consecutively irradiate an upstream of blood flow at 20 ms interval. The saturated spins are recovered by the longitudinal relaxation during the time gap between the main scan and each pulse. It is needed to vary the flip angle of each beam saturation pulse according to the T1 value of venous blood and the time gap. The flip angle θFA of beam saturation pulse is determined by the time gap t and T1 value according to Equation 1.
$$$\theta_{FA}=\arccos(1-\frac{1}{\exp(\frac{-t}{T1})}) $$$ (1)
Increasing the number of beam saturation pulses extends the distance of the vessel that the blood signal vanishes. Since the scan without beam saturation pulse depicts all ranges of blood vessels, the NC TR-MRA at each flow phase is calculated by subtracting each scan with a varying number of beam saturation pulses from the scan without the saturation pulse (Fig. 1b).
Phantom study
The steady flow phantom consisted of the flow pump (Micro pump MC320, Newa, Italy) and polyvinyl chloride tube of 10-mm inside diameter shown in Figure 2. The T1 value of the flowing liquid was adjusted to 1615 ms to simulate venous blood3,4. Three different flow velocities were employed to simulate physiological pulmonary arterial blood flow based on previous literature5; 14.2, 26.2, and 34.6 cm/s. The number of beam saturation pulses was varied as 0, 5, 10, 15, 20, 25, and 30. The parameters of FSE sequence were the following: Field of view (FOV); 224 × 224 mm2, matrix size; 128 × 128, slice thickness; 3 mm, number of reconstruction slice; 140, effective TE; 4.2 ms, and TR; 4000 ms assuming an interval of respirations. We evaluated the line profiles along the flow direction and visualization range of flow signal of maximum intensity projection (MIP) in the NC TR-MRA at each flow phase.
Human study
A healthy volunteer (29 years old, male) was recruited to test a novel NC TR-MRA. The number of beam saturation pulses was varied as 0, 3, 6, 9, 15, and 24. The FSE sequence parameters were set in a similar fashion to the phantom study, excepting the FOV; 350 × 350 mm2, matrix size; 256 × 176, slice thickness; 4 mm, and the number of reconstruction slice; 110. To evaluate the change in signal intensity of MIP of original images at each flow phase, the ROIs were set on the right interlobar pulmonary artery and the proximal and distal portions of the right basal artery, as shown in Figure 5b.
Results
The representative MIPs of NC TR-MRA in the phantom study are shown in Figure 3. The length of visualized flow signals was exhibited proportional to the number of beam saturation pulses. The signal profiles along the flow direction were consistent with the visual findings (Figure 4a). The difference in flow velocity was also observed as the change in signal profiles under the fixed number of saturation pulses (Figure 4b). The MIPs of NC TR-MRA in the right pulmonary artery were shown in Figure 5a. The MIP of original images varying the number of saturation pulses demonstrated signal fading proximally as the number of pulses decreased. Many beam saturation pulses were needed to achieve sufficient signal suppression in the distal branch (Figure 5c).Discussion
The visualized range of steady flow in the phantom study was proportional to the number of beam saturation pulses. The depicted distances of the flow signals were excellently dependent on the flow velocities. The multiple beam saturation pulses with variable saturation flip angle allow effectively visualizing the chronological change in flow signal almost without the signal loss due to the longitudinal relaxation during the time gap. In the human study, the visualization range of the pulmonary artery was also extended with increasing the number of beam pulses but not in a proportional manner to the number of beam saturation pulses, because of a pulsatile flow in the pulmonary artery and the difference in flow velocity. The advantages of NC TR-MRA are that the repeatable examination can be performed because the contrast agents are not needed and that the temporal resolution of 20 ms is higher than that of the contrast-enhanced TR-MRA, which is around 1 s.Conclusion
The NC TR-MRA with beam saturation pulse may be applicable to the PAVM and help diagnose recanalization and follow-up in patients who underwent the coil embolization.Acknowledgements
No acknowledgement found.References
[1] Kawai T, Shimohira M, Kan H, et al. Feasibility of Time-Resolved MR Angiography for Detecting Recanalization of Pulmonary Arteriovenous Malformations Treated with embolization with Platinum Coils. J Vasc Interv Radiol 2014; 25(9): 1339-47.
[2] Nishihara T, Itagaki H, Moriwake C, et al. Selective TOF MRA Using Beam Saturation Pulse. Proc Intl Soc Mag Reason Med 2012; 20: 3698.
[3] Lu H, Clingman C, Golay X, et al. Determining the Longitudinal Relaxation Time (T1) of Blood at 3.0 T Tesla. Magn Reason Med 2004; 25: 679-682.
[4] Wu WC, Jain V, Li C, et al. In vivo Venous Blood T1 Measurement Using Inversion Recovery TrueFISP in Children and Adults. Magn Reason Med 2010; 64(4): 1140-1147.
[5] Wehrum T, Hagenlocher P, Lodemann T, et al. Age Dependence of Pulmonary Artery Blood Flow Measured By 4D Flow Cardiovascular Magnetic Resonance: Results of Population-based Study. J Cardiovasc Magn Reason 2016; 18(1): 3.
Figures

Figure 1 (a) Sequence overview of three-dimensional fast spin echo (FSE) with consecutive beam pulse varying saturation flip angle. The flip angle of beam saturation pulse is changed according to T1 value of venous blood and time gap between each pulse and main FSE scan.
(b) Calculation of non-contrast time-resolved MR angiography at each flow phase. It is calculated by subtracting scan with beam saturation pulse from scan without its pulse.

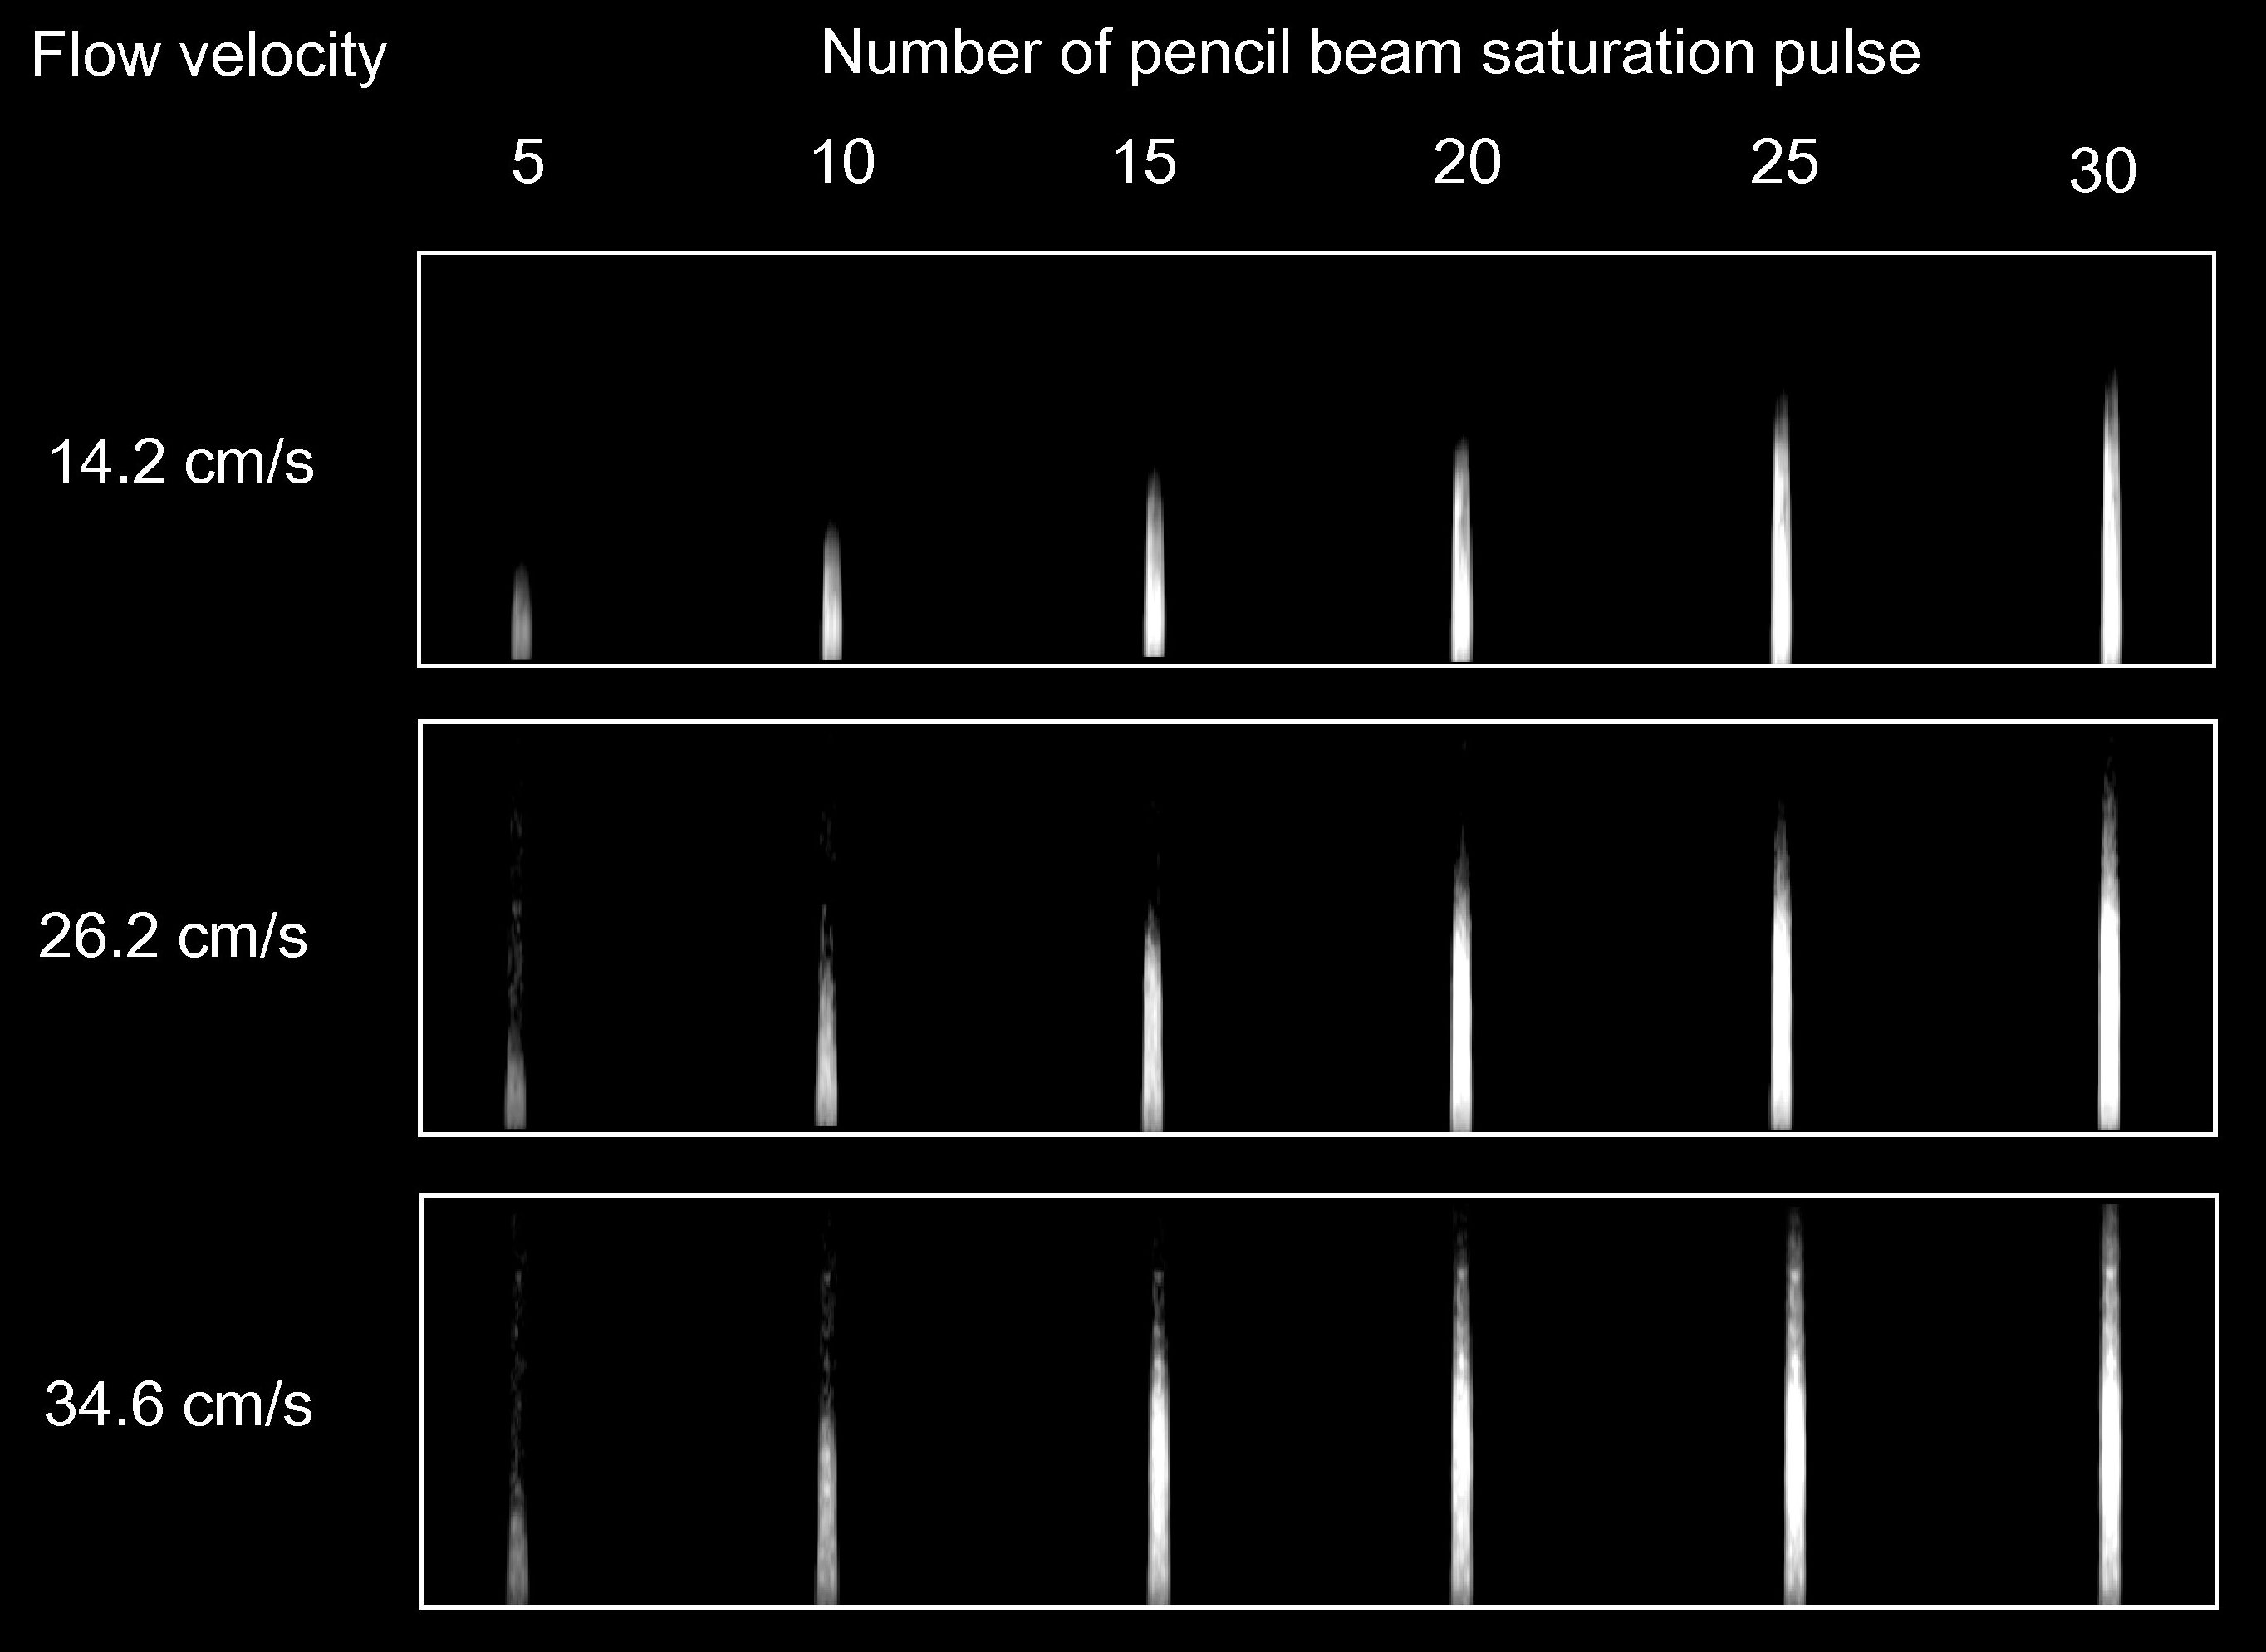
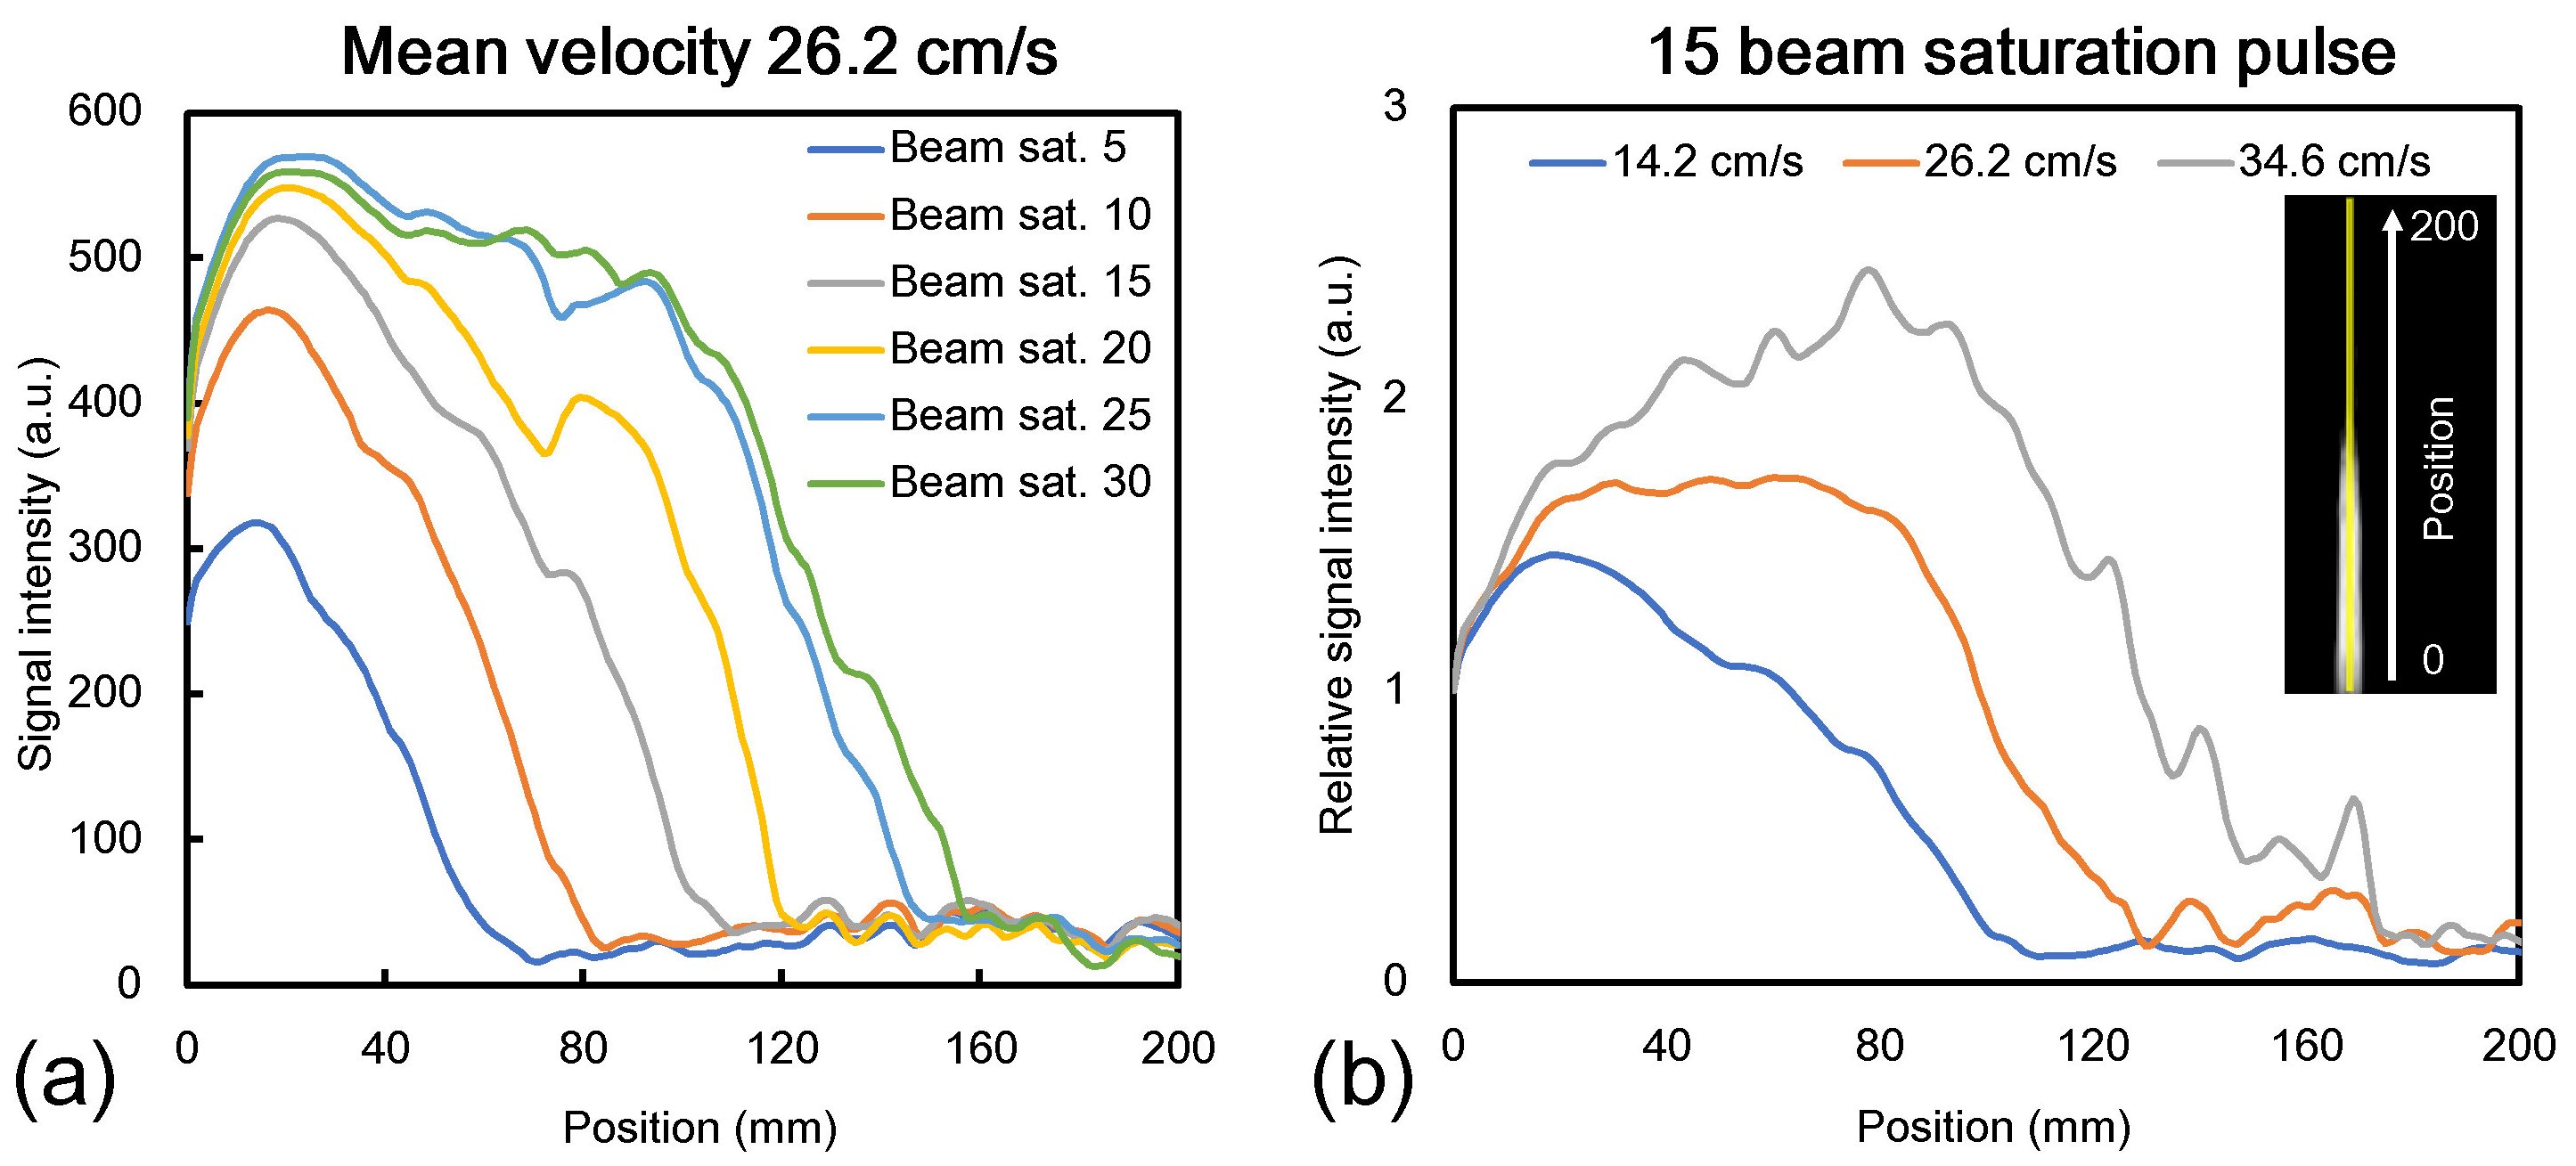
Figure 4 (a) Signal profiles along the flow direction in mean flow velocity of 26.2 cm/s with changing the number of beam saturation pulses in the maximum intensity projection (MIP) of non-contrast time-resolved MR angiography (NC TR-MRA).
(b) Line profiles of relative signal intensity in the images with beam saturation pulses of 15 times in the MIP of NC TR-MRA.

Figure 5 (a) Representative maximum intensity projections (MIPs) of non-contrast time-resolved MR angiography (NC TR-MRA) of the right pulmonary artery in a human study.
(b) ROI locations to evaluate the signal intensity in MIP of original image at each flow phase.
(c) Relationships between the number of beam saturation pulses and relative signal intensities in the ROI 1~3 in the MIP of the original image.