4141
Fast High-Resolution 3D MRSI and T2 Mapping for Clinical Outcome Prediction of Ischemic Stroke Patients1School of Biomedical Engineering, Shanghai Jiao Tong University, Shanghai, China, 2Radiology Department, The Fifth People's Hospital of Shanghai, Fudan University, Shanghai, China, 3Beckman Institute for Advanced Science and Technology, University of Illinois at Urbana-Champaign, Urbana, IL, United States, 4Department of Electrical and Computer Engineering, University of Illinois at Urbana-Champaign, Urbana, IL, United States, 5Department of Biomedical Engineering, Case Western Reserve University, Cleveland, OH, United States
Synopsis
Characterization of the underlying pathophysiological changes associated with edema progression is essential for treatment guidance in ischemic stroke. 1H-MRSI and quantitative T2 mapping can acquire image markers related to the physiological states of brain tissues. This study investigated the neurometabolite changes in relation to the development of vasogenic edema in ischemic stroke patients, using fast high-resolution 3D MRSI and T2 mapping techniques. Our results showed that neurometabolite concentrations were strongly correlated with T2 values within ischemic lesion of stroke patients and integrated T2 and neurometabolite biomarkers improved the prediction accuracy of stroke patients' clinical outcome.
Introduction
Development of cerebral edema significantly influences the degree of neurological deficits of ischemic stroke patients1. Characterization of the underlying pathophysiological changes associated with edema progression is essential for treatment guidance. Quantitative T2 value is directly related to tissue water uptake in ischemic tissue, which captures the vasogenic edema evolution in stroke2. Previous studies utilized cerebrospinal fluid measures to relate the biochemical changes to the development of ischemic edema3,4. But the neurometabolic changes within the brain ischemic area, which directly reflect the pathophysiological changes of edema tissue, were not understood. In this study, a high-resolution 3D MRSI technique, called SPICE (SPectroscopic Imaging by exploiting spatiospectral CorrElation)5-11, along with fast T2 mapping, was applied to investigate the relationship between changes in neurometabolite concentrations and the development of vasogenic edema within the lesion in ischemic stroke patients. The potential of using these multimodal biomarkers for the prediction of patients’ clinical outcomes was also evaluated.Methods
Fifty-three ischemic stroke patients were included in this study. Exclusion criteria included hemorrhage or non-stroke lesions on structural MRI, and contraindication for MRI. The patients were scanned at 2.25 to 199.50 hours after the onset of stroke symptom, with 24 patients receiving follow-up scans, thus yielding a total of 79 samples for analysis. This study was approved by the Institutional Review Board of the Fifth People’s Hospital of Shanghai, China. All participants or their designees provided written informed consents.All MR scans were performed on a 3.0T Siemens Skyra scanner. The data acquisition protocol included 3D MRSI scan using the SPICE sequence (TR/TE = 160/1.6 ms, resolution = 2.0×3.0×3.0 mm3, FOV = 240×240×72 mm3, scan time = 8 min), T2 mapping using the TSE sequence (TR/TE = 5030/[18,36,62] ms, resolution = 1.9×1.9×3.0 mm3, FOV = 240 mm, scan time = 1 min 20 sec), 3D MPRAGE imaging (TR/TE/TI = 2400/2.13/1100 ms, resolution = 1.0×1.0×1.0 mm3, FOV = 256 mm), diffusion-weighted imaging (DWI) (TR/TE = 4300/[74,125] ms, resolution = 1.3×1.3×4.0 mm3, FOV = 240 mm, b = 0 and 1000 s/mm2), and FLAIR imaging (TR/TE/TI = 9000/89/2500 ms, resolution = 0.5×0.5×2.0 mm3, FOV = 240 mm).
For reconstruction of neurometabolite signals, a union-of-subspaces model was applied in SPICE, incorporating pre-learned spectral basis functions6,8-11. For spectral quantification, an improved LCModel-based method was used, incorporating both spatial and spectral priors8. For T2 mapping, the T2 estimation bias due to the limited number of TEs (3TEs) was corrected using a correcting function pre-determined from a set of reference data. The reference data were acquired using TSE with 15 TEs (18 to 142 ms) and then fitted using a dictionary method based on Bloch simulation to generate the correcting function12.
For patients scanned within 3 days after symptom onset, the ischemic lesion was defined on ADC maps with a threshold of 620×10−6 mm2/s13. For patients scanned after 3 days after onset, the lesion was delineated manually on FLAIR images. For each patient, all images and lesion masks were coregistered to the MRSI images using an affine linear transformation14.
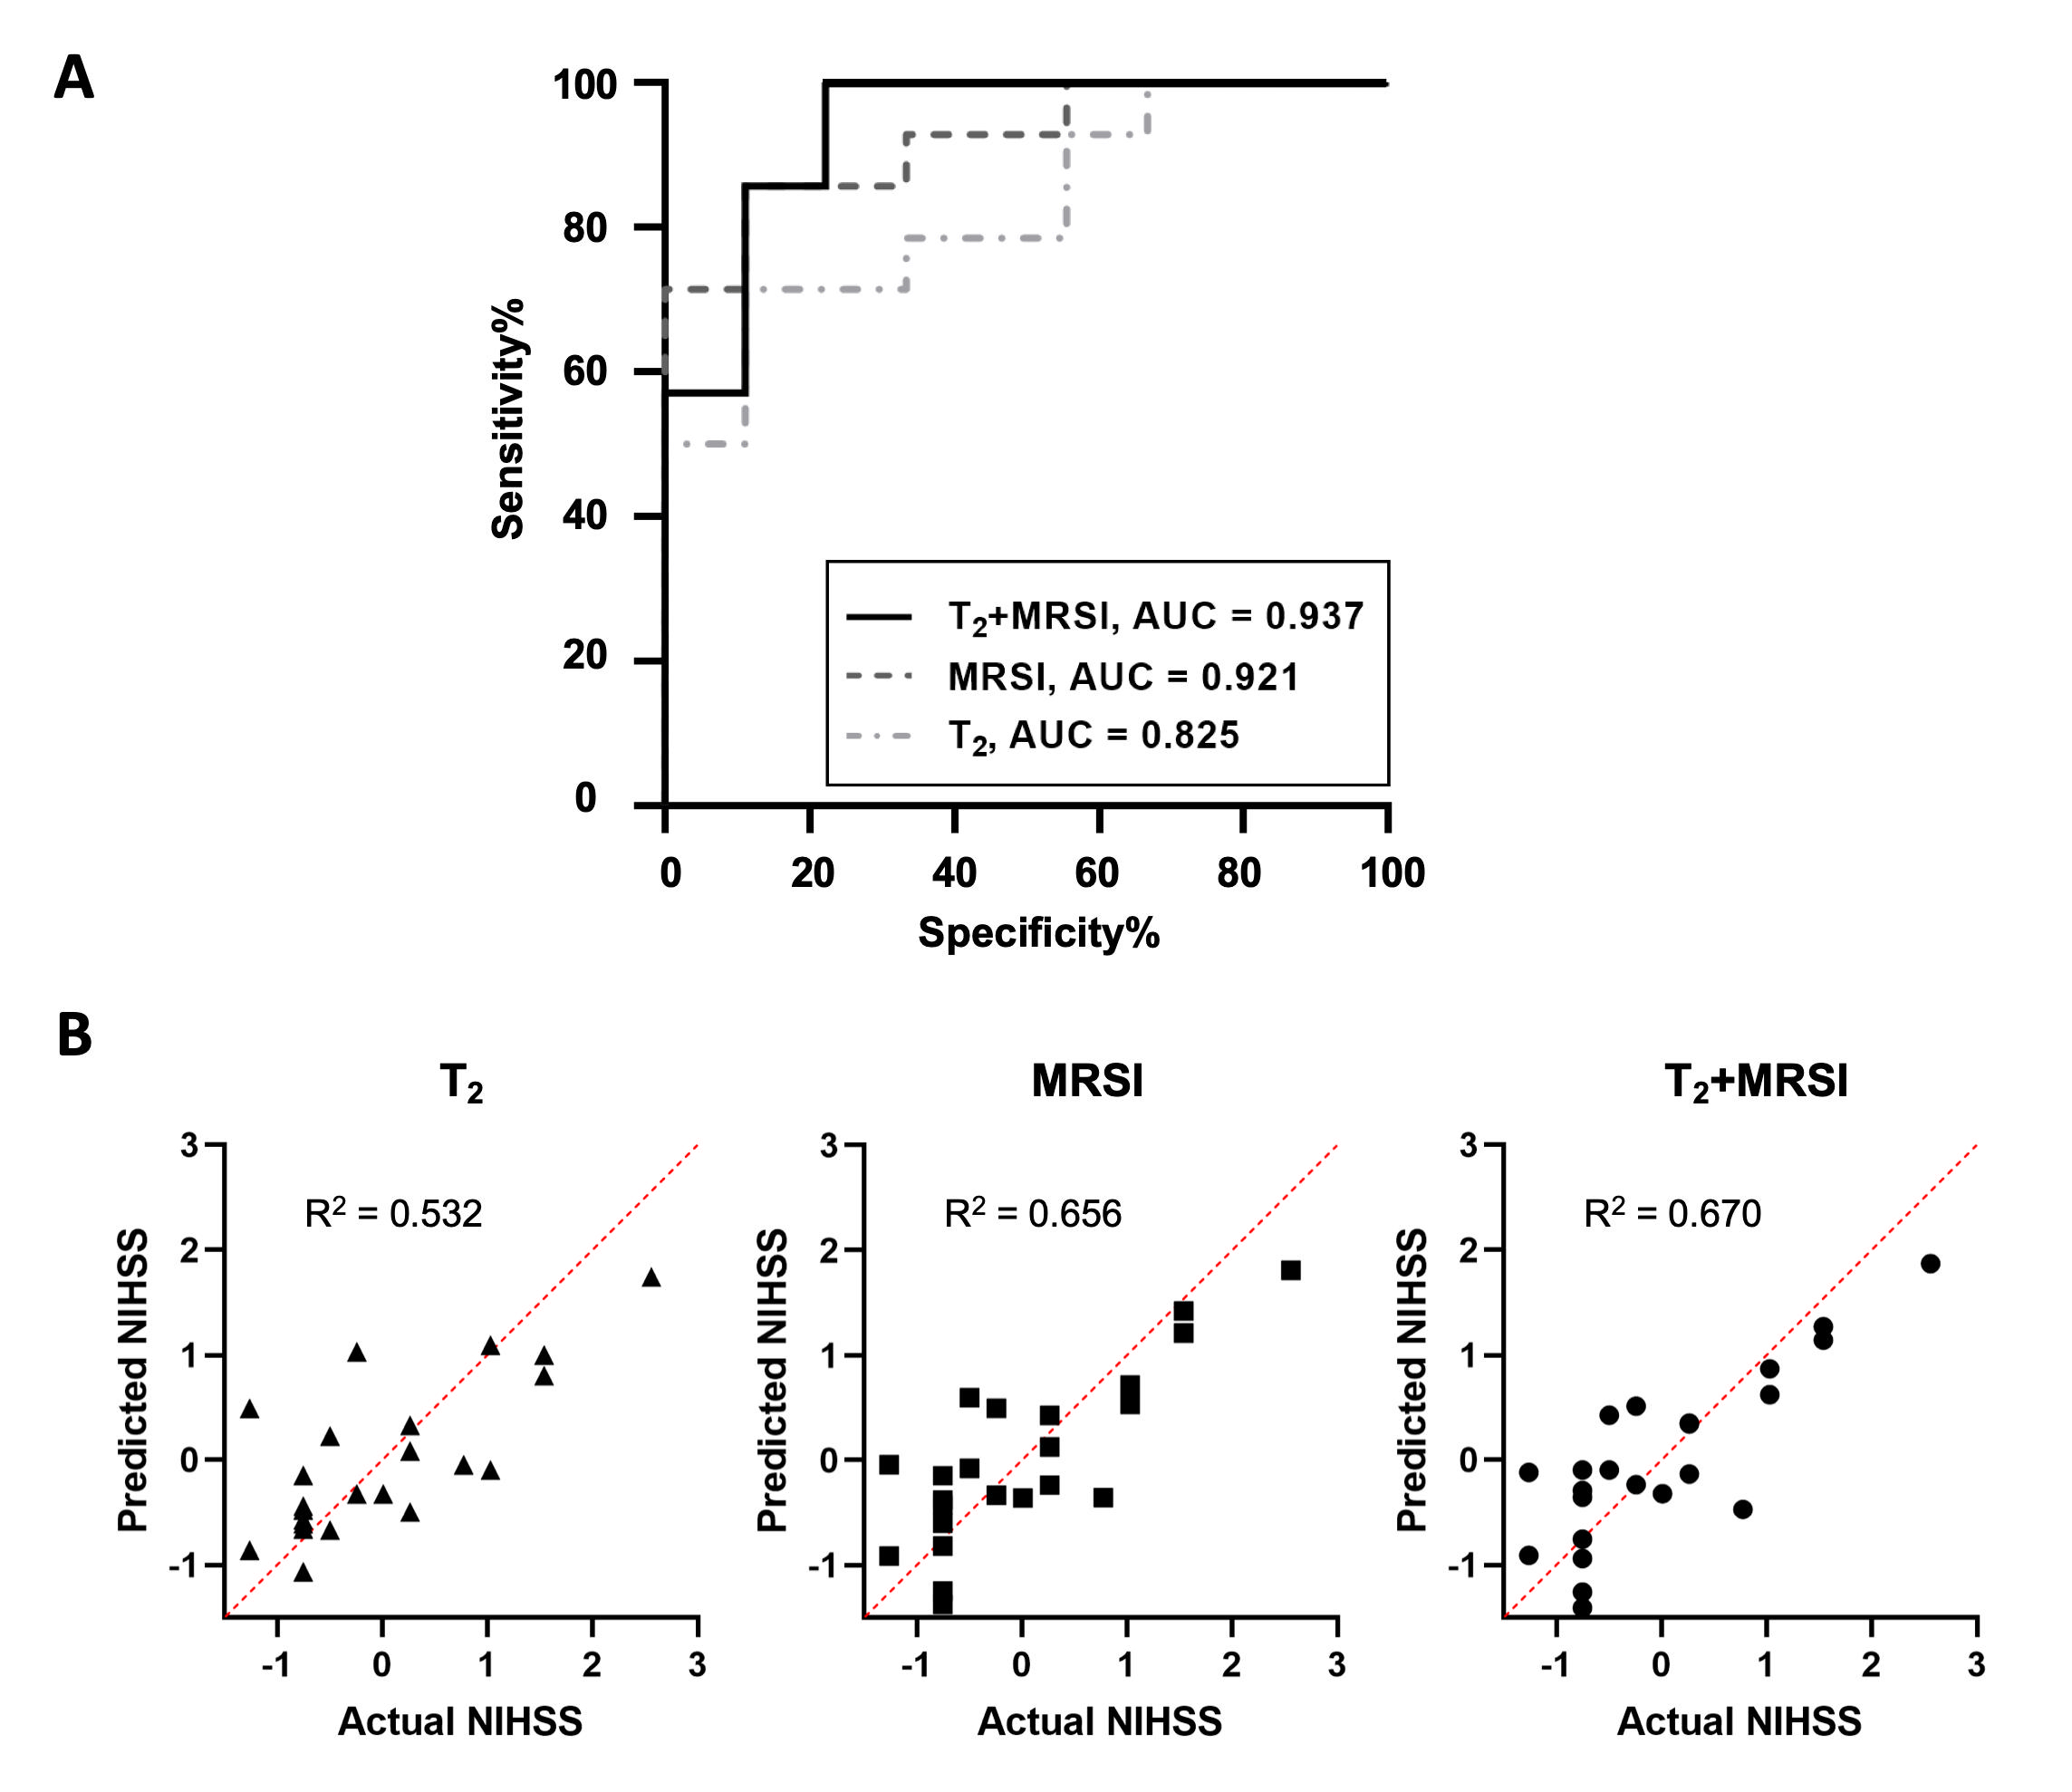
All statistical analyses were performed using R and SPSS. Group comparisons of neurometabolite concentrations and T2 values among different time windows were performed using the linear mixed-effects modelling with post hoc analyses for pairwise comparisons. Correlations between neurometabolites and T2 values were examined using Pearson’s correlation analysis and linear mixed-effects modelling for patient-wise and patch-wise (i.e., 5 patches randomly sampled within the lesion of each patient) comparisons, respectively. Logistic regression was performed to predict stroke clinical outcome at hospital discharge (mean: 14d from onset) – mild (NIHSS≤5) or moderate stroke (NIHSS>5)15 – using T2 and neurometabolite concentrations in acute stroke (≤24h) patients. Receiver operator characteristic (ROC) analysis was performed to evaluate the classification performance. Multivariate regression analysis was performed to examine the prediction of NIHSS score at discharge using T2, MRSI, and combined T2 and MRSI biomarkers in acute stroke patients.
Results
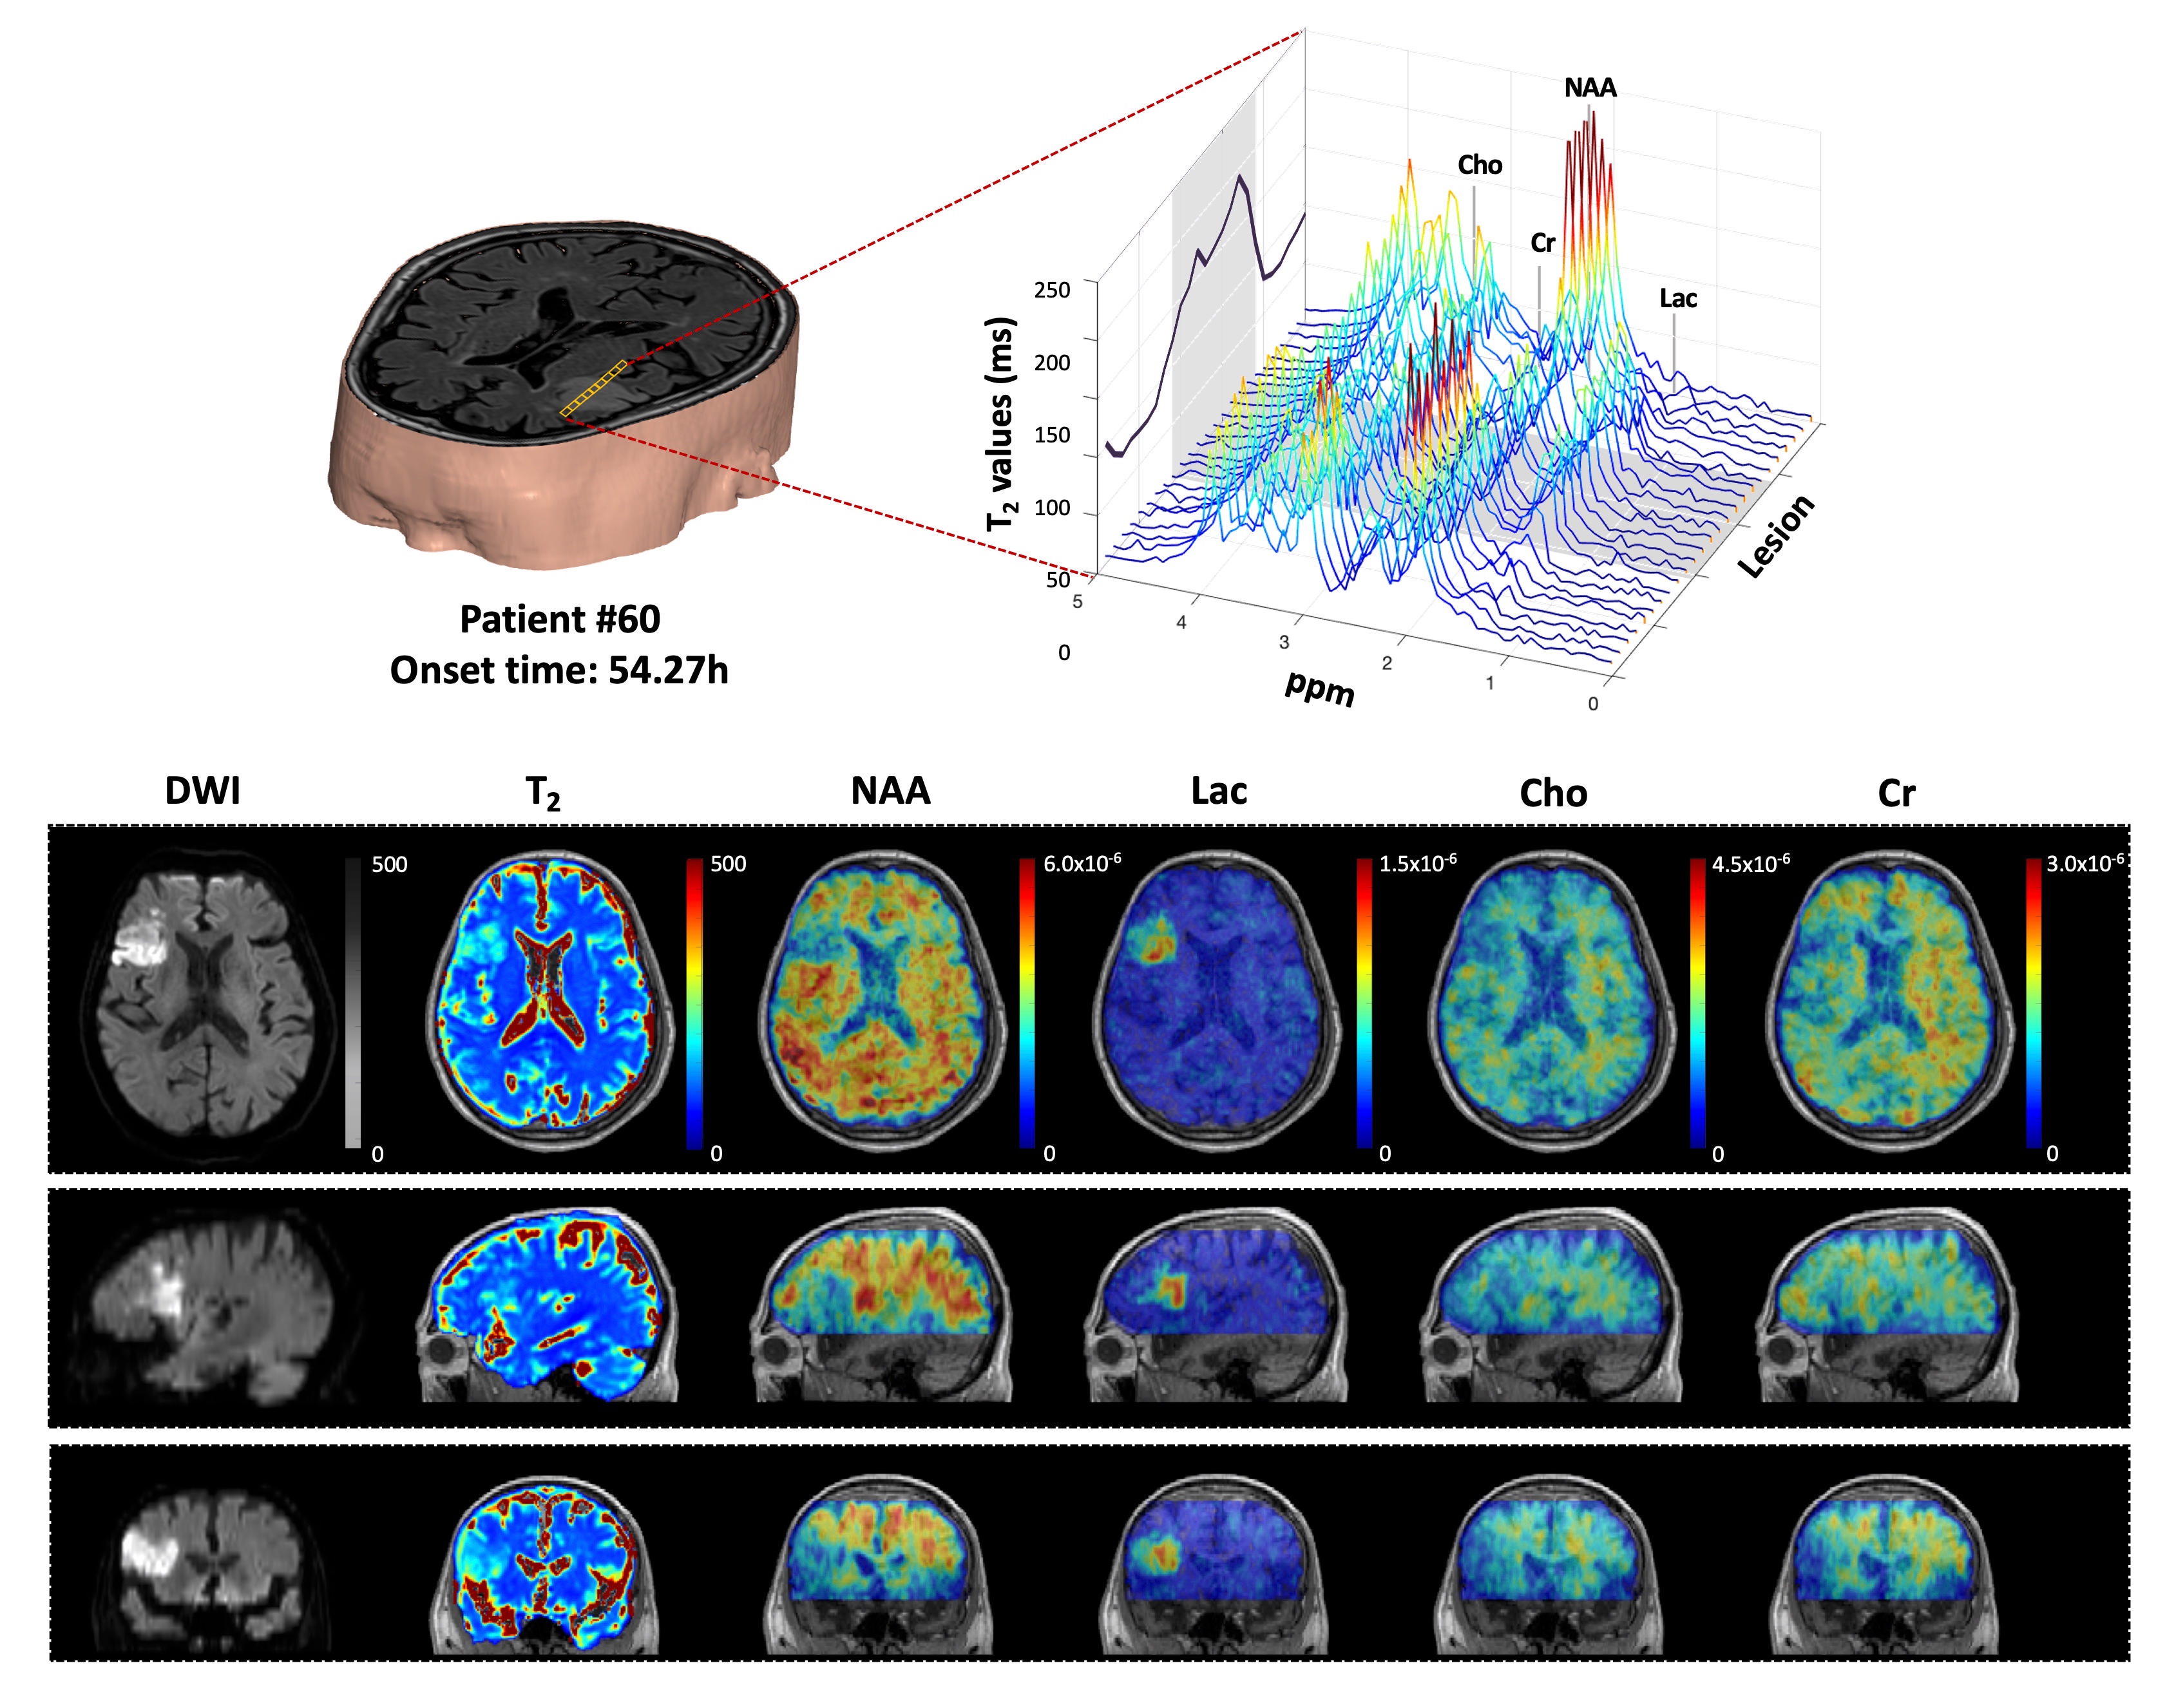
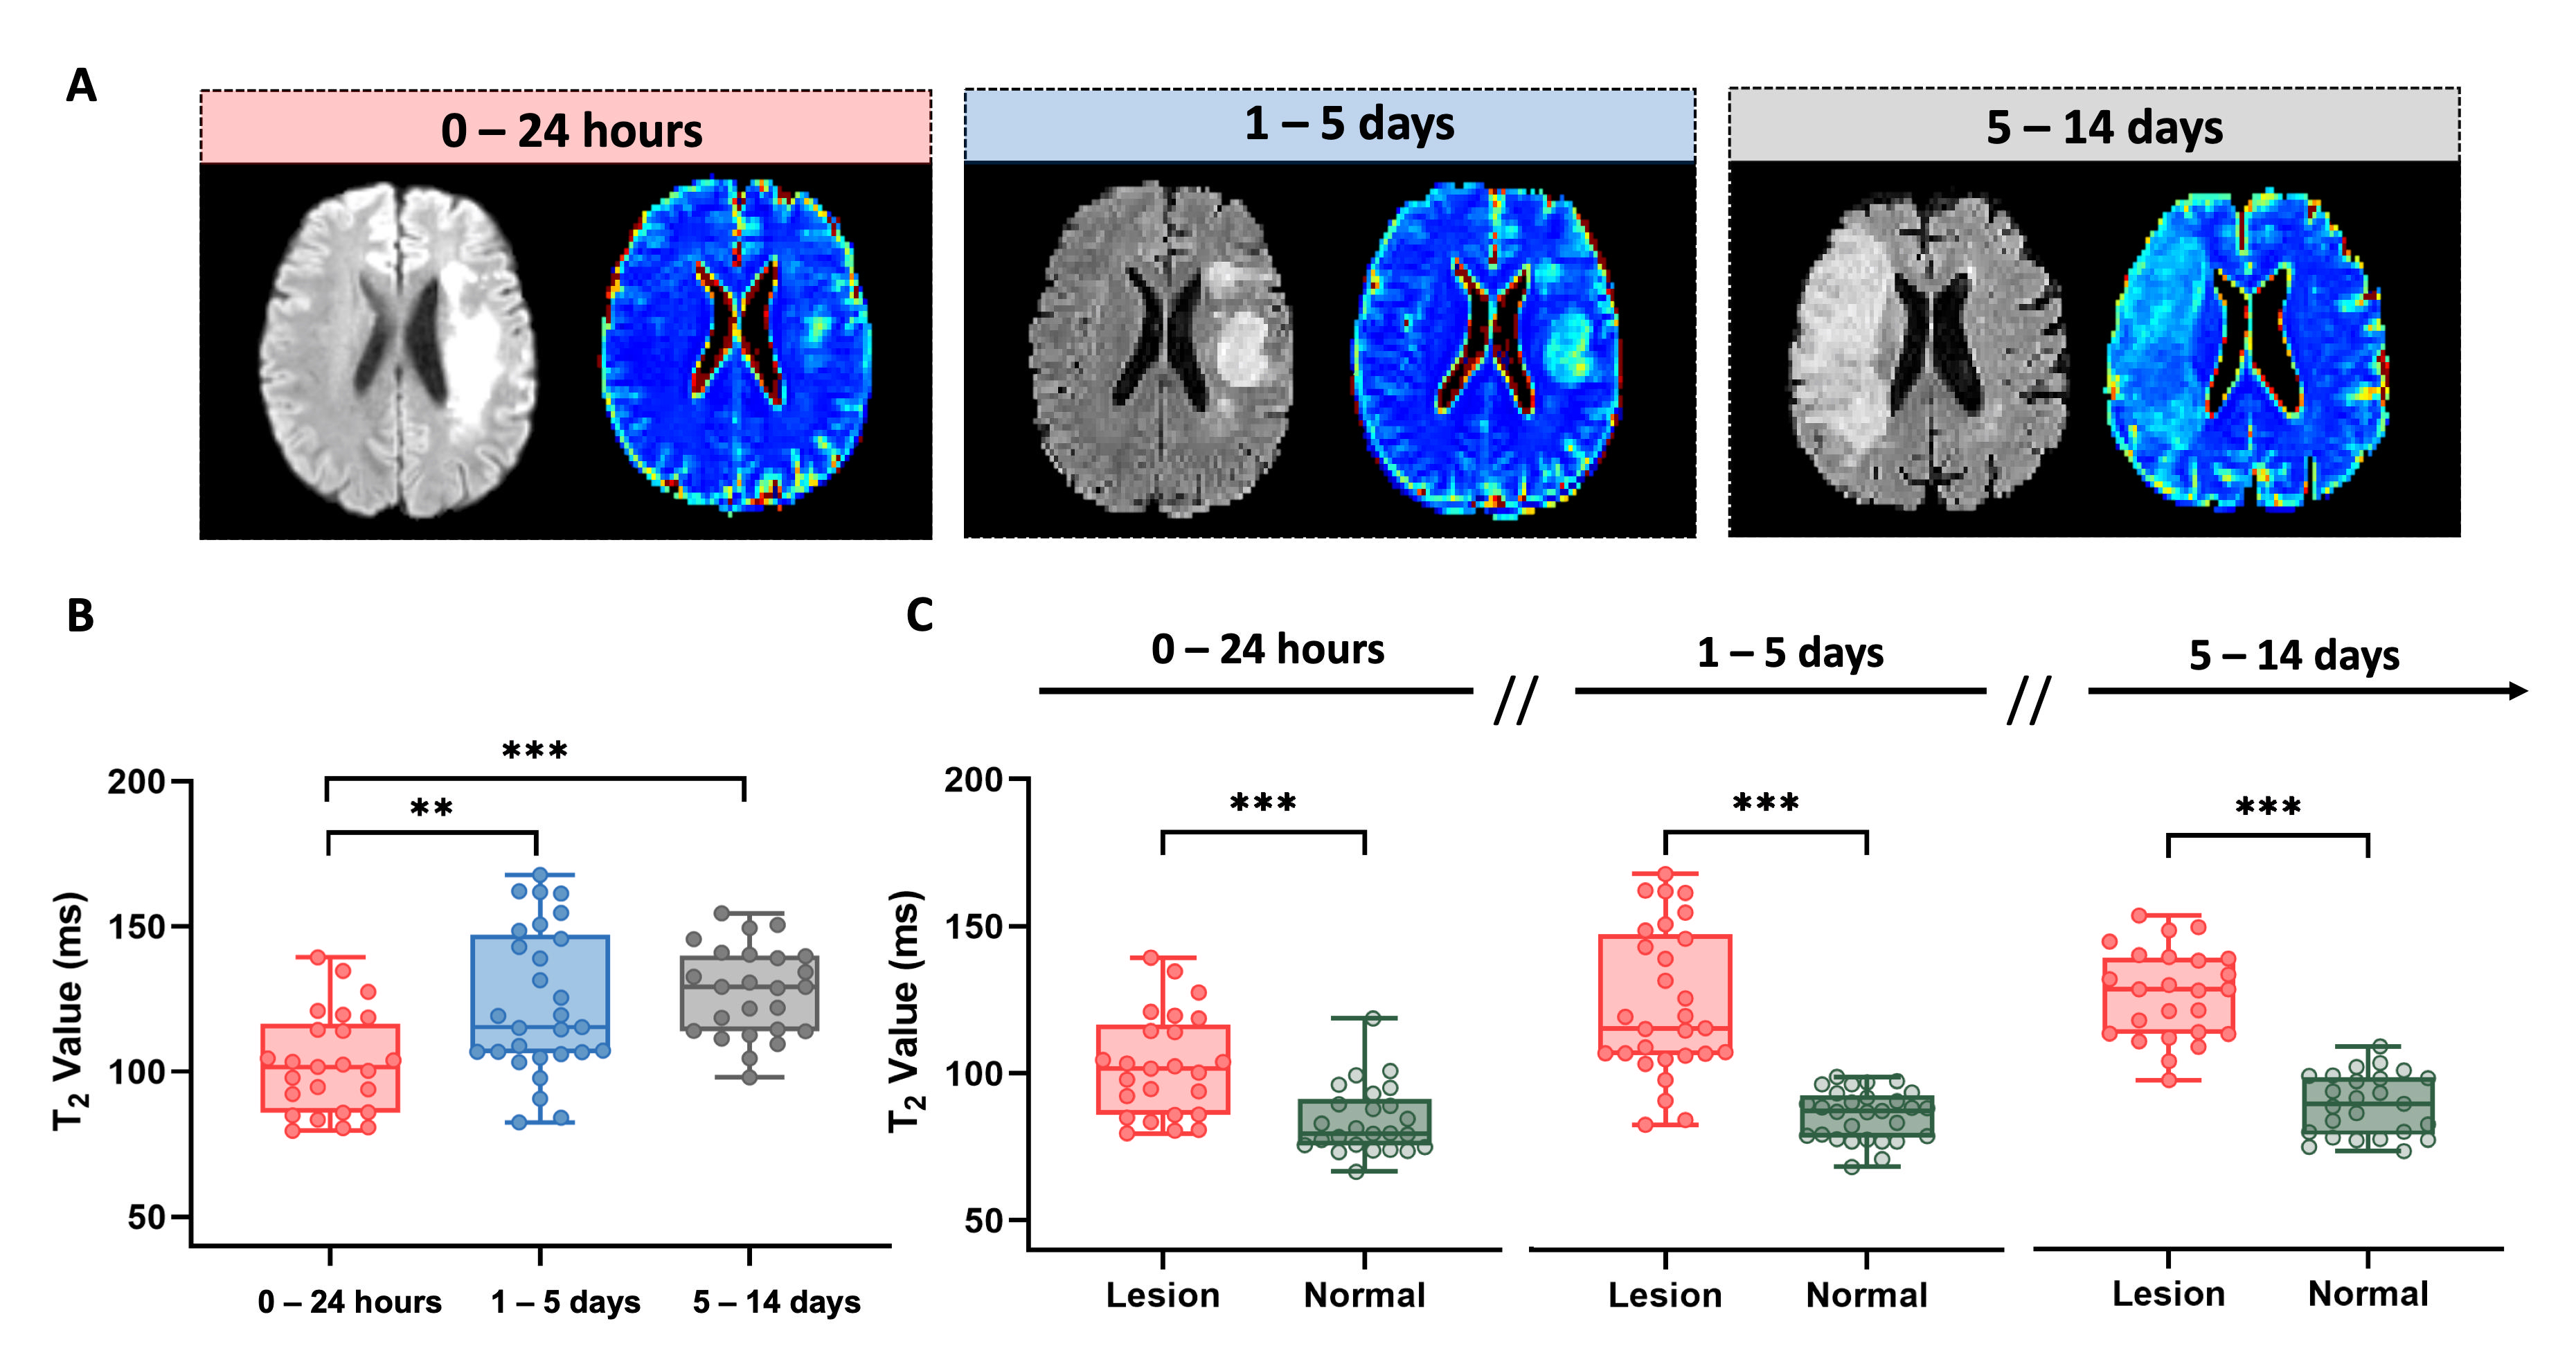
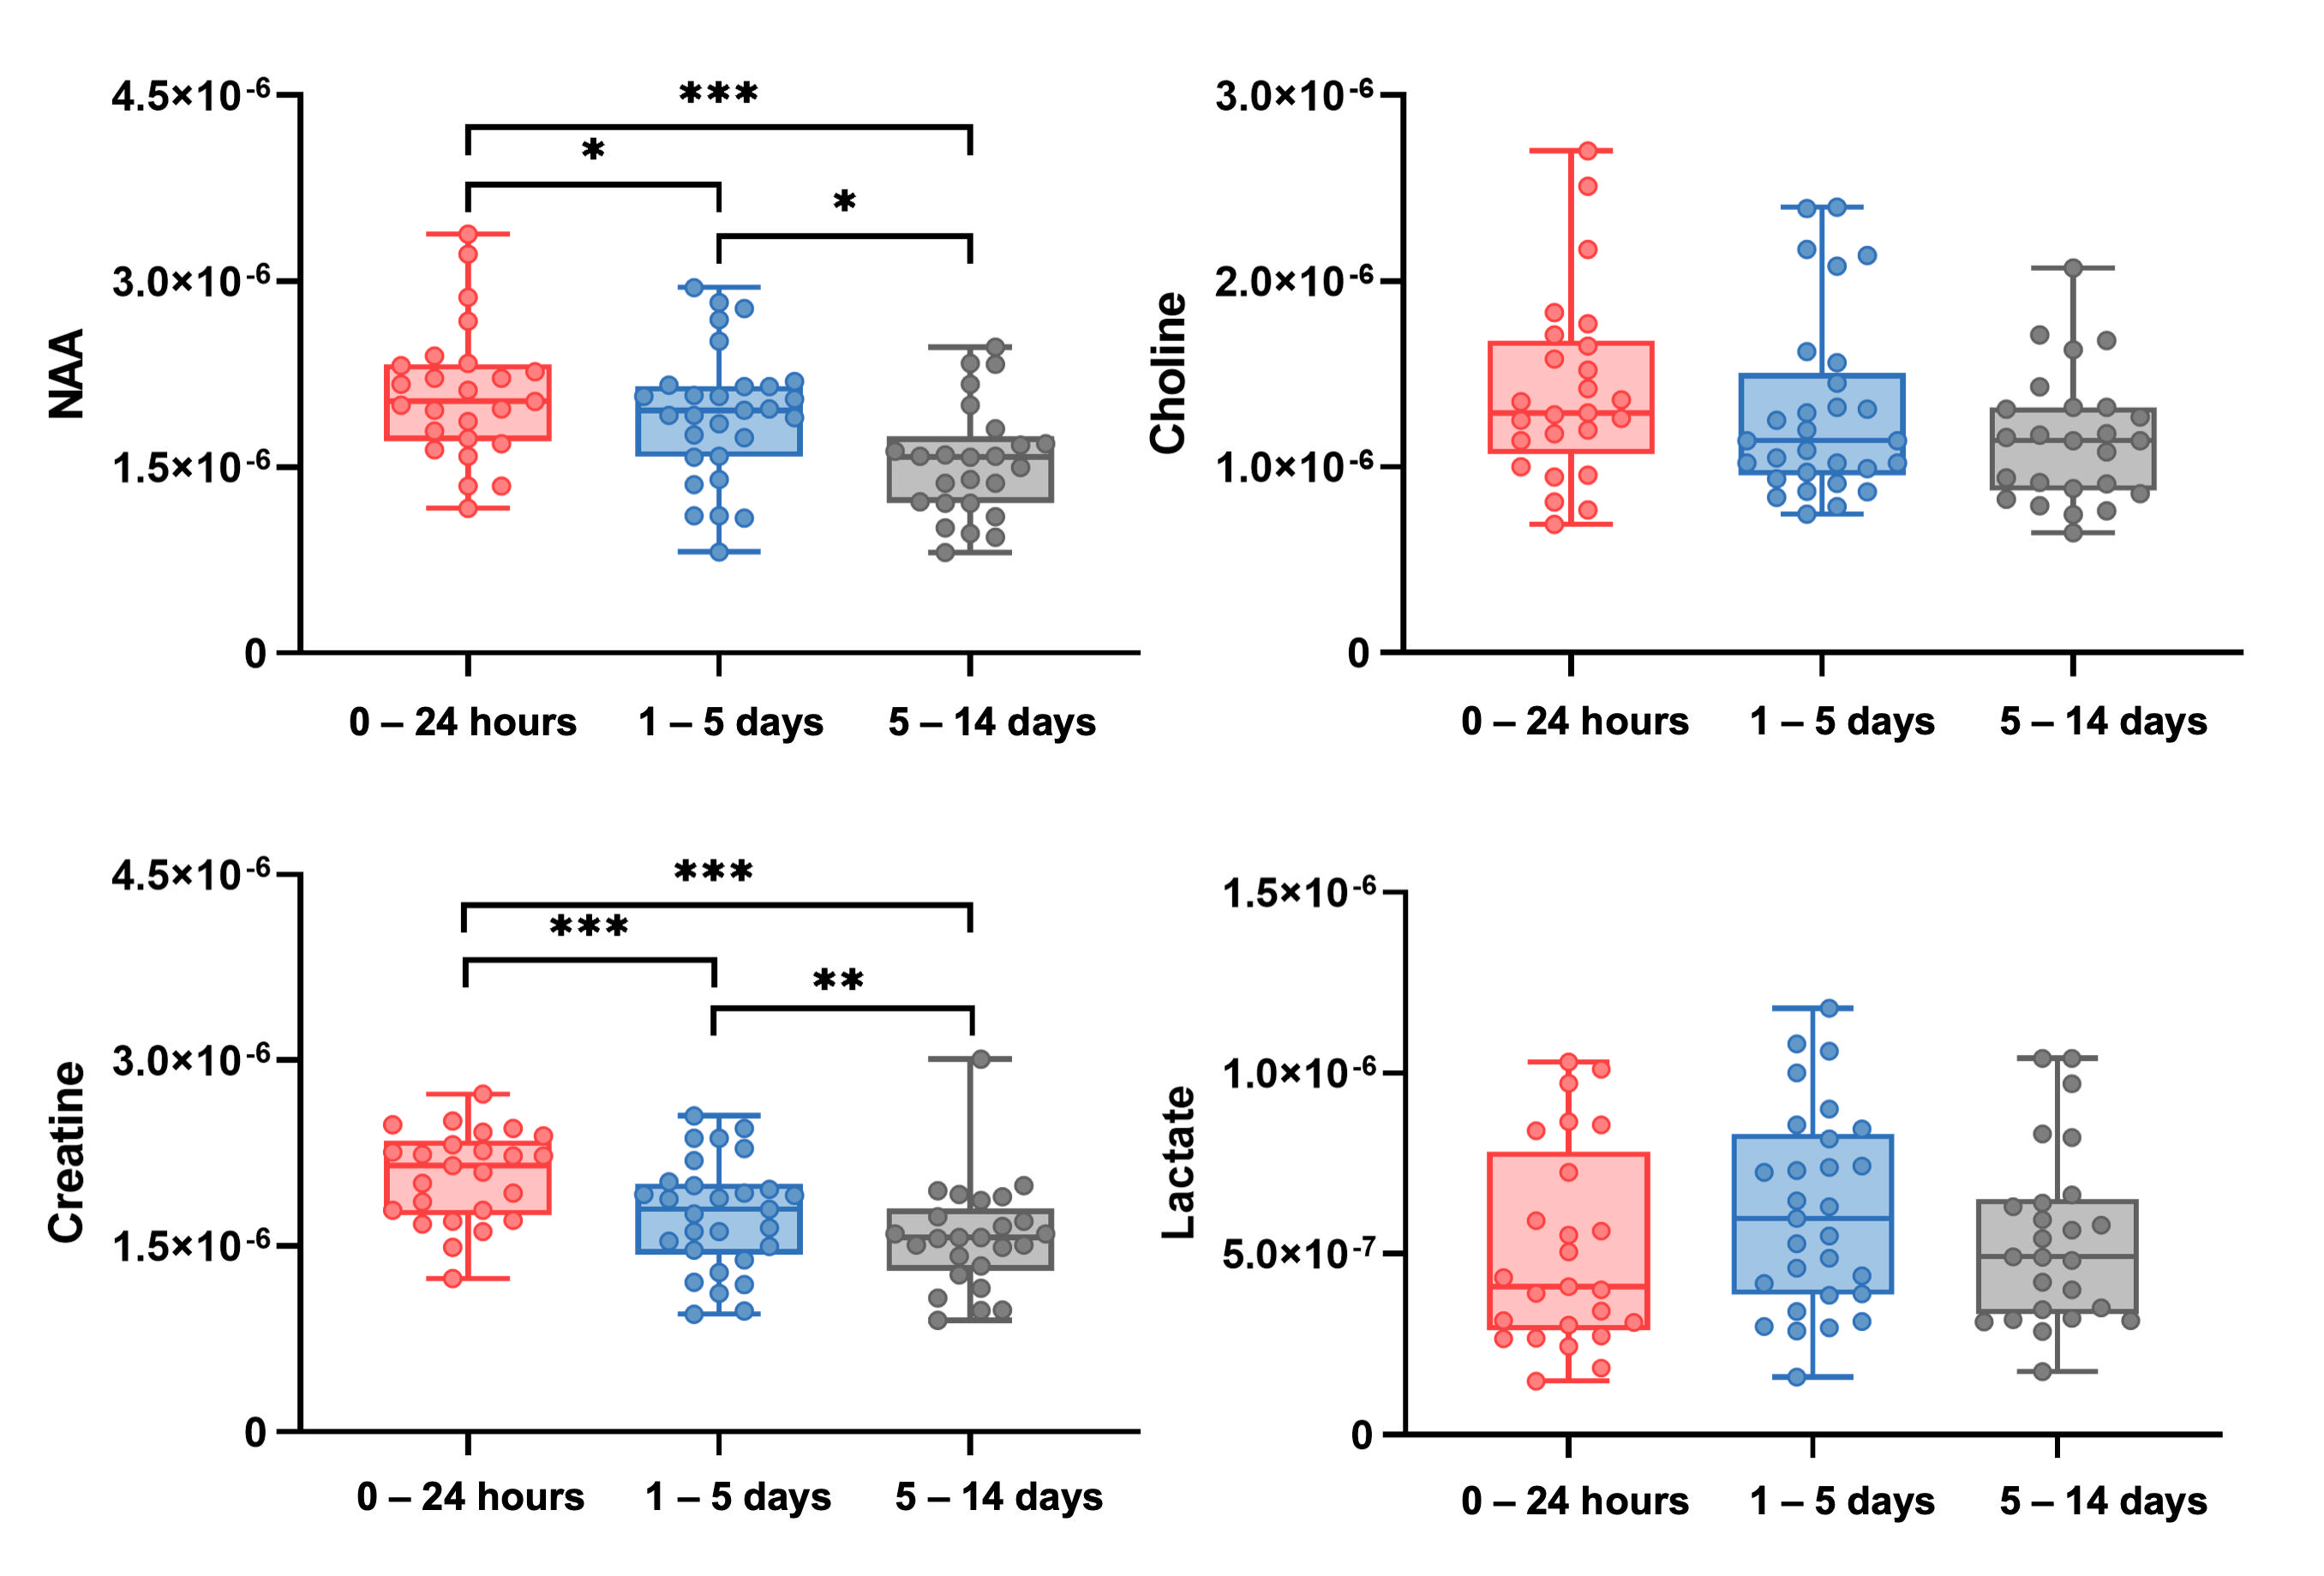
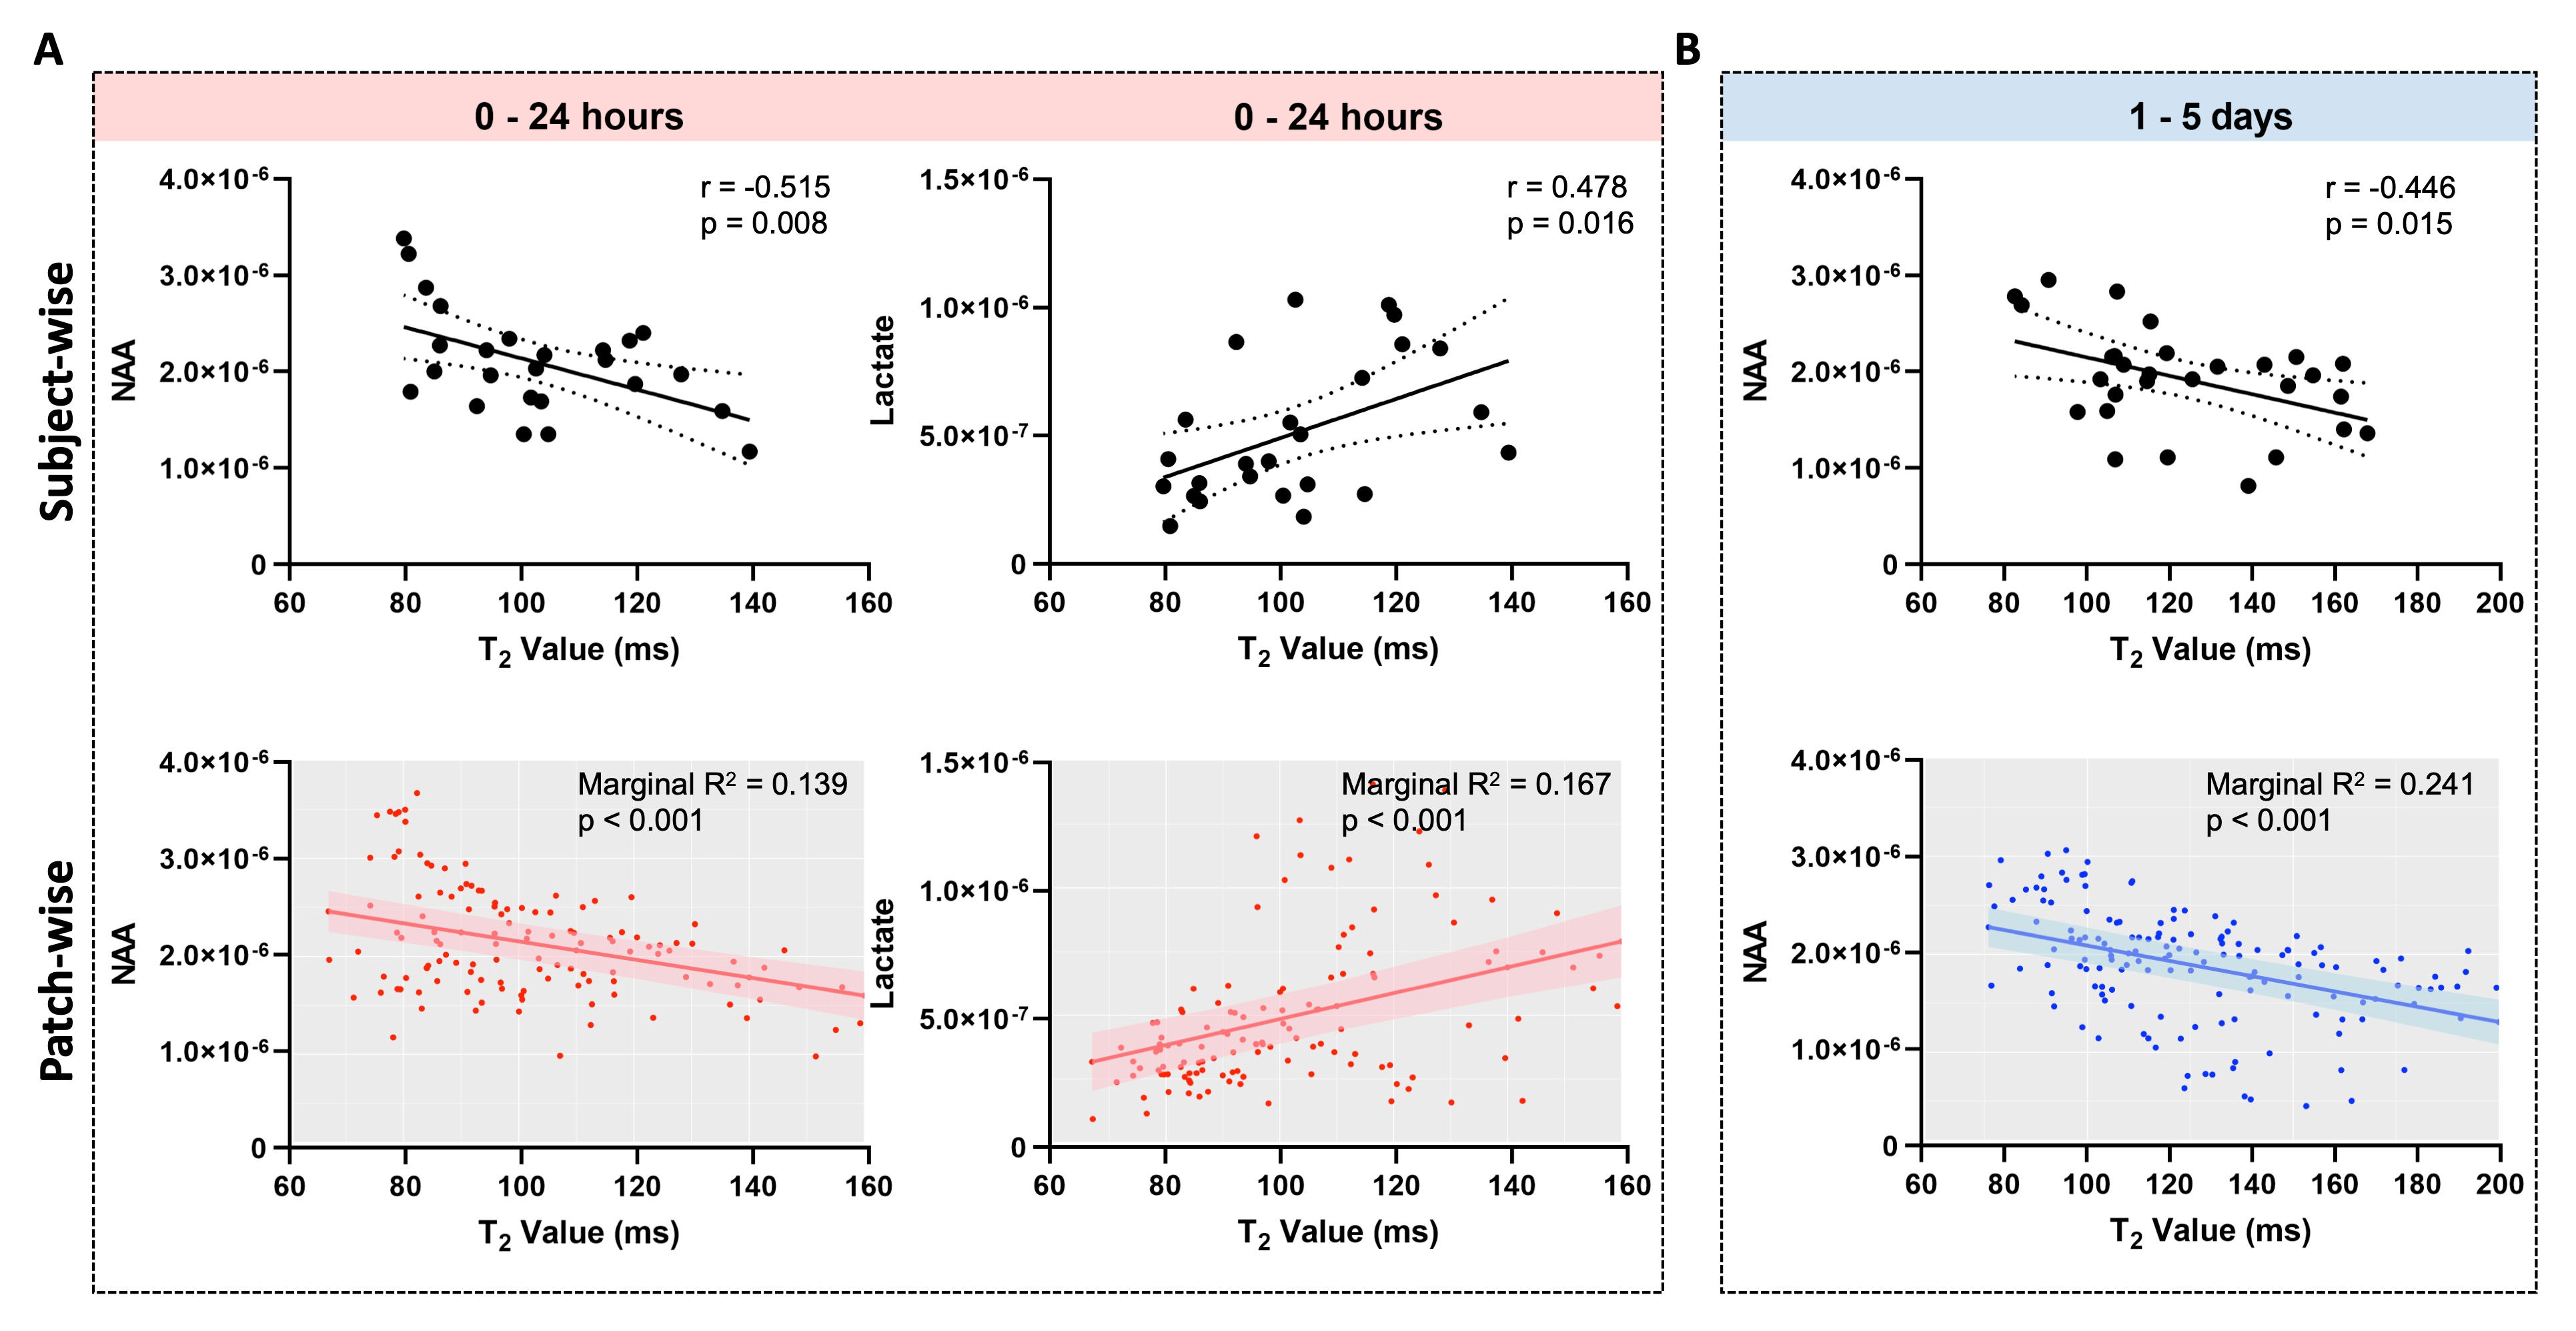
High-resolution 3D neurometabolites and T2 maps from a representative ischemic stroke patient are shown in Fig.1. Decreases in NAA, choline, and creatine levels along with increases in lactate and T2 values can be observed within the lesion. Figure 2 shows the increase of T2 value from acute to subacute stroke patients, indicating the development of vasogenic edema. Figure 3 shows a gradual reduction in NAA and creatine across all stages. As shown in Fig.4, T2 value was correlated with NAA (r = −0.515, p = 0.008) and lactate (r = 0.478, p = 0.016) in acute stroke patients. A significant correlation between T2 value and NAA concentration (r = −0.446, p = 0.015) was also found in subacute stroke patients. As shown in Fig.5A, the areas under the curve (AUC) using different biomarkers were compared and group separation using joint T2 and MRSI biomarkers yielded the best AUC of 0.937. Additionally, the integration of T2 and MRSI biomarkers in acute stroke patients provided the best prediction of NIHSS score of the patients at discharge (R2 = 0.670).Conclusion
Our study shows an association between neurometabolite concentrations, measured using high-resolution 3D MRSI, and vasogenic edema, evaluated using fast T2 mapping, in ischemic stroke patients. The multimodal biomarkers provided improved prediction of clinical scores of stroke patients.Acknowledgements
This work was supported by National Science Foundation of China (No.61671292 and 81871083) and Shanghai Jiao Tong University Scientific and Technological Innovation Funds (2019QYA12); Key Program of Multidisciplinary Cross Research Foundation of Shanghai Jiao Tong University (YG2021ZD28).
References
1. Kimberly WT, Dutra BG, Boers AMM, et al. Association of reperfusion with brain edema in patients with acute ischemic stroke: a secondary analysis of the MR CLEAN Trial. JAMA Neurol. 2018;75(4): 453-461.
2. Siemonsen S, Löbel U, Sedlacik J, et al. Elevated T2-values in MRI of stroke patients shortly after symptom onset do not predict irreversible tissue infarction. Brain. 2012;135(6):1981-1989.
3. Mestre H, Du T, Sweeney AM, et al. Cerebrospinal fluid influx drives acute ischemic tissue swelling. Science. 2020;367(6483).
4. Du T, Mestre H, Kress BT, et al. Cerebrospinal fluid is a significant fluid source for anoxic cerebral oedema. Brain. 2021.
5. Lam F, Liang ZP. A subspace approach to high-resolution spectroscopic imaging. Magn Reson Med. 2014;71(4):1349-1357.
6. Lam F, Ma C, Clifford B, et al. High-resolution 1H-MRSI of the brain using SPICE: Data acquisition and image reconstruction. Magn Reson Med. 2016;76(4):1059-1070.
7. Ma C, Lam F, Johnson CL, et al. Removal of nuisance signals from limited and sparse 1H MRSI data using a union-of-subspaces model. Magn Reson Med. 2016;75(2):488-497.
8. Li Y, Lam F, Clifford B, et al. A subspace approach to spectral quantification for MR spectroscopic imaging. IEEE Trans Biomed Eng. 2017;64(10):2486-2489.
9. Peng X, Lam F, Li Y, et al. Simultaneous QSM and metabolic imaging of the brain using SPICE. Magn Reson Med. 2018;79(1):13-21.
10. Guo R, Zhao Y, Li Y, et al. Simultaneous metabolic and functional imaging of the brain using SPICE. Magn Reson Med. 2019;82(6):1993-2002.
11. Guo R, Zhao Y, Li Y, et al. Simultaneous QSM and metabolic imaging of the brain using SPICE: Further improvements in data acquisition and processing. Magn Reson Med. 2021;85(2):970-977.
12. Ben-Eliezer N, Sodickson DK, Block KT. Rapid and accurate T2 mapping from multi-spin-echo data using bloch-simulation-based reconstruction. Magn Reson Med. 2015;73(2):809-817.
13. Purushotham A, Campbell BCV, Straka M, et al. Apparent diffusion coefficient threshold for delineation of ischemic core. Int J Stroke. 2015;10(3):348-353.
14. Jenkinson M, Beckmann CF, Behrens TEJ, et al. Fsl. Neuroimage. 2012;62(2):782-790.
15. Schlegel D, Kolb SJ, Luciano JM, et al. Utility of the NIH Stroke Scale as a predictor of hospital disposition. Stroke. 2003;34(1):134-137.
Figures