4135
Introduction of the Right Ventricular-Arterial Coupling Index in CMR Reflecting Lung Histological Changes in Experimental PAH
Ali Nahardani1,2, Katja Grün3, Martin Krämer2, Karl-Heinz Herrmann2, Andrea Schrepper4, Sara Moradi1, Jürgen R. Reichenbach2, Marcus Franz3, and Verena Hoerr1,2,5
1Heart Center Bonn, Department of Internal Medicine II, University Hospital Bonn, Bonn, Germany, 2Medical Physics Group, Institute of Diagnostic and Interventional Radiology, Jena University Hospital, Friedrich Schiller University Jena, Jena, Germany, 3Department of Internal Medicine I, Division of Cardiology, Angiology, Pneumology, and Intensive Medical Care, Jena University Hospital, Jena, Germany, 4Department of Cardiothoracic Surgery, Jena University Hospital, Jena, Germany, 5Translational Research Imaging Center (TRIC), Clinic for Radiology, University Hospital Muenster, Muenster, Germany
1Heart Center Bonn, Department of Internal Medicine II, University Hospital Bonn, Bonn, Germany, 2Medical Physics Group, Institute of Diagnostic and Interventional Radiology, Jena University Hospital, Friedrich Schiller University Jena, Jena, Germany, 3Department of Internal Medicine I, Division of Cardiology, Angiology, Pneumology, and Intensive Medical Care, Jena University Hospital, Jena, Germany, 4Department of Cardiothoracic Surgery, Jena University Hospital, Jena, Germany, 5Translational Research Imaging Center (TRIC), Clinic for Radiology, University Hospital Muenster, Muenster, Germany
Synopsis
The current preclinical study aims to investigate the associativity between the ventricular-arterial coupling index (VAC) derived by CMR and microscopic vascular changes in pulmonary arterial hypertension (PAH). To this end, three stages of disease were incorporated in the study: healthy, moderate, and severe. All animals underwent CMR and echocardiography. The corresponding lung tissue was also assessed histologically. The right VAC could predict the presence of histopathological changes with r=-0.95 and had a strong correlation with tricuspid annular plane systolic excursion (r=0.90).
INTRODUCTION
Pulmonary arterial hypertension (PAH) is a serious condition classified as the first group of pulmonary hypertension category 1. The media hypertrophy of small pulmonary arteries is the main factor for forming the pathophysiology of PAH, leading to increased vascular resistance (≥ 3 Wood units), high resting-state mean pulmonary artery pressure (25 mmHg), high right ventricular (RV) afterloads, RV remodeling, RV failure and finally mortality 1, 2. Thus, early diagnosis of PAH is important to control the disease progression by appropriate medication. Currently, right heart catheterization is the only suitable tool for PAH diagnosis 3, but it is invasive and its application is contraindicated in certain conditions 4. In this study, the definitions of ventricular elastance (Ees), arterial elastance (Ea), and ventricular-arterial coupling (VAC) were revisited by cardiac magnetic resonance imaging (CMR) for an applicable equation to assess whether this index could reflect the histopathological changes in the lung tissue more sensitive than the conventional RV function indices.METHODS
A total of 16 male Sprague Dawley rats with an average weight of 304+/-50 grams were included in the study and divided into three different experimental groups: A) Healthy (n=6, with a nuchal subcutaneous injection of 300 µl NaCl 0.9%); B) Severe PAH (n=4, with a single-dose subcutaneous injection of 60 mg/kg Monocrotaline dissolved in 300 µl NaCl 0.9%); c) Moderate PAH (n=6, with the same medication as the disease group and an additional oral application of 15 mg/kg Macitentan from day 14 to 28). Prospectively cardiac and respiratory triggered 5D-Phase-contrast CMR was performed on a 9.4T Bruker BioSpec USR 94/20 imaging system using a vendor-supplied 72-mm-diameter quadrature volume coil with the following specifications: Flow-encoding-scheme: HADAMARD, TR=10ms; TE=1.1ms; BW=100kHz; Flip-Angle: 10ᵒ, under-sampling factor=1.4-1.6; averages=1; resolution=(375×375×375) µm3; VENC=75-200 cm/s. Firstly, the complex 5D-stack of images was reconstructed using regridding and inverse fast Fourier transform on the raw data. Then, the magnitude images were calculated and the 5D-stacks were combined in the HADAMRAD dimension to form a cine 4D-stack of images from the heart and great vessels. In RV, the stack of 4D-cine images was segmented manually to calculate ESV, EDV, VAC as EDV/ESV ratio, ejection fraction (EF), and stroke volume (SV). In addition, on the same day as CMR, echocardiography was performed on the animals to measure the tricuspid annular plane systolic excursion (TAPSE) as a measure of disease severity. Finally, the pulmonary tissues were perfused, harvested, and analyzed by histopathology using an established pulmonary sum-score system 5. All experiments were conducted in accordance with the ethical guidelines.RESULTS
VAC, EF, SV, EDV, and ESV could differentiate between all the PAH severity groups when analyzed by the k-independent-samples Kruskal-Wallis H-Test (P<0.05, Figure 1). Nevertheless, the linear regression analysis between the corresponding parameters and the results of the histopathological sum-score showed the strongest correlation coefficient value for VAC compared to all the other parameters (VAC: r=-0.95 vs. EF: r= -0.91, SV: -0.66, EDV: 0.76, ESV: 0.89; Figure 2 and Figure 3). In addition, VAC, EF, SV, EDV, and ESV showed respectively the correlation coefficients of r = 0.85, 0.81, 0.55, 0.61, and 0.77 with TAPSE (Figure 2). The rate of ESV enlargement was on-average 39% higher than EDV enlargement in the course of the disease (213 vs. 153 ml respectively).DISCUSSION
Ees and Ea are considered as the measures of myocardial contractility and ventricular afterloads respectively. Therefore, VAC defined as the ratio of Ees/Ea can potentially reflect the coupling effect between the arterial pressure and the myocardial burden 6. When summarizing the native VAC equation, a simplified equation can be derived and presented as the ratio of EDV to ESV (Equation 1):$$ \frac{EDV}{ESV} = \frac {E_{es}}{E_{a}} +1 $$
On the one hand, this equation provides a non-invasive estimation of Ees/Ea; nevertheless, it cannot provide any information on whether the changes occur due to arterial pressure or ventricular volume alterations without any prior knowledge. However, as PAH is a primary disease originating from the pulmonary small arteries and progressing to the right heart because of increased RV afterloads, the use of EDV/ESV as a biomarker is suitable for the assessment of PAH and follow-ups. On the other hand, EDV/ESV reflects how fast the RV afterload increases compared to the RV preloads; therefore, it gives useful information about the rate of RV remodeling in the course of the disease.
Likewise, EDV/ESV also forms the following relation with EF (Equation 2):
$$ \frac{EDV}{ESV} =1-\frac{1}{EF}$$
In our point of view, EF is only an index normalizing the differences between preload (i.e. expressed by EDV changes) and afterload (i.e. expressed by ESV changes) with respect to preloads; but the associated changes between them are not captured. However, the EDV/ESV ratio provides information about the associated ratio of preload to afterload changes and thus can be considered as a more sensitive biomarker in PAH. In summary, we could show that the EDV/ESV ratio is a more suitable predictor than the conventional functional indices for the non-invasive diagnosis of PAH and the assessment of its severity.
CONCLUSION
The EDV/ESV ratio has a stronger association with the pulmonary histopathological changes in PAH than EF, SV, EDV, and ESV.Acknowledgements
There are no acknowledgments regarding this study.References
- Galiè N, Humbert M, Vachiery JL, Gibbs S, Lang I, Torbicki A, et al. 2015 ESC/ERS Guidelines for the diagnosis and treatment of pulmonary hypertension: The Joint Task Force for the Diagnosis and Treatment of Pulmonary Hypertension of the European Society of Cardiology (ESC) and the European Respiratory Society (ERS): Endorsed by: Association for European Paediatric and Congenital Cardiology (AEPC), International Society for Heart and Lung Transplantation (ISHLT). European heart journal. 2016;37(1):67-119.
- Hoeper MM, Bogaard HJ, Condliffe R, Frantz R, Khanna D, Kurzyna M, et al. Definitions and diagnosis of pulmonary hypertension. J Am Coll Cardiol. 2013;62(25 Suppl):D42-50.
- Barbosa EJM, Gupta NK, Torigian DA, Gefter WB. Current Role of Imaging in the Diagnosis and Management of Pulmonary Hypertension. American Journal of Roentgenology. 2012;198(6):1320-31.
- Rosenkranz S, Preston IR. Right heart catheterisation: best practice and pitfalls in pulmonary hypertension. European respiratory review : an official journal of the European Respiratory Society. 2015;24(138):642-52.
- Franz M, Grün K, Betge S, Rohm I, Ndongson-Dongmo B, Bauer R, et al. Lung tissue remodelling in MCT-induced pulmonary hypertension: a proposal for a novel scoring system and changes in extracellular matrix and fibrosis associated gene expression. Oncotarget. 2016;7(49):81241-54.
- Antonini-Canterin F, Poli S, Vriz O, Pavan D, Bello VD, Nicolosi GL. The Ventricular-Arterial Coupling: From Basic Pathophysiology to Clinical Application in the Echocardiography Laboratory. J Cardiovasc Echogr. 2013;23(4):91-5.
Figures
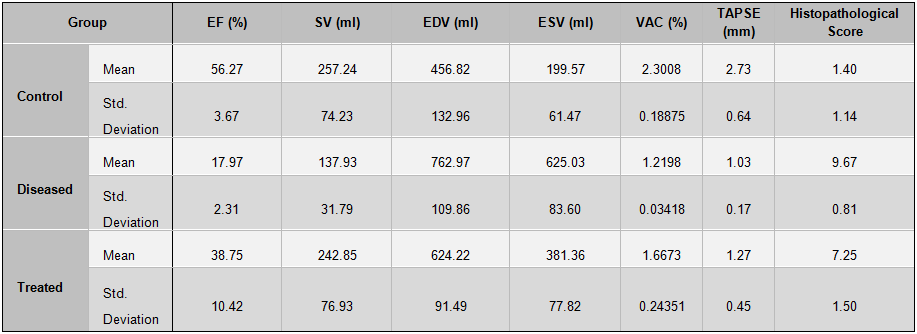
Table 1. Descriptive statistics summarizing the quantitative findings of the current study; (EF: ejection Fraction, SV: stroke volume, EDV: end-diastolic volume, ESV: end-systolic volume, VCA: Ventricular-arterial coupling, TAPSE: Tricuspid annular plane systolic excursion)
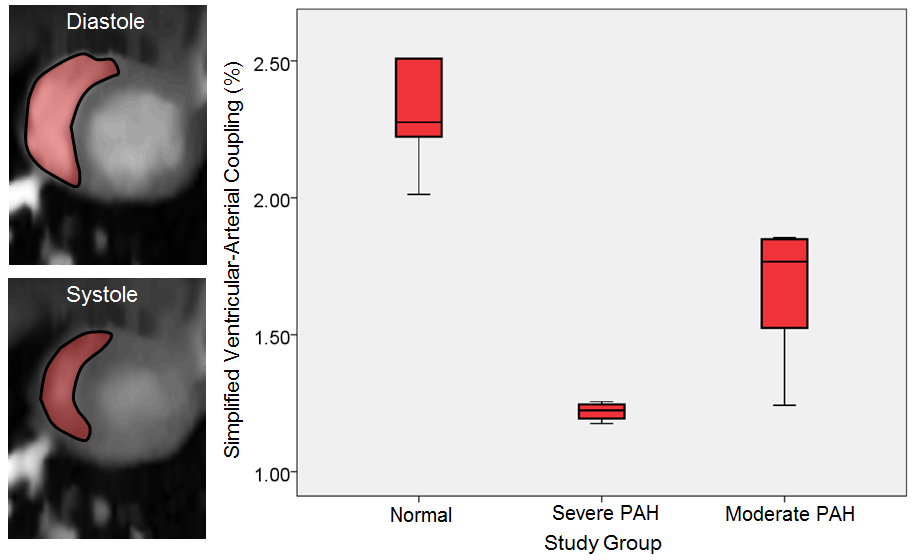
Figure 1. Left) Representative images showing the area changes of the right ventricular diastole and systole in a normal animal. Right) A box-plot representing the median of the ventricular-arterial coupling index in different disease severity (PAH: pulmonary arterial hypertension).
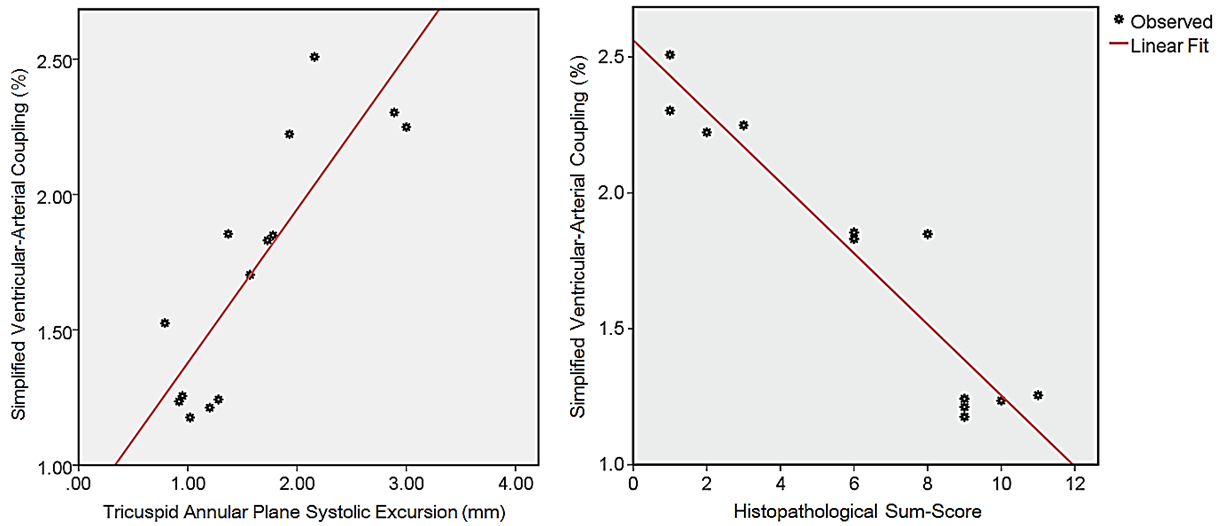
Figure 2. Left) Linear regression analysis between the ventricular-arterial coupling index and the tricuspid annular plane systolic excursion. Right) Linear regression analysis between ventricular-arterial coupling index and the histopathological sum-score.
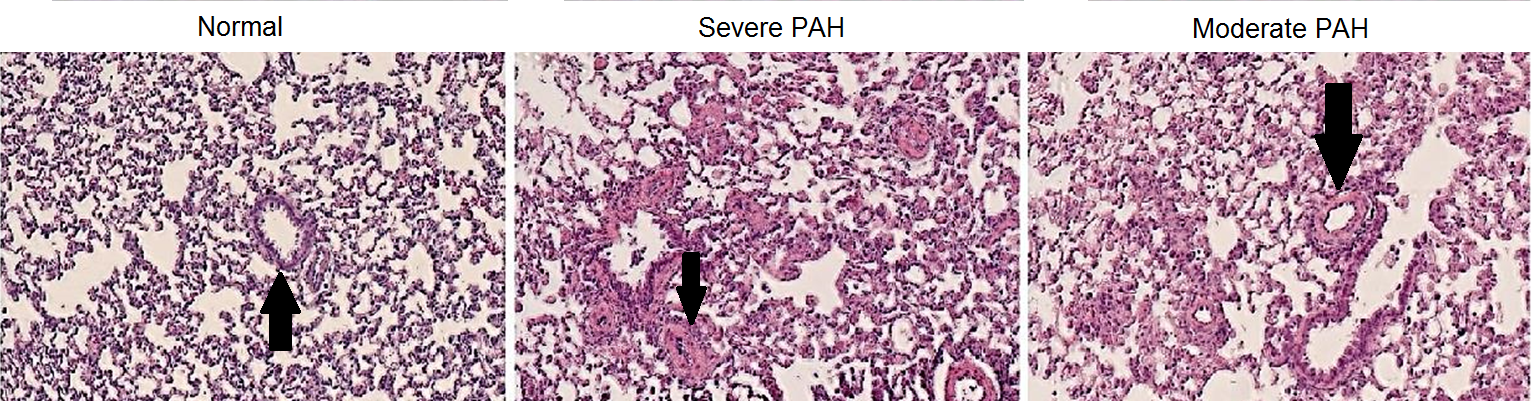
Figure 3. Representative images showing the pulmonary peribronchial and small arteries hypertrophy in the different disease stages of pulmonary artery hypertension (Arrows).
DOI: https://doi.org/10.58530/2022/4135