4127
T1ρ dispersion imaging on 3T MRI detects diffuse fibrosis in subtypes of hypertrophic cardiomyopathy1MRI department, The First Affiliated Hospital of Zhengzhou University, Zhengzhou, China, 2Pathology department, The First Affiliated Hospital of Zhengzhou University, Zhengzhou, China, 3Mallinckrodt Institute of Radiology, Washington University in St. Louis, St. Louis, MO, United States, 4Icahn School of Medicine at Mount Sinai, New York, NY, United States, 5Washington University School of Medicine, Saint Louis, MO, United States, 6Siemens Shenzhen Magnetic Resonance Ltd, Shenzhen, China
Synopsis
This study evaluated a cardiac T1ρdispersion mapping technique, termed as myocardial fibrosis index (mFI), to distinguish various levels of fibrosis in different subtypes of hypertrophic cardiomyopathy (HCM). These subtypes included patients with or without obstructive HCM, and with or without hypertrophic myocardial segments. Our data demonstrated that the mFI is equal to or significantly better than other cardiac fibrosis index, contrast-derived extracellular volumes, and native T1 values.
Introduction
Diffuse fibrosis in hypertrophic cardiomyopathy (HCM) is associated with severe malignant arrhythmia and heart failure. However, differences in the diffuse fibrosis levels in various HCM subtypes remain unclear. We hypothesized that noncontrast myocardial T1ρ dispersion methods [1] may allow differential diagnosis for this purpose. This study thus aimed to evaluate the value of the T1ρ dispersion mapping technique for the diagnosis of diffuse myocardial fibrosis in HCM subtypes.Methods
Thirty-two patients with HCM and 18 healthy controls were included in this prospective study. All subjects underwent imaging on a 3T MR scanner (MAGNETOM Skyra, Siemens Healthineers, Erlangen, Germany). The cardiac MR exam included cine, T1ρ-mapping at two spin-locking frequencies of 0 and 300 Hz [2], and pre- and post-contrast T1-mapping imaging. Myocardial extracellular volume (ECV) maps were calculated using pre- and post-contrast T1 maps. Myocardial T1ρ and T1ρ dispersion maps (termed myocardial fibrosis index [mFI] maps), were constructed to provide 570 myocardial segments for the correlation analysis. HCM was divided into two types: obstructive hypertrophic cardiomyopathy (OHCM) vs. non-obstructive hypertrophic cardiomyopathy (NOHCM); and HCM with normal myocardial thickness (< 15 mm) (HCM-N) vs. HCM with myocardial hypertrophy (≥ 15mm) (HCM-H). Three patients with OHCM had a partial myoectomy treatment and tissue samples were obtained from the anterior interventricular septum for Masson staining. The statistical methods used were one-way analysis of variance with post-hoc testing, Pearson or Spearman correlations, and receiver operating characteristic (ROC) curve analyses.Results
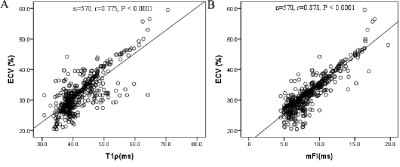
The ECVs increased progressively from healthy controls to the OHCM and NOHCM groups (healthy: 27.4 ± 2.8% vs. OHCM: 31.5 ± 5.2% vs. NOHCM: 34.6 ± 6.1%; P < 0.0001). The mFI showed the same trend (healthy: 6.1 ± 0.9 vs. OHCM: 8.4 ± 2.4 vs. NOHCM: 9.6 ± 2.9; P < 0.0001). Similarly, ECVs and mFIs increased progressively from healthy controls to the HCM-N group, and subsequently to the HCM-H group (ECV: 27.4 ± 2.8% vs. 31.1 ± 4.2% vs. 37.6 ± 6.9%; p < 0.0001; mFI: 6.1 ± 0.9 vs. 8 ± 1.9 vs. 11 ± 3.3, respectively; p <0.0001). There is a strong positive correlation between segmented ECV and T1ρ (r = 0.775) or mFI values (r = 0.878) (Figure 1). The mFI measurement is equal to or significantly better than the ECV measurement to differentiate fibrosis in the HCM subtypes, as shown in the ROC curve analyses (Figure 2). The native T1 had the worst performance. Examples of T1p, mFI, and ECV maps in two patients are shown in Figure 3.Discussion & Conclusion
Our study demonstrated successful clinical T1ρ imaging and related dispersion mapping at a 3T MRI clinical system. T1ρ dispersion mapping (mFI mapping) shows the most image contrast to differentiate diffusion fibrosis, followed by ECV and T1ρ mapping. T1ρ dispersion may become alternative and sensitive noncontrast diagnostic tools for quantitative assessment of excessive myocardial fibrosis in HCM and subtypes.Summary of Main Findings
The myocardial fibrosis index is equal to or significantly better than contrast-derived extracellular volume measurements and naïve T1 mapping for assessing diffuse fibrosis in hypertrophic cardiomyopathy.Acknowledgements
We thank all the technicians in the magnetic resonance department of the First Affiliated Hospital of Zhengzhou University.References
1. Wang C, Zheng J, Sun J, et al. Endogenous contrast T1ρ cardiac magnetic resonance for myocardial fibrosis in hypertrophic cardiomyopathy patients. J Cardiol 2015;66:520-526.2.
2. Zhang Y, Zeng W, Chen W, et al. MR extracellular volume mapping and non-contrast T1ρ mapping allow early detection of myocardial fibrosis in diabetic monkeys. Eur Radiol 2019; 29:3006-3016.
Figures


