4126
The feasibility of cardiac magnetic resonance myocardial feature tracking in evaluating patients with atrial fibrillation1Department of Radiology, Tianjin Chest Hospital, Tianjin, China, 2Philips Healthcare, Beijing, China
Synopsis
Atrial fibrillation increases mortality and is an independent risk factor for heart failure and stroke. Cardiac magnetic resonance feature tracking (CMR-FT) is a post-processing technique that can quantitatively assess myocardial deformation. The result showed that patients with Atrial fibrillation had lower left ventricle longitudinal strain (LVLS) and left atrial longitudinal strain(LALS)compared with healthy control,which may due to impaired function and myocardial injury. Therefore, measuring the longitudinal strain of the left atrium and left ventricle can be used as an important method to evaluate the function of patients with atrial fibrillation.
Introduction
Atrial fibrillation (AF) is the most common clinical arrhythmia, and its incidence is rising worldwide with high morbidity and mortality 1, 2. The accurate assessment of the remodeling of AF structure and function may be crucial for clinical treatment of this disease. Cardiac magnetic resonance (CMR) has the advantages of high accuracy and reproducibility, is widely regarded as a non-invasive reference standard for assessing the structure, function and tissue characteristics of atrium and ventricle 3-5. Feature tracking technique, as a CMR based post-processing method, can evaluate the deformability of the myocardium during the cardiac cycle. Previous studies report a high accuracy and reproducibility of tissue-tracking CMR in LA strain and strain rate measurements. Lower LA strain and strain rate measured by tissue-tracking CMR are associated with LA myocardial fibrosis, stroke/transient ischemic attack in patients with AF, and development of heart failure 6-9. The present study therefore aimed to clarify whether the feature tracking LA strain and LV strain derived from a single clinical CMR study could detect the changes in the remodeling of the left atrium and ventricle in the AF.Method
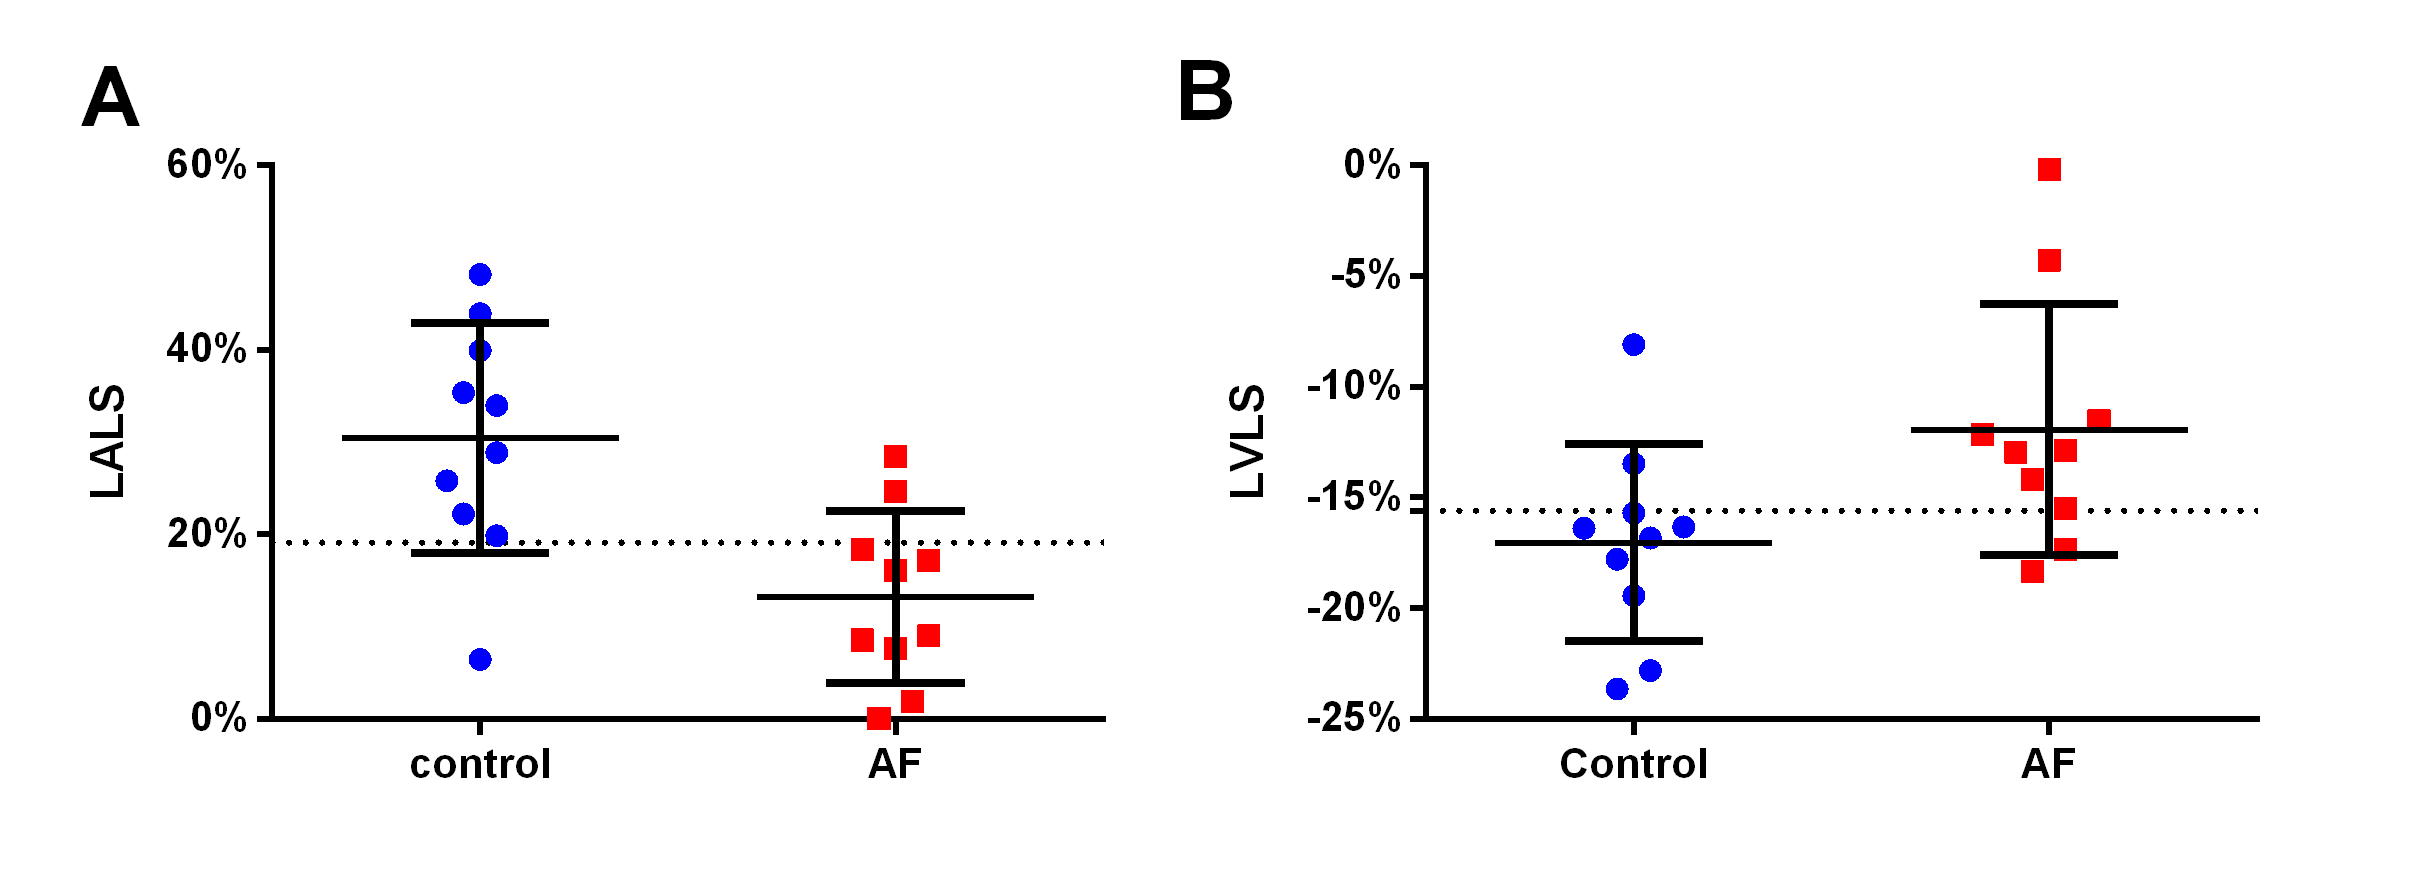
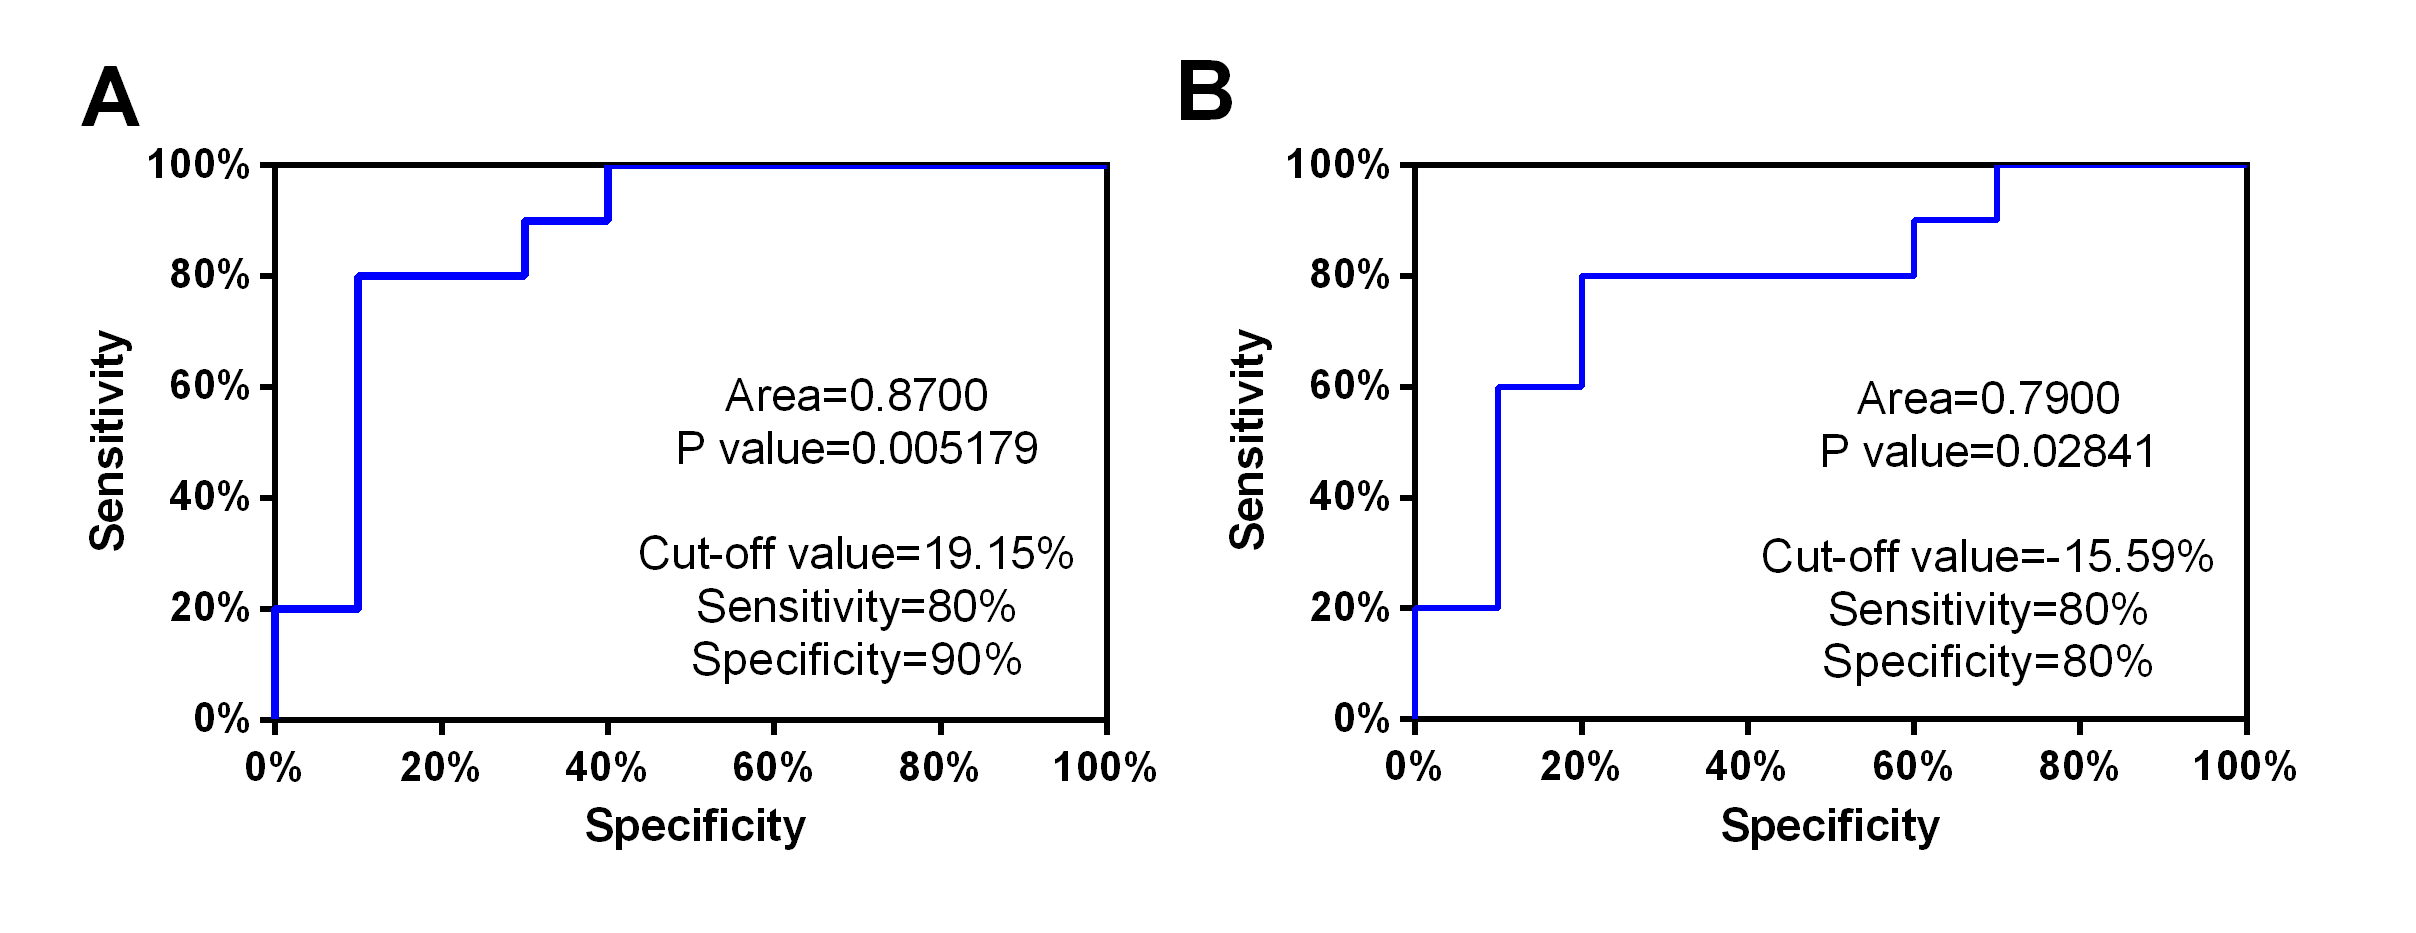
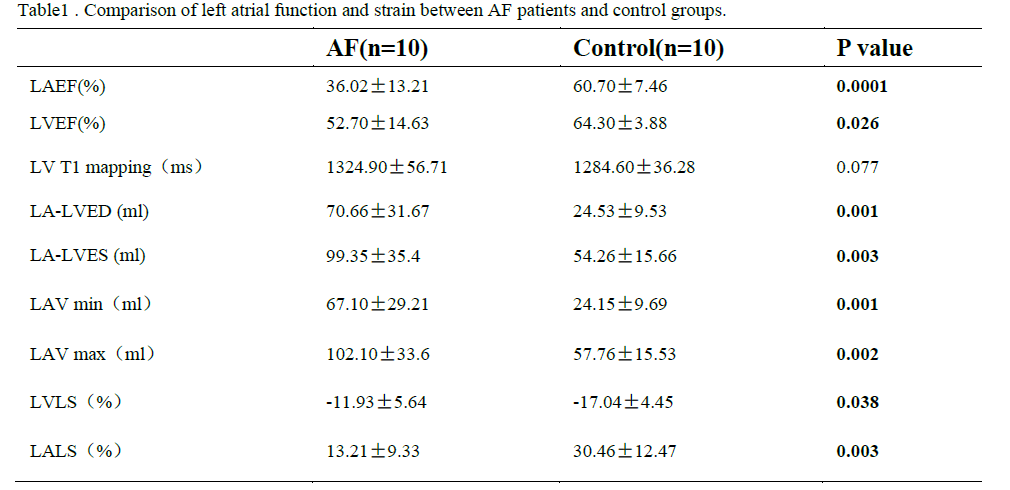
Patients with atrial fibrillation, which was clinical confirmed by physical examination and electrocardiogram, and healthy volunteers were recruited from April to October of 2021. All CMR examinations were performed at a 3.0T MRI (Ingenia 3.0T DNA, Philips Healthcare the Netherlands) using a 32-channel phased-array abdomen coil. Steady-state free-precession (SSFP) cine images were used to obtain four-chamber and two-chamber view for calculating LA longitudinal strain. And modified Look-Locker inversion recovery imaging (MOLLI) was performed for T1 mapping of left ventricular (LV) short-axis. CVI software (version 5.13.5, Circle Cardiovascular Imaging, Calgary, Canada) was used for post-processing to analyze the functional parameters. Endocardial borders of LA, Endo- and epicardial borders of LV were contoured at the two-chamber and four-chamber heart levels, respectively(Shown in Figure 1). All data were analyzed by using statistical software SPSS 25.0. Normality of data was tested using Shapiro-Wilk test. Data satisfying normal distribution and homogeneity of variance was performed using independent-Student T test. Receiver operating characteristic (ROC) curves were used to evaluate the diagnostic efficiency of different parameters. Result: Ten patients with AF (age,48±14.65 years; 70% male) and ten healthy volunteers (age,38.9±10.44 years; 60% male) were finally recruited in this study. The results showed that the left ventricle ejection fraction(LVEF), left atrial emptying fraction (LAEF)( 36.02±13.21 vs. 60.7±7.46%, p=0.0001), left ventricle longitudinal strain (LVLS) (-11.93±5.64 vs. -17.04±4.45%, p=0.038), left atrial longitudinal strain(LA LS)(13.21±9.33 vs. 30.46±12.47%, p=0.003) in AF patients were all reduced compared with the healthy control group (Table 1). Both minimum and maximum left atrial volume (LAV min and LAV max) were higher than those of the control group when compared with AF patients. However there was no statistically significant for the T1 values between these groups. Furthermore, the area under the curves (AUCs) of LALS and LVLS were 0.87 and 0.79, the sensitivity of them were 80%, 80% and the corresponding specificity were 90% and 80%, respectively (p<0.05) (Figure3).Discussion
Despite an intensive investigation into AF, the previous CMR studies regarding AF evaluated LA remodeling and LV remodeling separately, while our study evaluated LA remodeling and LV remodeling concurrently in a single clinical CMR examination. The results of this study showed that compared with healthy volunteers, there is a significant difference between LVLS and LALS in patients with atrial fibrillation. This may be due to the remodeling of the left atrium in patients with atrial fibrillation, which leads to impaired function and myocardial injury. In addition, longitude strain of LV and LA is of high value in the differential diagnosis between with and without AF groups. That means these parameters can accurately identify myocardial changes in patients with atrial fibrillation and can be used as a sensitive imaging marker for detecting myocardial changes. In the future, more data is needed to further study the value of quantitative parameters in evaluating patients with atrial fibrillation.Conclusion
CMR-FT derived atrial deformation quantification can be a promising novel approach for the study of atrial performance in AF groups.Acknowledgements
No acknowledgement found.References
1. Chugh SS, Havmoeller R, Narayanan K, et al. Worldwide epidemiology of atrial fibrillation: a Global Burden of Disease 2010 Study. Circulation. 2014;129(8):837-847.
2. Staerk L, Sherer JA, Ko D, Benjamin EJ, Helm RH. Atrial Fibrillation: Epidemiology, Pathophysiology, and Clinical Outcomes. Circ Res. 2017;120(9):1501-1517.
3. Flett AS, Hayward MP, Ashworth MT, et al. Equilibrium contrast cardiovascular magnetic resonance for the measurement of diffuse myocardial fibrosis: preliminary validation in humans. Circulation. 2010;122(2):138-144.
4. Bellenger NG, Burgess MI, Ray SG, et al. Comparison of left ventricular ejection fraction and volumes in heart failure by echocardiography, radionuclide ventriculography and cardiovascular magnetic resonance; are they interchangeable?. Eur Heart J. 2000;21(16):1387-1396.
5. Militaru S, Panovsky R, Hanet V, et al. Multivendor comparison of global and regional 2D cardiovascular magnetic resonance feature tracking strains vs tissue tagging at 3T. J Cardiovasc Magn Reson. 2021;23(1):54. Published 2021 May 13.
6. Li L, Chen X, Yin G, et al. Early detection of left atrial dysfunction assessed by CMR feature tracking in hypertensive patients. Eur Radiol. 2020;30(2):702-711.
7. Habibi M, Chahal H, Opdahl A, et al. Association of CMR-measured LA function with heart failure development: results from the MESA study. JACC Cardiovasc Imaging. 2014;7(6):570-579.
8. Inoue YY, Alissa A, Khurram IM, et al. Quantitative tissue-tracking cardiac magnetic resonance (CMR) of left atrial deformation and the risk of stroke in patients with atrial fibrillation. J Am Heart Assoc. 2015;4(4):e001844. Published 2015 Apr 27.
9. Yamada A, Hashimoto N, Fujito H, et al. Comprehensive assessment of left atrial and ventricular remodeling in paroxysmal atrial fibrillation by the cardiovascular magnetic resonance myocardial extracellular volume fraction and feature tracking strain. Sci Rep. 2021;11(1):10941. Published 2021 May 25.
Figures

Figure 1. A-D presented with two-chamber heart, four-chamber heart, longitudinal strain, and left ventricular T1 mapping of AF patients. E-H presented with two-chamber heart, four-chamber heart, longitudinal strain, and left ventricular T1 mapping of control group.