4122
Relationship between Infarct size, strain and infarct site in patients with ST-segment elevation myocardial infarction1Department of Radiology, the First Medical center, Chinese People's Liberation Army Hospital, Beijing, China., Beijing, China, 2Department of Cardiology, The Six Medical Center, Chinese People's Liberation Army Hospital , Beijing, China., Beijing, China, 3Philips Healthcare, Beijing, China, Beijing, China
Synopsis
Effective risk assessment and stratification are essential for the clinical management of ST-segment elevation myocardial infarction (STEMI) patients. CMR imaging has become a beneficial imaging modality to assess myocardial morphology, function and infarct characteristics simultaneously. This study quantitatively evaluated the relationship between infarct size, regional myocardial function by cardiac magnetic resonance feature tracking strain analysis and infarct location in patients with STEMI treated by primary percutaneous coronary intervention. Our data showed that myocardial damage was more extensive and regional myocardial function in infarct zone was lower in the anterior wall myocardial infarction group compared to non-anterior wall myocardial infarction group.
Introduction
Effective risk assessment and stratification are essential for the clinical management of ST-segment elevation myocardial infarction (STEMI) patients1-3. Previous studies have shown that patients with anterior wall myocardial infarction (AWMI) are at a higher risk of adverse cardiac remodeling and have a worse prognosis than those with nonanterior wall myocardial infarction (NAWMI)4. Cardiac magnetic resonance (CMR) imaging has become a beneficial imaging modality due to its ability to assess myocardial morphology, function and infarct characteristics simultaneously5,6. In recent years, myocardial strain derived from cardiac magnetic resonance feature tracking (CMR-FT) from standard cine images is a new tool for evaluating cardiac deformation7. However, data regarding left ventricular (LV) strain derived from CMR-FT in STEMI patients are scarce. Hence, strain characteristics between the AWMI and NAWMI groups are still largely unclear. This study aims to quantitatively evaluate the relationship between infarct size, regional myocardial function by CMR-FT strain analysis and infarct location in patients with STEMI treated by primary percutaneous coronary intervention (PCI).Materials and Methods
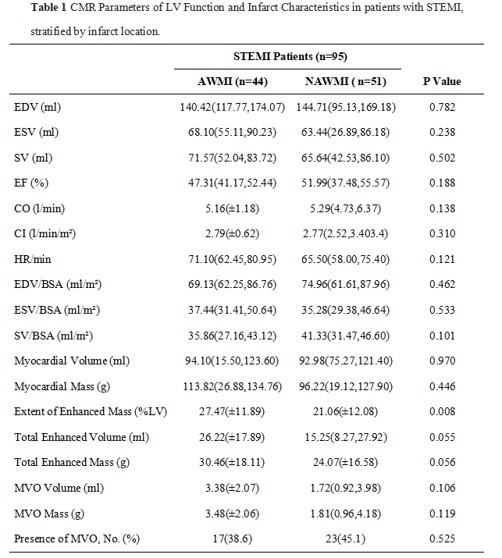
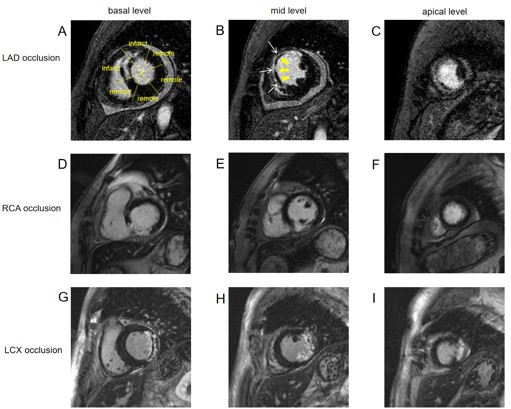
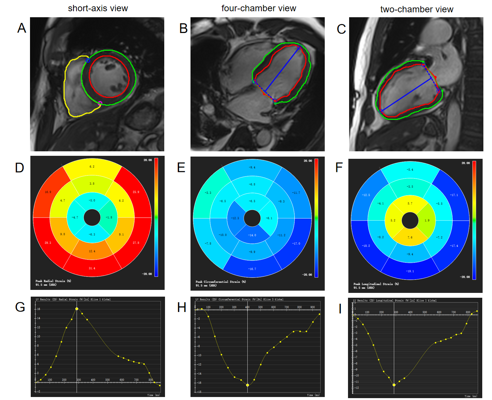
CMR images were retrospectively studied in 95 STEMI patients with successful reperfusion (mean age: 54.73±10.74 years, 83 males). The patients were divided into AWMI and NAWMI groups according to the infarct location. CMR scans were performed on 1.5T MR scanner (Multiva, Philips Medical Systems, Netherlands) with a 18-element-body phased-array coil. Cardiac function was evaluated by balanced turbo field echo (BTFE) cine sequence at the continuous short-axis covering the whole left ventricle (LV) and the long-axis (2/3/4 chamber) views under breath-holding. Imaging parameters included TR/TE 3.7/1.8ms, in-plane resolution 1.4 × 1.4mm2, flip angle 60° and slice thickness 8mm with 8 to 12 slices gathered on the short-axis. Late gadolinium enhancement (LGE) imaging was performed 10 to 15 minutes after administration of 0.2mmol/kg gadolinium-based contrast agent (Gadopentetate Dimeglumine, BeiLu, Beijing, China) using a segmented phase-sensitive inversion-recovery fast gradient-echo pulse sequence (PSIR). The slice location was consistent with the cine sequence. Other imaging parameters included TR/TE 6.2/3ms, in-plane resolution 1.6×1.65mm2, flip angle 25° and slice thickness 8mm. The parameters of LV volumes and function were calculated using CVI42 (Circle Cardiovascular Imaging, Calgary, Canada), including end-diastolic volume (EDV), end-diastolic volume/body surface area (EDV/BSA), end-systolic volume (ESV), ESV/BSA, Stroke volume (SV), SV/BSA, LVEF, cardiac output (CO), and cardiac index (CI). LGE images were used to assess infarct characteristics including the size of the infarct yocardium and microvascular obstruction (MVO). Global and regional strains and associated strain rates in radial, circumferential and longitudinal directions were assessed by CMR-FT from cine images using an automated feature-tracking post-processing method. Firstly, the epicardial and endocardial contours of the LV myocardium in end-systolic and end-diastolic phases were traced. Epicardial and endocardial borders were automatically propagated to the other phases by the software. Then, the strain in radial, circumferential and longitudinal directions was recorded at global and segmental levels and plotted against time (Figure 1). Shapiro-Wilk test was used to assess the normality of continuous variables. Continuous variables between groups were compared using t-test, one-way ANOVA, Kruskal-Wallis H test, as appropriate. Categorical variables were compared using chi-square test. Spearman or Pearson correlation coefficients were calculated between continuous variables, as appropriate. P<0.05 was considered statistically significant.Results
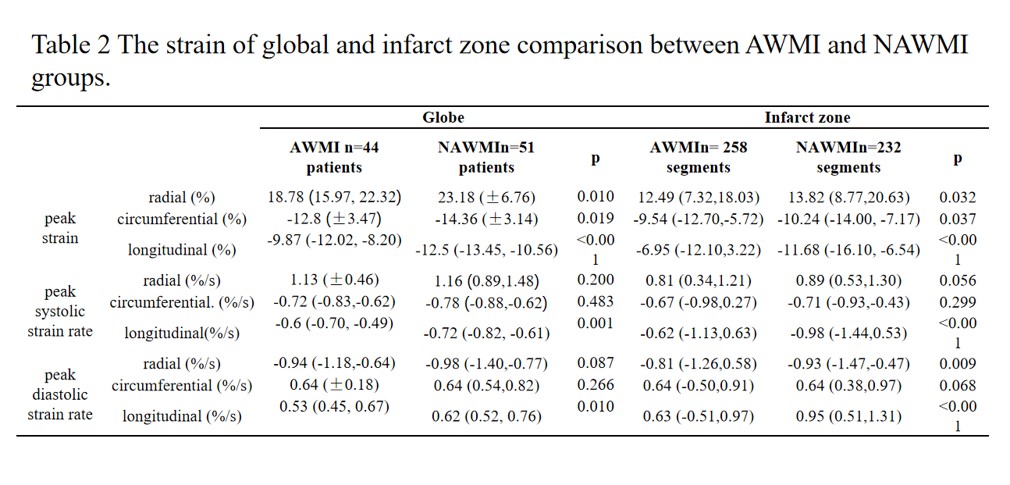
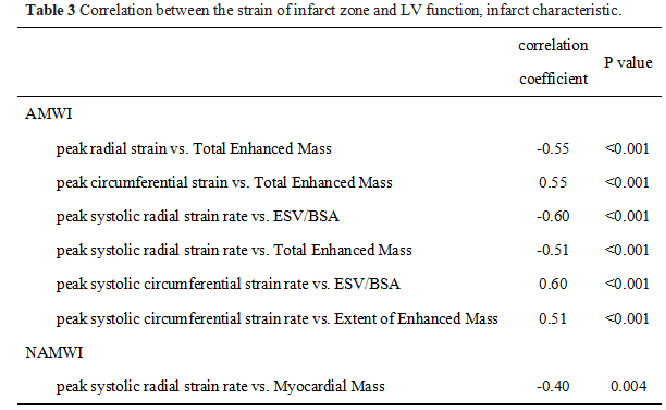
There were 44 patients in AWMI group and 51 patients in NAWMI group. Patients with AWMI had significantly larger extent of enhanced mass of LV compared with those with NAWMI (Table 1, P=0.008). The AWMI group had greater enhanced volume and mass, and MVO volume and mass than the NAWMI group (Table 1). Figure 2 further presented the distribution of patients according to infarct location, stratified by the extent of enhanced mass of LV. The absolute values of peak globe strain in radial, circumferential and longitudinal directions in the AWMI group were significantly lower than those in the NAWMI group (Table 2, P=0.010, P=0.019 and P<0.001, respectively). The absolute values of peak strain of infarct segments in radial, circumferential and longitudinal directions in the AWMI group showed a remarkable decline compared with the NAWMI group (Table 2, P<0.05). The absolute values of the longitudinal peak strain rate in systole and diastole as well as the radial peak diastolic strain rate were significantly lower in the AWMI group than in the NAWMI group (Table 2, P<0.01). The volume (end-systolic volume/body surface area),total enhanced mass and extent of enhanced mass of LV correlated best with strain of infarct zone in the AWMI group (Table 3, P<0.001, respectively).Conclusions
The main findings of our study can be summarized as follows: (1) The myocardial damage was more extensive in the AWMI group than in the NAWMI group. (2) Most of the parameters regarding strain were lower in the AWMI group compared to the NAWMI patients. (3) The volume,total enhanced mass and extent of enhanced mass of LV had negative correlation with the strain of infarct zone in patients with AWMI. In conclusion, in STEMI patients treated with PCI, myocardial damage was more extensive and regional myocardial function in the infarct zone obtained using CMR-FT technique was lower in the AWMI group compared to NAWMI group.Acknowledgements
No acknowledgement foundReferences
1 Freisinger E, Fuerstenberg T, Malyar NM, et al. German nationwide data on current trends and management of acute myocardial infarction: discrepancies between trials and real-life. Eur Heart J 2014;35:979–88.
2 Roffi M, Patrono C, Collet JP, et al. 2015 ESC Guidelines for the management of acute coronary syndromes in patients presenting without persistent ST-segment elevation: Task Force for the Management of Acute Coronary Syndromes in Patients Presenting without Persistent ST-Segment Elevation of the European Society of Cardiology (ESC). Eur Heart J 2016;37:267–315.
3 O’Gara PT , Kushner FG, Ascheim DD, et al. CF/AHA T ask Force. 2013 ACCF/AHA guideline for the management of ST -elevation myocardial infarction: executive summary: a report of the American College of Cardiology Foundation/American Heart Association T ask Force on Practice Guidelines. Circulation 2013;127:529–555.
4 Stone PH, Raabe DS, Jaffe ASet , et al. Prognostic significance of location and type of myocardial infarction: independent adverse outcome associated with anterior location. J Am Coll Cardiol 1988;11:453-463.
5 Van Kranenburg M, Magro M, Thiele H, et al. Prognostic value of microvascular obstruction and infarct size, as measured by CMR in STEMI patients. JACC Cardiovasc Imaging 2014;7:930–939.
6 Backhaus SJ, Kowallick JT, Stiermaier T, et al. Culprit vessel-related myocardial mechanics and prognostic implications following acute myocardial infarction. Clin Res Cardiol 2019;109:339–349.
7 Bodi V. Strain by feature tracking: a short summary of the journey of CMR in STEMI. JACC Cardiovasc Imaging 2019;12:1199–1201.
Figures