4121
Motion Correction for Myocardial T1 Mapping using Self-supervised Deep Learning Registration with Contrast Separation
Yuze Li1, Chunyan Wu1, Haikun Qi2, Dongyue Si1, Haiyan Ding1, and Huijun Chen1
1Center for Biomedical Imaging Research, School of Medicine, Tsinghua University, Beijing, China, 2School of Biomedical Engineering, ShanghaiTech University, Shanghai, China
1Center for Biomedical Imaging Research, School of Medicine, Tsinghua University, Beijing, China, 2School of Biomedical Engineering, ShanghaiTech University, Shanghai, China
Synopsis
A motion correction method for myocardial T1 mapping using Self-supervised Deep learning based Registration with contrAst seParation (SDRAP) was proposed. A sparse coding based method was firstly proposed to separate the contrast component from T1w images. Then, a self-supervised deep neural network was developed to register contrast separated images, followed by the signal fitting to generate motion corrected T1 maps. Models were trained and tested in 47 healthy volunteers using MOLLI sequence, and compared with Free Form Deformation method. Results showed the proposed method can achieve better performance in registration and T1 mapping with higher efficiency (7x acceleration).
Introduction
Myocardial T1 mapping is a widely used technique for diagnosis of diffuse myocardial diseases 1-3. Modified Look-Locker Inversion recovery protocol (MOLLI) 4 is one of the most representative imaging protocols. Although it can provide clinically usable T1 quantification results, motion artifacts appeared in T1 maps are nearly inevitable, thus affecting accuracy of the disease diagnosis 5. Researchers have developed motion correction methods to eliminate the misalignment of pixels in T1w image series, thus generating high-quality T1 maps without artifacts 6-8. However, the potential of self-supervised deep learning along with the contrast separation in motion correction in T1 mapping remains to be proved.Methods
Contrast SeparationIn T1 mapping, high contrast variation and tissue signal nulling bring difficulties in motion correction. Therefore, separation of intensity contrast and tissue structure may help the following registration of T1w image series. The workflow of contrast separation is shown in Fig. 1.
Based on the sparse coding theory, ideal time intensity curves $$$p\in\mathbb{R}^{T\times2}$$$ of myocardium and blood pool can be coded using the dictionary $$$D$$$ and coefficient map $$$c$$$. $$$D\in\mathbb{R}^{T\times M}$$$ was a dictionary generated by the combination of $$$T$$$ frames of vectorized T1w image with totally $$$M$$$ voxels. Coefficient map $$$c\in\mathbb{R}^{M\times2}$$$ can be used to estimate the intensity contribution of the corresponding area. $$$c$$$ had two columns which denoted the two subspaces representing myocardium and blood pool.
Specifically, c can be solved by the following formula:
$$\hat{c}=argmin_{c}\frac{1}{2}\parallel p-Dc\parallel _2^2+λ\parallel c\parallel_{1}$$
when the coefficient map $$$c$$$ was obtained, the rescaled time intensity curve $$$r\in\mathbb{R}^{T\times2}$$$ was multiplied with $$$c$$$ pixel-by-pixel to generate the contrast variation components, and then subtracted from the original T1w images to form contrast separated images.
Self-supervised Deep Learning for Image Registration
A self-supervised deep learning based 9 image registration method was used to perform the pair-wise motion correction. Assume $$$f$$$ and $$$m$$$ denoted the target and moving image, and let $$$\psi$$$ denoted the deformation field. Registration process can be defined as the following optimization problem:
$$\hat{\theta}=argmin_{θ}\mathcal{L}_{sim}(f,R(m,G_{θ}(f,m)))+η\mathcal{L}_{smooth}(ψ)$$
where $$$\mathcal{L}_{sim}$$$ denoted a similarity measurement between the target image and warped image, $$$\mathcal{L}_{smooth}$$$ denoted a smoothness regularization, $$$\mathcal{R}$$$ denoted the wrap function that applied deformation field $$$\psi$$$ on the input image to obtain the spatial transformed image. $$$\psi$$$ was generated by a neural network $$$G_\theta$$$ parameterized with $$$\theta$$$. The hyperparameter $$$\eta$$$ was empirically set to 0.5. The DenseAttention U-Net 10 was used to perform the deformation field generation.
The whole framework is shown in Fig. 2. We tested two commonly used similarity matrixes which were Cross-Correlation (CC) and Mutual Information (MI). Two models that each combined one of the similarity loss functions were constructed, which were named as SDRAP-CC and SDRAP-MI.
Experiment Setting
A widely used registration method FFD (Free Form Deformation) was used as the compared method. Dice Similarity Coefficient (DSC) and Mean Boundary Error (MBE) were used as indicators to quantitatively evaluate the registration error on T1w images. Standard Deviation (SD) map of T1 quantification was used to evaluate the accuracy of T1 mapping.
An in-vivo cardiac datasets from MOLLI sequence with 47 healthy volunteers containg 921 images were recruited with institutional review board approval. MOLLI sequence was scanned with a 3T MR scanner (Achieva TX, Philips, The Netherlands). MOLLI protocol: TR=2.59 ms, TE=1.31 ms, FA=35o, FOV=300x150 mm2, spatial resolution=1.25x1.25 mm2 and slice thickness=8 mm. Training lasted for 5 hours of 40 epochs with Adam as the optimizer. The learning rate was initially set to 1e-3 and reduced by half every 5 epochs.
Results
As the yellow arrows pointed in Fig. 3, the heart was not aligned to each other during the data acquisition, which showed significant drifting motion among different frames. When the proposed deep learning method was applied, the drifting motion was corrected and the myocardium appeared more stationary after motion correction.Quantitative results are shown in Table 1. The SDRAP-CC can achieve the highest DSC of 84.9±4.2% and the least MBE of 0.94±0.27mm, which was significantly better than uncorrected images (p = 0.011 for DSC and p = 0.003 for MBE). The proposed method was less than FFD that the former can process one slice with only 0.52s, achieving about 7x acceleration compared with FFD (3.7s/slice).
Fig. 4 shows SD maps of T1 mapping and the corresponding quantitative results. SD maps of uncorrected images and after FFD registration had overall higher value than those of SDRAP-MI and SDRAP-CC. In the analysis of blood pool and myocardium region, SDRAP-CC achieved the lowest mean SD of 35.6±18.7ms and 27.2±19.1ms among all methods.
Discussion and Conclusion
The proposed method can achieve better performance in registration and T1 mapping with higher efficiency.Acknowledgements
NoneReferences
- Schelbert EB, Messroghli DR. State of the Art: Clinical Applications of Cardiac T1 Mapping. Radiology 2016;278(3):658-676.
- Haaf P, Garg P, Messroghli DR, Broadbent DA, et al. Cardiac T1 Mapping and Extracellular Volume (ECV) in clinical practice: a comprehensive review. J Cardiovasc Magn R 2016;18.
- Iles L, Pfluger H, Phrommintikul A, et al. Evaluation of Diffuse Myocardial Fibrosis in Heart Failure With Cardiac Magnetic Resonance Contrast-Enhanced T-1 Mapping. J Am Coll Cardiol 2008;52(19):1574-1580.
- Messroghli DR, Radjenovic A, Kozerke S, et al. Modified Look-Locker inversion recovery (MOLLI) for high-resolution T-1 mapping of the heart. Magn Reson Med 2004;52(1):141-146.
- Tilborghs S, Dresselaers T, Claus P, et al. Robust motion correction for cardiac T1 and ECV mapping using a T1 relaxation model approach. Med Image Anal 2019;52:212-227.
- El-Rewaidy H, Nezafat M, Jang J, et al. Nonrigid active shape model-based registration framework for motion correction of cardiac T-1 mapping. Magn Reson Med 2018;80(2):780-791.
- Christodoulou AG, Shaw JL, Nguyen C, et al. Magnetic resonance multitasking for motion-resolved quantitative cardiovascular imaging. Nat Biomed Eng 2018;2(4):215-226.
- Zhu YJ, Kang J, Duan C, et al. Integrated motion correction and dictionary learning for free-breathing myocardial T-1 mapping. Magn Reson Med 2019;81(4):2644-2654.9.
- G. Balakrishnan, A. Zhao, M. R. et al. VoxelMorph: A Learning Framework for Deformable Medical Image Registration. IEEE Transactions on Medical Imaging 2019;38(8):1788-1800.
- Li YZ, Wang YJ, Qi HK, et al. Deep learning-enhanced T-1 mapping with spatial-temporal and physical constraint. Magn Reson Med 2021;10
Figures
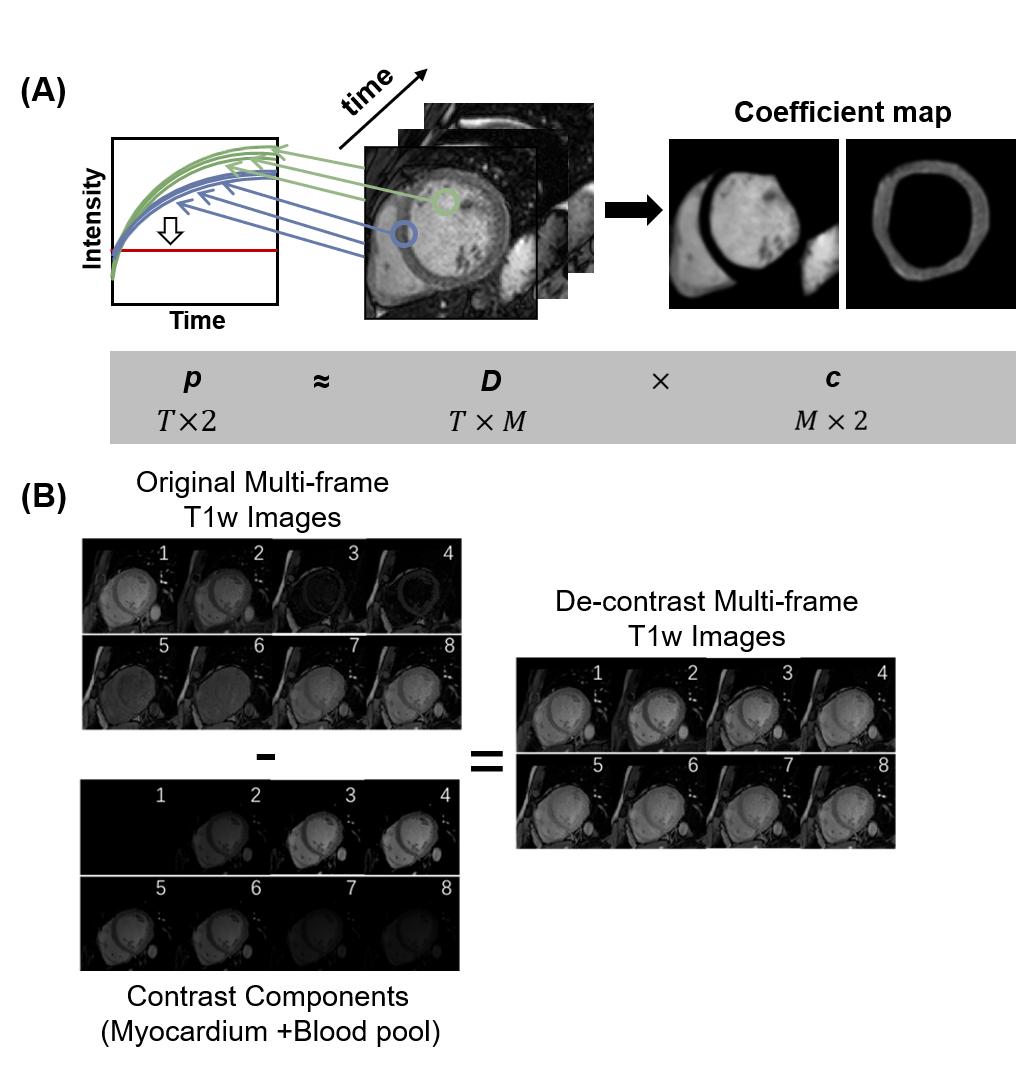
Fig. 1. Contrast Separation for T1w images. (A) Contrast separation based on sparse coding theory. (B) De-contrast images are generated by the original images minus contrast components.
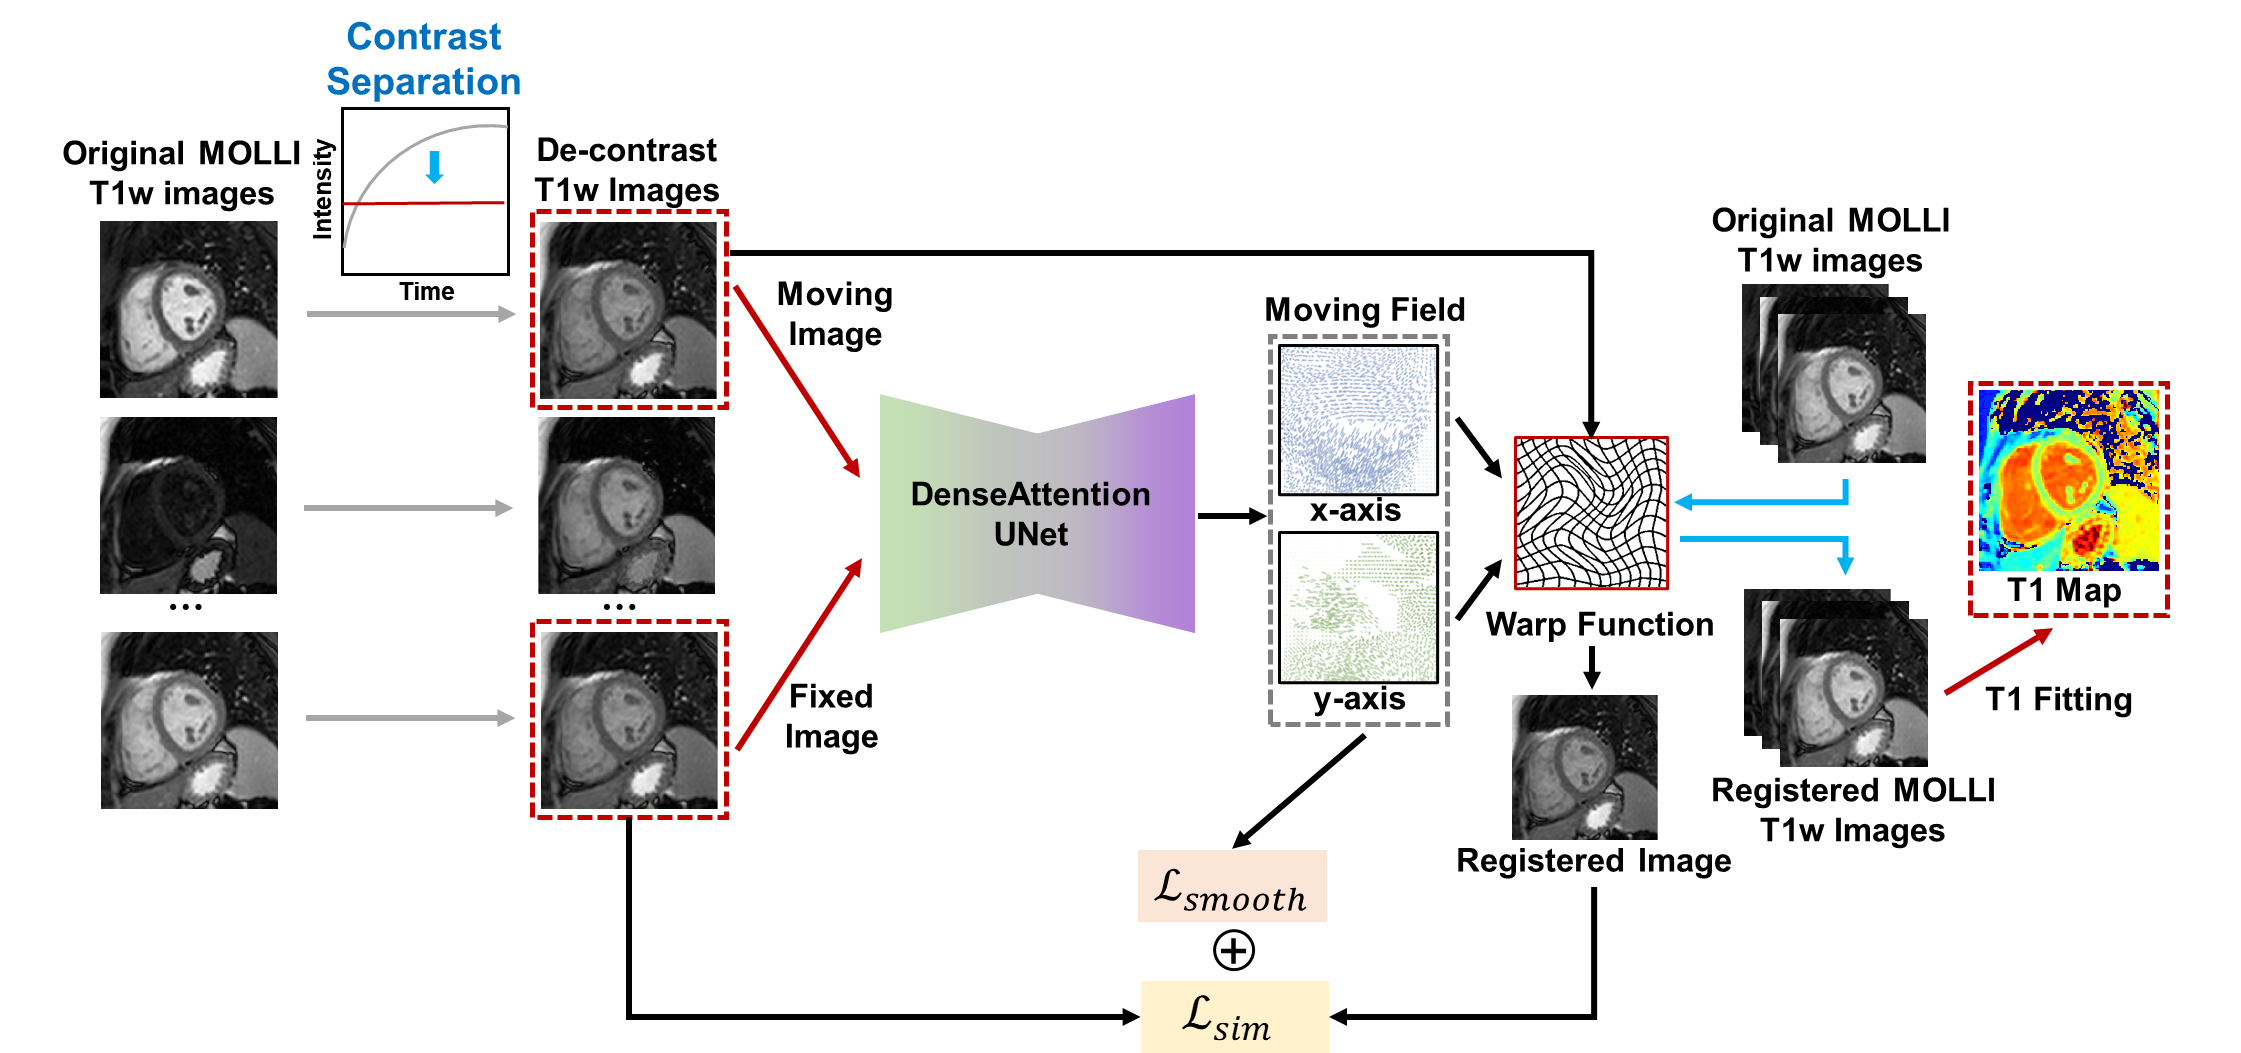
Fig. 2. The framework of the proposed method
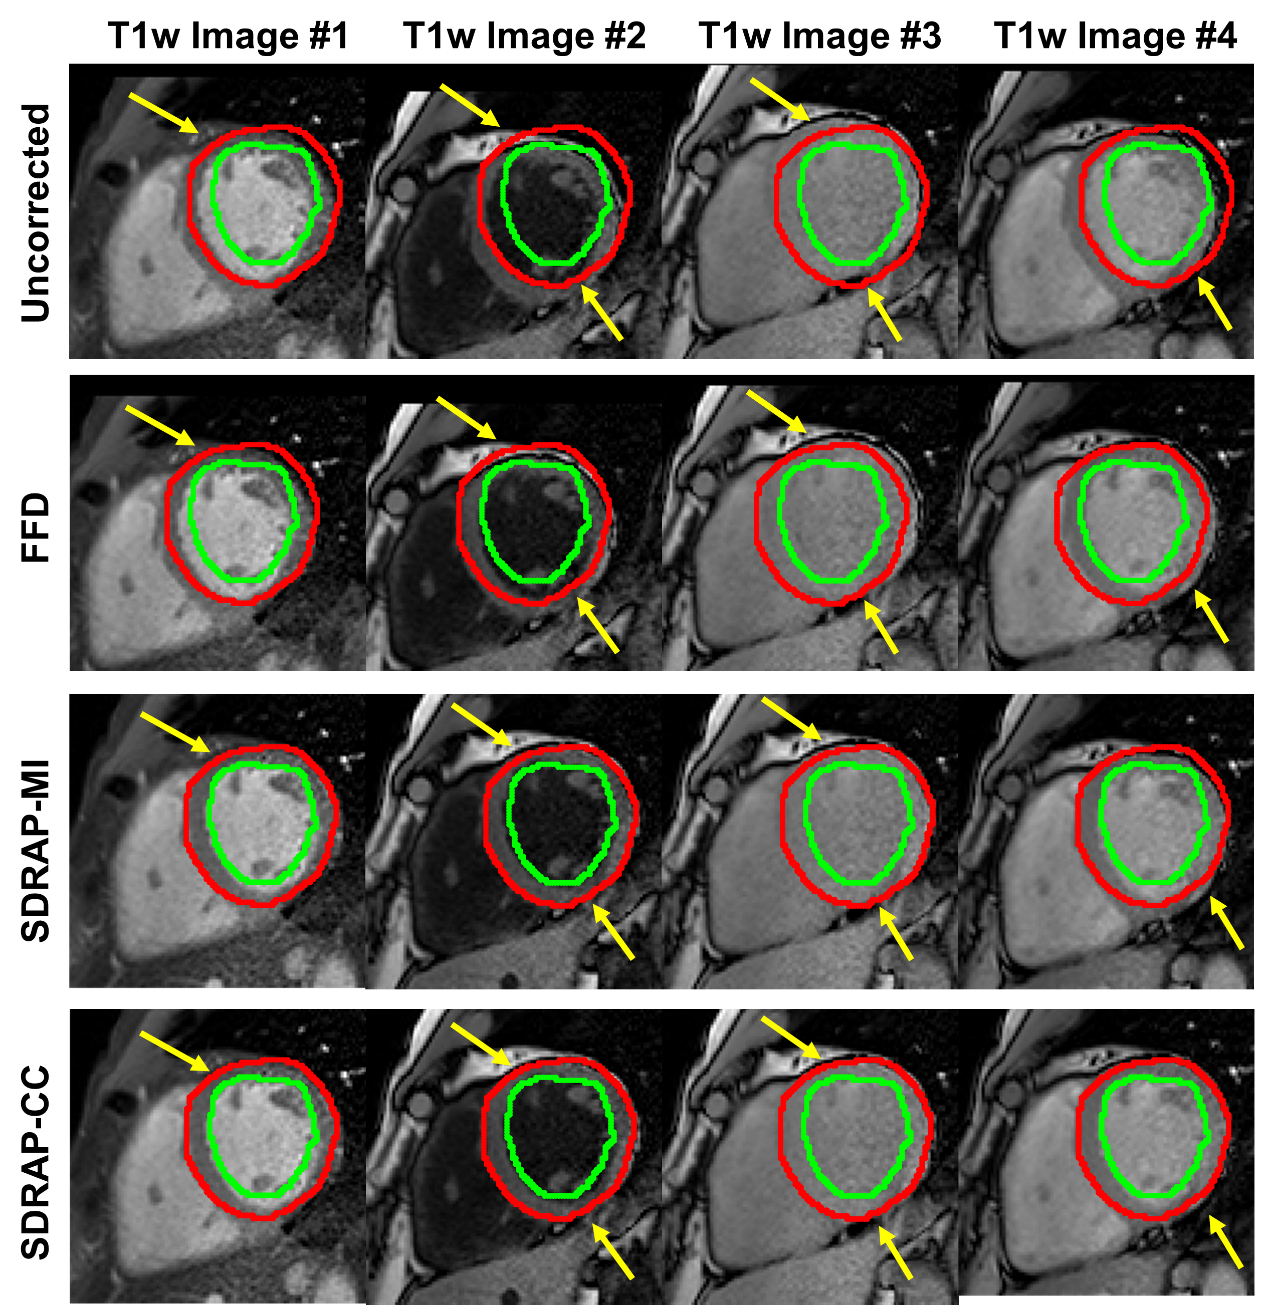
Fig. 3. Motion correction results for different methods on T1w images.
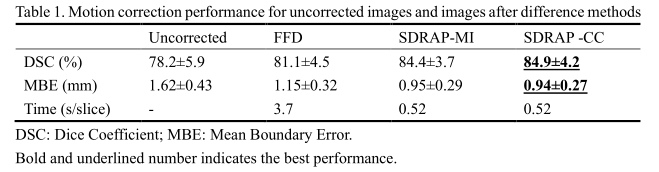
Table 1. Quantitative results for motion correction on T1w images.
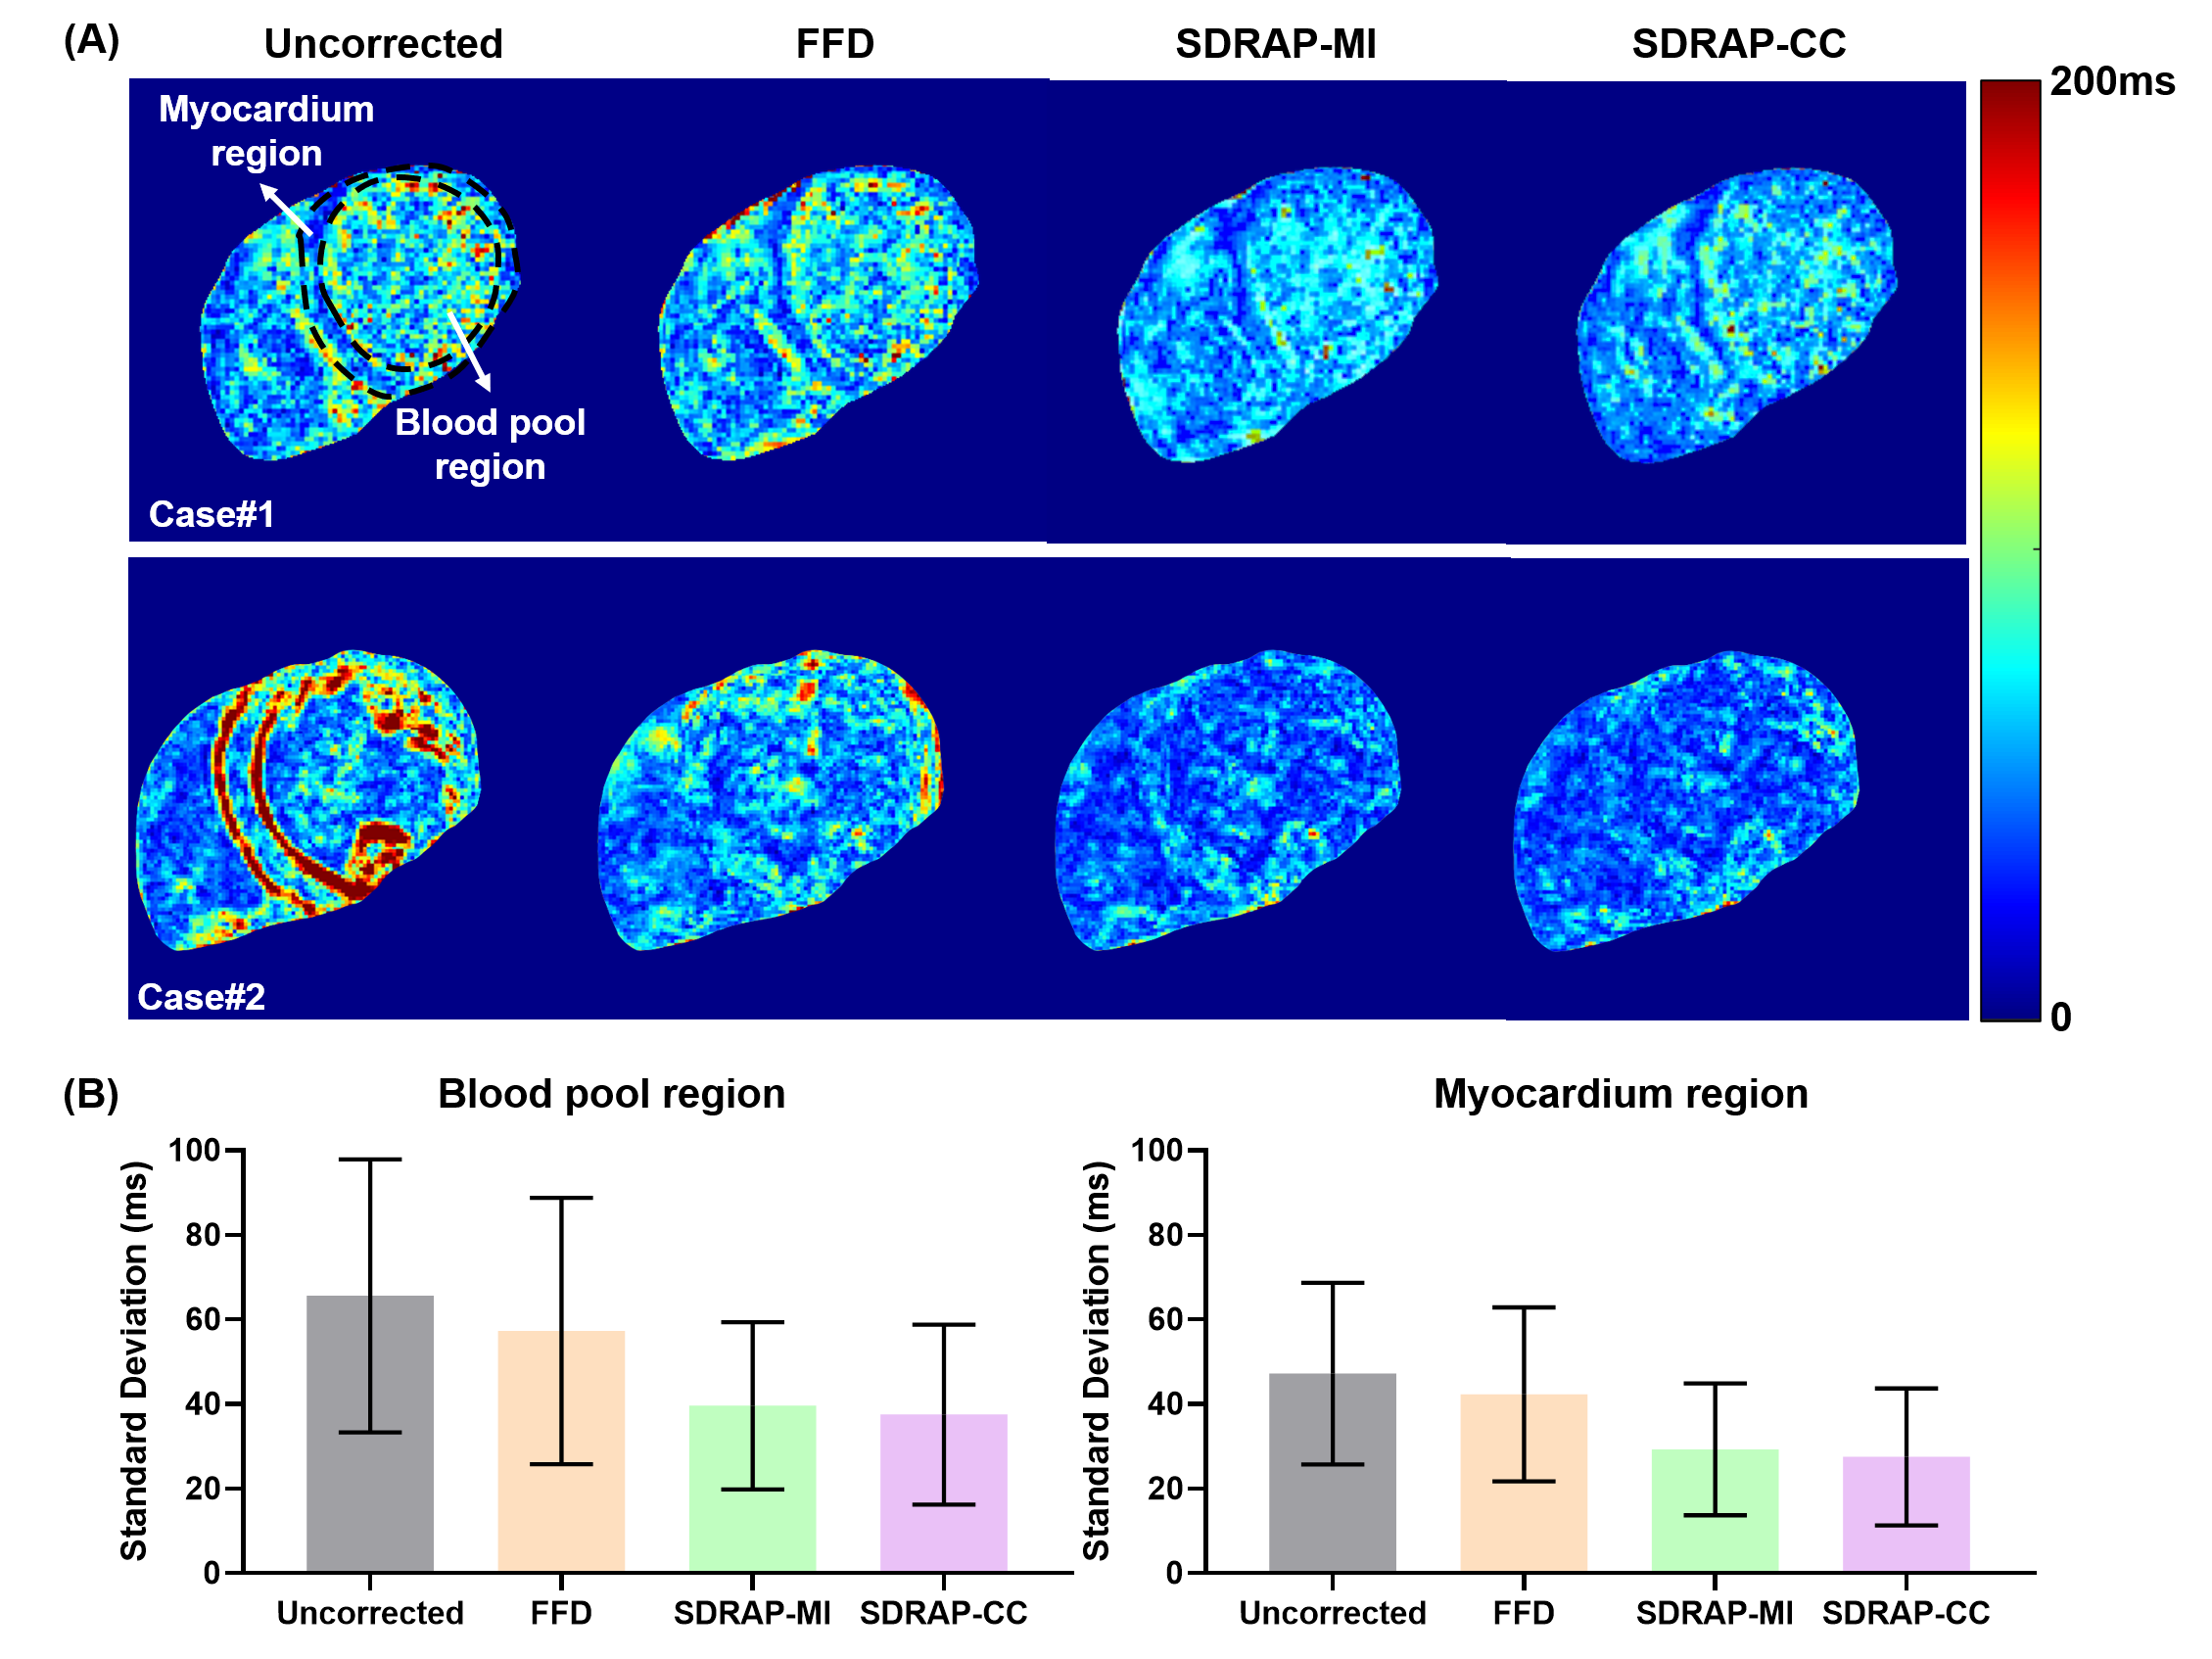
Fig. 4. (A) SD maps of T1 mapping and (B) the corresponding quantitative comparisons.
DOI: https://doi.org/10.58530/2022/4121