4119
Infarct size and strain by cardiac magnetic resonance predict adverse remodeling after ST-segment elevation myocardial infarction1Department of Radiology, the First Medical center, Chinese People's Liberation Army Hospital, Beijing, China., Beijing, China, 2Philips Healthcare, Beijing, China, Beijing, China
Synopsis
Over the past few decades, all-cause mortality and cardiovascular events have remained high in ST-segment elevation myocardial infarction (STEMI) patients. One of the reasons for this is that adverse LV remodeling of the heart that occurs in many patients after myocardial infarction. Cardiac magnetic resonance (CMR) imaging has become a beneficial imaging modality to assess myocardial morphology, LV function and infarct characteristics simultaneously. This study analyzed the value of LV volumes, LV function and infarct characteristics by CMR predicting adverse LV remodeling after STEMI. Our data showed that total enhanced volume was the most accurate prediction parameter.
Introduction
Over the past few decades, clinical outcomes of patients with ST-segment elevation myocardial infarction (STEMI) have improved significantly.1 However, all-cause mortality and cardiovascular events have remained high in STEMI patients.2 One of the main reasons is the adverse LV remodeling of the heart occurs in many patients after infarction. Early understanding of adverse LV remodeling after STEMI is important for clinical management of patients.3 Cardiac magnetic resonance feature tracking (CMR-FT) is a new post-processing technique that provides myocardial strain parameters, with the advantages of not requiring additional sequences and a relatively short post-processing time.4 So far, there were fewer studies about the role of CMR parameters, particularly the global and regional LV strain and strain rate, in predicting adverse LV remodeling in patients after STEMI. The purpose of this study is to analyze LV volume, LV function and infarct characteristics by CMR for the prediction of adverse LV remodeling post-STEMI.Materials and Methods
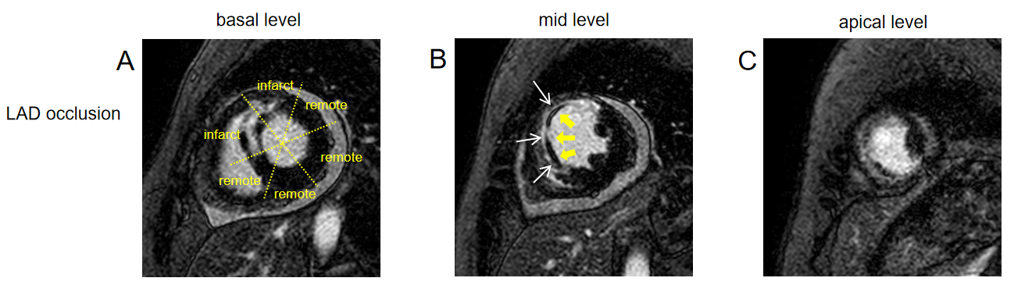
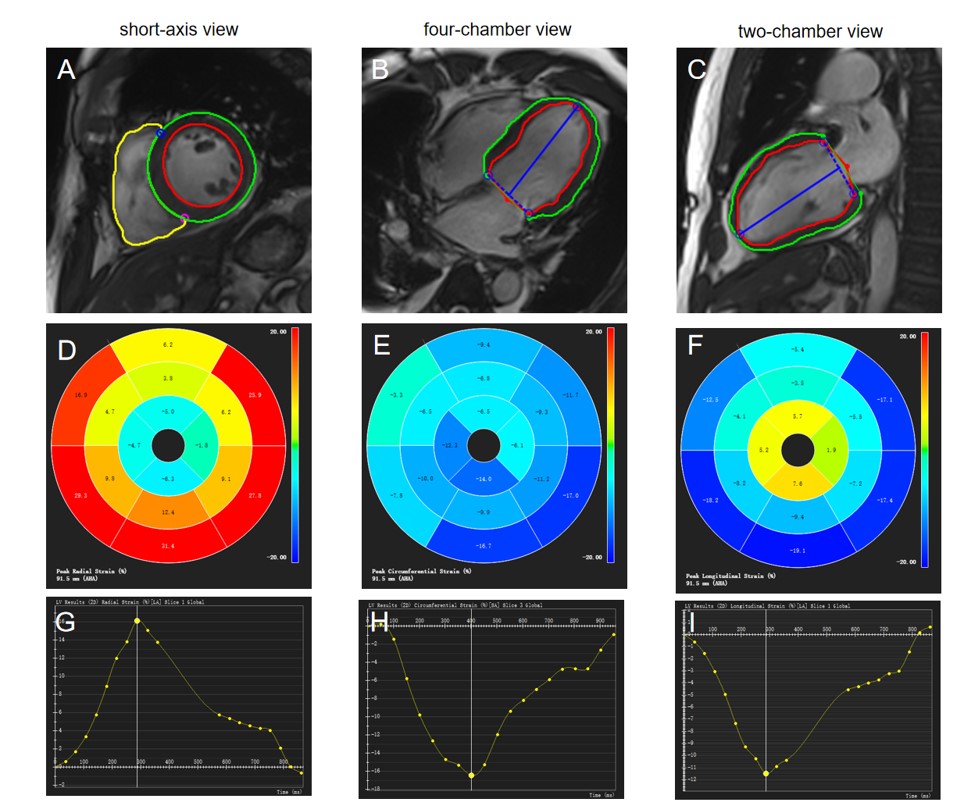
Eighty-six STEMI patients were included in this study: 25 subjects with adverse LV remodeling (23 males; mean age±standard deviation: 55±12) years), 61 subjects with no adverse LV remodeling (53 males; 56±12 years). Adverse LV remodeling following STEMI has been defined as ≥ 15% increase in LV end-systolic volume (LVESV) from baseline. The patients were scanned on a 1.5 T scanner (Multiva, Philips Medical Systems, Netherlands) 5-day and 5-month after successful percutaneous coronary intervention (PCI) treatment. Cardiac function was evaluated by balanced turbo field echo (BTFE) cine sequence at the continuous short-axis covering the whole left ventricle (LV) and the long-axis (2/3/4 chamber) views under breath-holding. Imaging parameters included TR/TE 3.7/1.8ms, in-plane resolution 1.4 × 1.4mm2, flip angle 60° and slice thickness 8mm with 8 to 12 slices gathered on the short-axis. Late gadolinium enhancement (LGE) imaging was performed 10 to 15 minutes after administration of 0.2mmol/kg gadolinium-based contrast agent (Gadopentetate Dimeglumine, BeiLu, Beijing, China) using a segmented phase-sensitive inversion-recovery fast gradient-echo pulse sequence (PSIR). The slice location was consistent with the cine sequence. Other imaging parameters included TR/TE 6.2/3ms, in-plane resolution 1.6×1.65mm2, flip angle 25° and slice thickness 8mm. All CMR parameters of LV volume and function were retrospectively analyzed using dedicated software (cvi42 v5.3, Circle Cardiovascular Imaging, Calgary, Canada), which was completed by experienced operators without knowledge of the clinical data. LV volumes and functional parameters were derived from the analysis of cine sequences, which included parameters such as including end-diastolic volume (EDV), end-diastolic volume/body surface area (EDV/BSA), end-systolic volume (ESV), ESV/BSA, Stroke volume (SV), SV/BSA, LVEF, cardiac output (CO), and cardiac index (CI). Infarct characteristics were assessed by analysing Late gadolinium enhancement (LGE) sequences. The LV myocardium is divided into the infarct zone and the remote zone. The infarct area was defined as the area of culprit artery perfusion. The remote zone was defined as a myocardial segment in the opposite side of the infarct area without significant hyperenhancement. Microvascular obstruction (MVO) was defined on the LGE images as hypointense area within the hyperenhanced myocardium (Figure 1). MVO area was included in the infarct area. Global and regional strains and associated strain rates in radial, circumferential and longitudinal directions were assessed by CMR-FT from cine images using feature-tracking post-processing method (Figure 2). Logistic regression was used to identify factors associated with adverse LV remodeling.Results
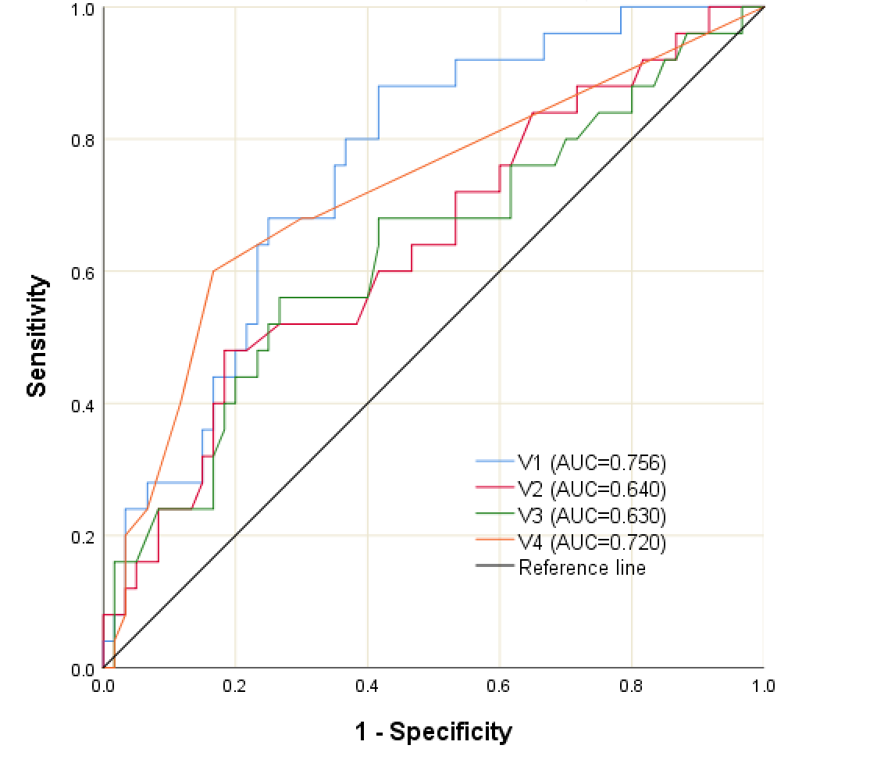
In univariable logistic regression analysis, total enhanced volume and mass, MVO volume and mass, extent of enhanced and MVO volume of LV, the peak globe diastolic strain rate in radial and circumferential directions and peak systolic circumferential strain rate of the remote zone showed significant predictive associations with the adverse LV remodeling (Table 1, p <0.05). Multivariate logistic regression with the backward stepwise method was used to identify the predictors of adverse LV remodeling. The variables with p < 0.05 in univariate analysis were included in the multivariable model. In multivariable logistic regression analysis, total enhanced volume (Table 1, odds ratio: 1.11[1.04–1.19], p=0.002), extent of MVO volume of LV (Table 1, odds ratio: 74.33[6.56–842.04], p = 0.001), peak diastolic radial strain rate (Table 1, odds ratio: 14.65 [2.32–92.70], p=0.004), peak systolic circumferential strain rate of remote zone (Table 1, odds ratio: 0.004[0.00–0.16], p = 0.003) were independent predictors of adverse LV remodeling. In the ROC analyses, total enhanced volume was the most accurate diagnostic parameter for adverse LV remodeling with an optimal cut-off of 25.76 (AUC = 0.756, 95% CI = 0.65–0.86, sensitivity = 88.0%, specificity = 58.3%, p < 0.001) (Figure 3).Conclusions
This CMR study demonstrates that infarct characteristics and the global and regional strain and strain rates of LV are independent predictive of adverse LV remodeling in STEMI patients treated with primary PCI. However, total enhanced volume was the most accurate diagnostic parameter for adverse LV remodeling with an optimal cutoff of 25.76. Together, these results provide new insights into early risk stratification in acute STEMI survivors and suggest the important role of CMR.Acknowledgements
No acknowledgement foundReferences
1 Neumann, J. T., Goßling, A., Sörensen, N. A., Blankenberg, S., Magnussen, C., & Westermann, D. (). Temporal trends in incidence and outcome of acute coronary syndrome. Clinical research in cardiology : official journal of the German Cardiac Society 2020;109:1186–1192.
2 Westman PC, Lipinski MJ, Luger D, et al. Inflammation as a driver of adverse left ventricular remodeling after acute myocardial infarction. J Am Coll Cardiol 2016;67:2050–60.
3 Ponikowski P, Voors AA, Anker SD, et al. 2016 ESC Guidelines for the diagnosis and treatment of acute and chronic heart failure: The Task Force for the diagnosis and treatment of acute and chronic heart failure of the European Society of Cardiology (ESC). Developed with the special contribution of the Heart Failure Association (HFA) of the ESC. Eur J Heart Fail 2016 ;18:891–975.
4 Schuster A, Hor KN, Kowallick JT, Beerbaum P, Kutty S.Cardiovascular magnetic resonance myocardial feature tracking: concepts and clinical applications. Circ Cardiovasc Imaging 2016;9:e004077.
Figures