4118
Diagnostic value of diffusion-weighted MR imaging in acute myocardial infarction
Zhenfeng Lv1, Lianming Wu2, Jilei Zhang3, Weibo Chen3, and Haikun Qi1
1School of Biomedical Engineering, ShanghaiTech University, Shanghai, China, 2Department of Radiology, Renji Hospital, School of Medicine, Shanghai Jiao Tong University, Shanghai, China, 3Philips Healthcare, Shanghai 200040, P. R. China, Shanghai, China
1School of Biomedical Engineering, ShanghaiTech University, Shanghai, China, 2Department of Radiology, Renji Hospital, School of Medicine, Shanghai Jiao Tong University, Shanghai, China, 3Philips Healthcare, Shanghai 200040, P. R. China, Shanghai, China
Synopsis
Diffusion-weighted imaging (DWI), being able to detect the diffusion of water molecules in the tissue, is one of the potential techniques for the diagnosis of myocardial infarction without contrast agent administration. In this study, we investigated the diagnostic value of the mono-exponential and stretched exponential DWI model in the assessment of acute myocardial infarction. The preliminary results from 10 patients showed that the diffusion parameters were significantly lower in the infarcted region, and both models had capability of diagnosing acute myocardial infarction with the stretched exponential model performing slightly better.
Introduction
Late Gadolinium enhancement (LGE) MRI has become the gold standard for evaluating myocardial infarction (MI) 1. However, contrast injection is not permitted in patients with renal insufficiency, contrast agent alley or other reasons. Diffusion-weighted imaging (DWI) has been used to detect acute stroke 2, and has also shown promising results for diagnosing ischemic or non-ischemic cardiac diseases3-7. So far, various DWI models have been introduced to extract diffusion parameters. The conventional single-exponential apparent diffusion coefficient (ADC) model assumes Gaussian diffusion motion, while the more recent stretched exponential model requires no assumption of Gaussian distribution or tissue compartmentalization and may better reflect tissue characteristics8. However, applicability of these DWI models in the assessment of acute MI remains uninvestigated. The purpose of this study is to investigate retrospectively the diagnostic performance of the ADC and stretched exponential DWI models in the evaluation of acute myocardial infarction.Methods
MR imaging: Ten patients (9 Males, mean age: 56) presenting with recent MI and without any contradictions to LGE MRI were included in this study. The patients were scanned on 3.0T Philips MR scanner with a 32-channel body coil. Cardiac DWI was performed in the short-axis view with a single shot EPI sequence under ECG gating and respiratory navigator. Eight signal averages of images with three diffusion encoding directions were obtained. Other parameters included: TR=3RR intervals, TE=61ms; FA=90°; voxel size=3.5x3.5x8.0mm; bandwidth=2371Hz/pixel; monopolar preparation with b-values of 0, 10, 20, 50, 100, 150, 200, 250 and 500 s/mm2. LGE MRI was also performed to detect the infarcted region. The study was approved by the hospital’s Institutional Review Board and all subjects provided written informed consent.Image analysis: The DWI images were analyzed to obtain myocardial diffusion parameters using the mono-exponential and stretched exponential models. The ADC was calculated using all b values by fitting the mono-exponential model: $$$S(b)/S(0) =exp(-b·ADC)$$$, where $$$S(b)$$$ is the signal intensity at a given b value and $$$S(0)$$$ represents the signal without any diffusion weighting, $$$b$$$ is the b-factor. Using a stretched exponential model (SEM): $$$S(b)/S(0) =exp[(-b·DDC)]^α$$$, the distributed diffusion coefficient (DDC) representing the mean intravoxel diffusion rate and the water molecular diffusion heterogeneity index (α) were calculated using non-linear regression method. After obtaining the diffusion parametric maps, ROIs were drawn for the infarcted region and the remote healthy myocardium in the middle short-axis slice according to the LGE images. Care was taken to not include regions with motion artifacts. The mean and standard variation were calculated for each ROI.
Statistical analysis: The mean DWI parameters obtained using the two DWI models were compared between the infarcted and healthy myocardium using nonparametric Mann-Whitney test because of the small number of patients. A p-value less than 0.05 was considered statistically significant.
Results
Example LGE image and DWI image with b value of 50 s/mm2 as well as the DWI parametric maps for a typical patient with acute MI are shown in Fig. 1. The DWI image shows high signal in the septal left ventricular wall which is the infarcted region as evident by the LGE image. Obviously lower values were observed in the ADC and DDC maps for the MI region, while shows higher values. The comparison of the DWI model parameters for all 10 patients are shown Fig. 2. ADC (1.946±0.452 ×10⁻³mm2/s vs. 2.452±0.331 ×10⁻³mm2/s, p=0.014) and DDC (1.395±0.514 ×10⁻³mm2/s vs. 2.327±0.384 ×10⁻³mm2/s, p<0.001) are significantly lower in the MI region than in the remote normal myocardium, while tends to be higher in the MI but the difference was not significant (0.6674±0.1206 ×10⁻³mm2/s vs. 0.5681±0.1902 ×10⁻³mm2/s, p=0.1801).Discussion
This study showed that the DWI parameters from the conventional ADC model and the stretched exponential model both had capability of diagnosing acute myocardial infarction without contrast administration. The conventional ADC model assumes Gaussian diffusion motion, while the stretched exponential model adds an additional parameter to consider the heterogenous diffusion in each voxel8, which reflects more realistic physiological characteristics and should perform better in differentiating the infarcted and healthy myocardium. Therefore, more patients with acute MI will be recruited to compare the diagnostic performance of the ADC model and the stretched exponential model.Acknowledgements
No acknowledgement found.References
1. Pattanayak P, Bleumke DA. Tissue characterization of the myocardium: state of the art characterization by magnetic resonance and computed tomography imaging. Radiol Clin North Am 2015;53(2):413-423.2. Lovblad KO, Laubach HJ, Baird AE, Curtin F, Schlaug G, Edelman RR, Warach S. Clinical experience with diffusion-weighted MR in patients with acute stroke. AJNR Am J Neuroradiol 1998;19(6):1061-1066.
3. Deux JF, Maatouk M, Vignaud A, Luciani A, Lenczner G, Mayer J, Lim P, Dubois-Rande JL, Kobeiter H, Rahmouni A. Diffusion-weighted echo planar imaging in patients with recent myocardial infarction. Eur Radiol 2011;21(1):46-53.
4. Laissy JP, Gaxotte V, Ironde-Laissy E, Klein I, Ribet A, Bendriss A, Chillon S, Schouman-Claeys E, Steg PG, Serfaty JM. Cardiac diffusion-weighted MR imaging in recent, subacute, and chronic myocardial infarction: a pilot study. J Magn Reson Imaging 2013;38(6):1377-1387.
5. Xiang SF, Zhang XQ, Yang SJ, Gao YY, Gao BL, Shi QL, Li S. Intravoxel Incoherent Motion Magnetic Resonance Imaging with Integrated Slice-specific Shimming for old myocardial infarction: A Pilot Study. Sci Rep 2019;9(1):19766.
6. Wu R, An DA, Shi RY, Chen BH, Wu CW, Jiang M, Xu JR, Wu LM, Pu J. The feasibility and diagnostic value of intravoxel incoherent motion diffusion-weighted imaging in the assessment of myocardial fibrosis in hypertrophic cardiomyopathy patients. Eur J Radiol 2020;132:109333.
7. Jin J, Chen M, Li Y, Wang Y, Zhang S, Wang Z, Wang L, Ju S. Detecting Acute Myocardial Infarction by Diffusion-Weighted versus T2-Weighted Imaging and Myocardial Necrosis Markers. Tex Heart Inst J 2016;43(5):383-391.
8. Bennett KM, Schmainda KM, Bennett RT, Rowe DB, Lu H, Hyde JS. Characterization of continuously distributed cortical water diffusion rates with a stretched-exponential model. Magn Reson Med 2003;50(4):727-734.
Figures
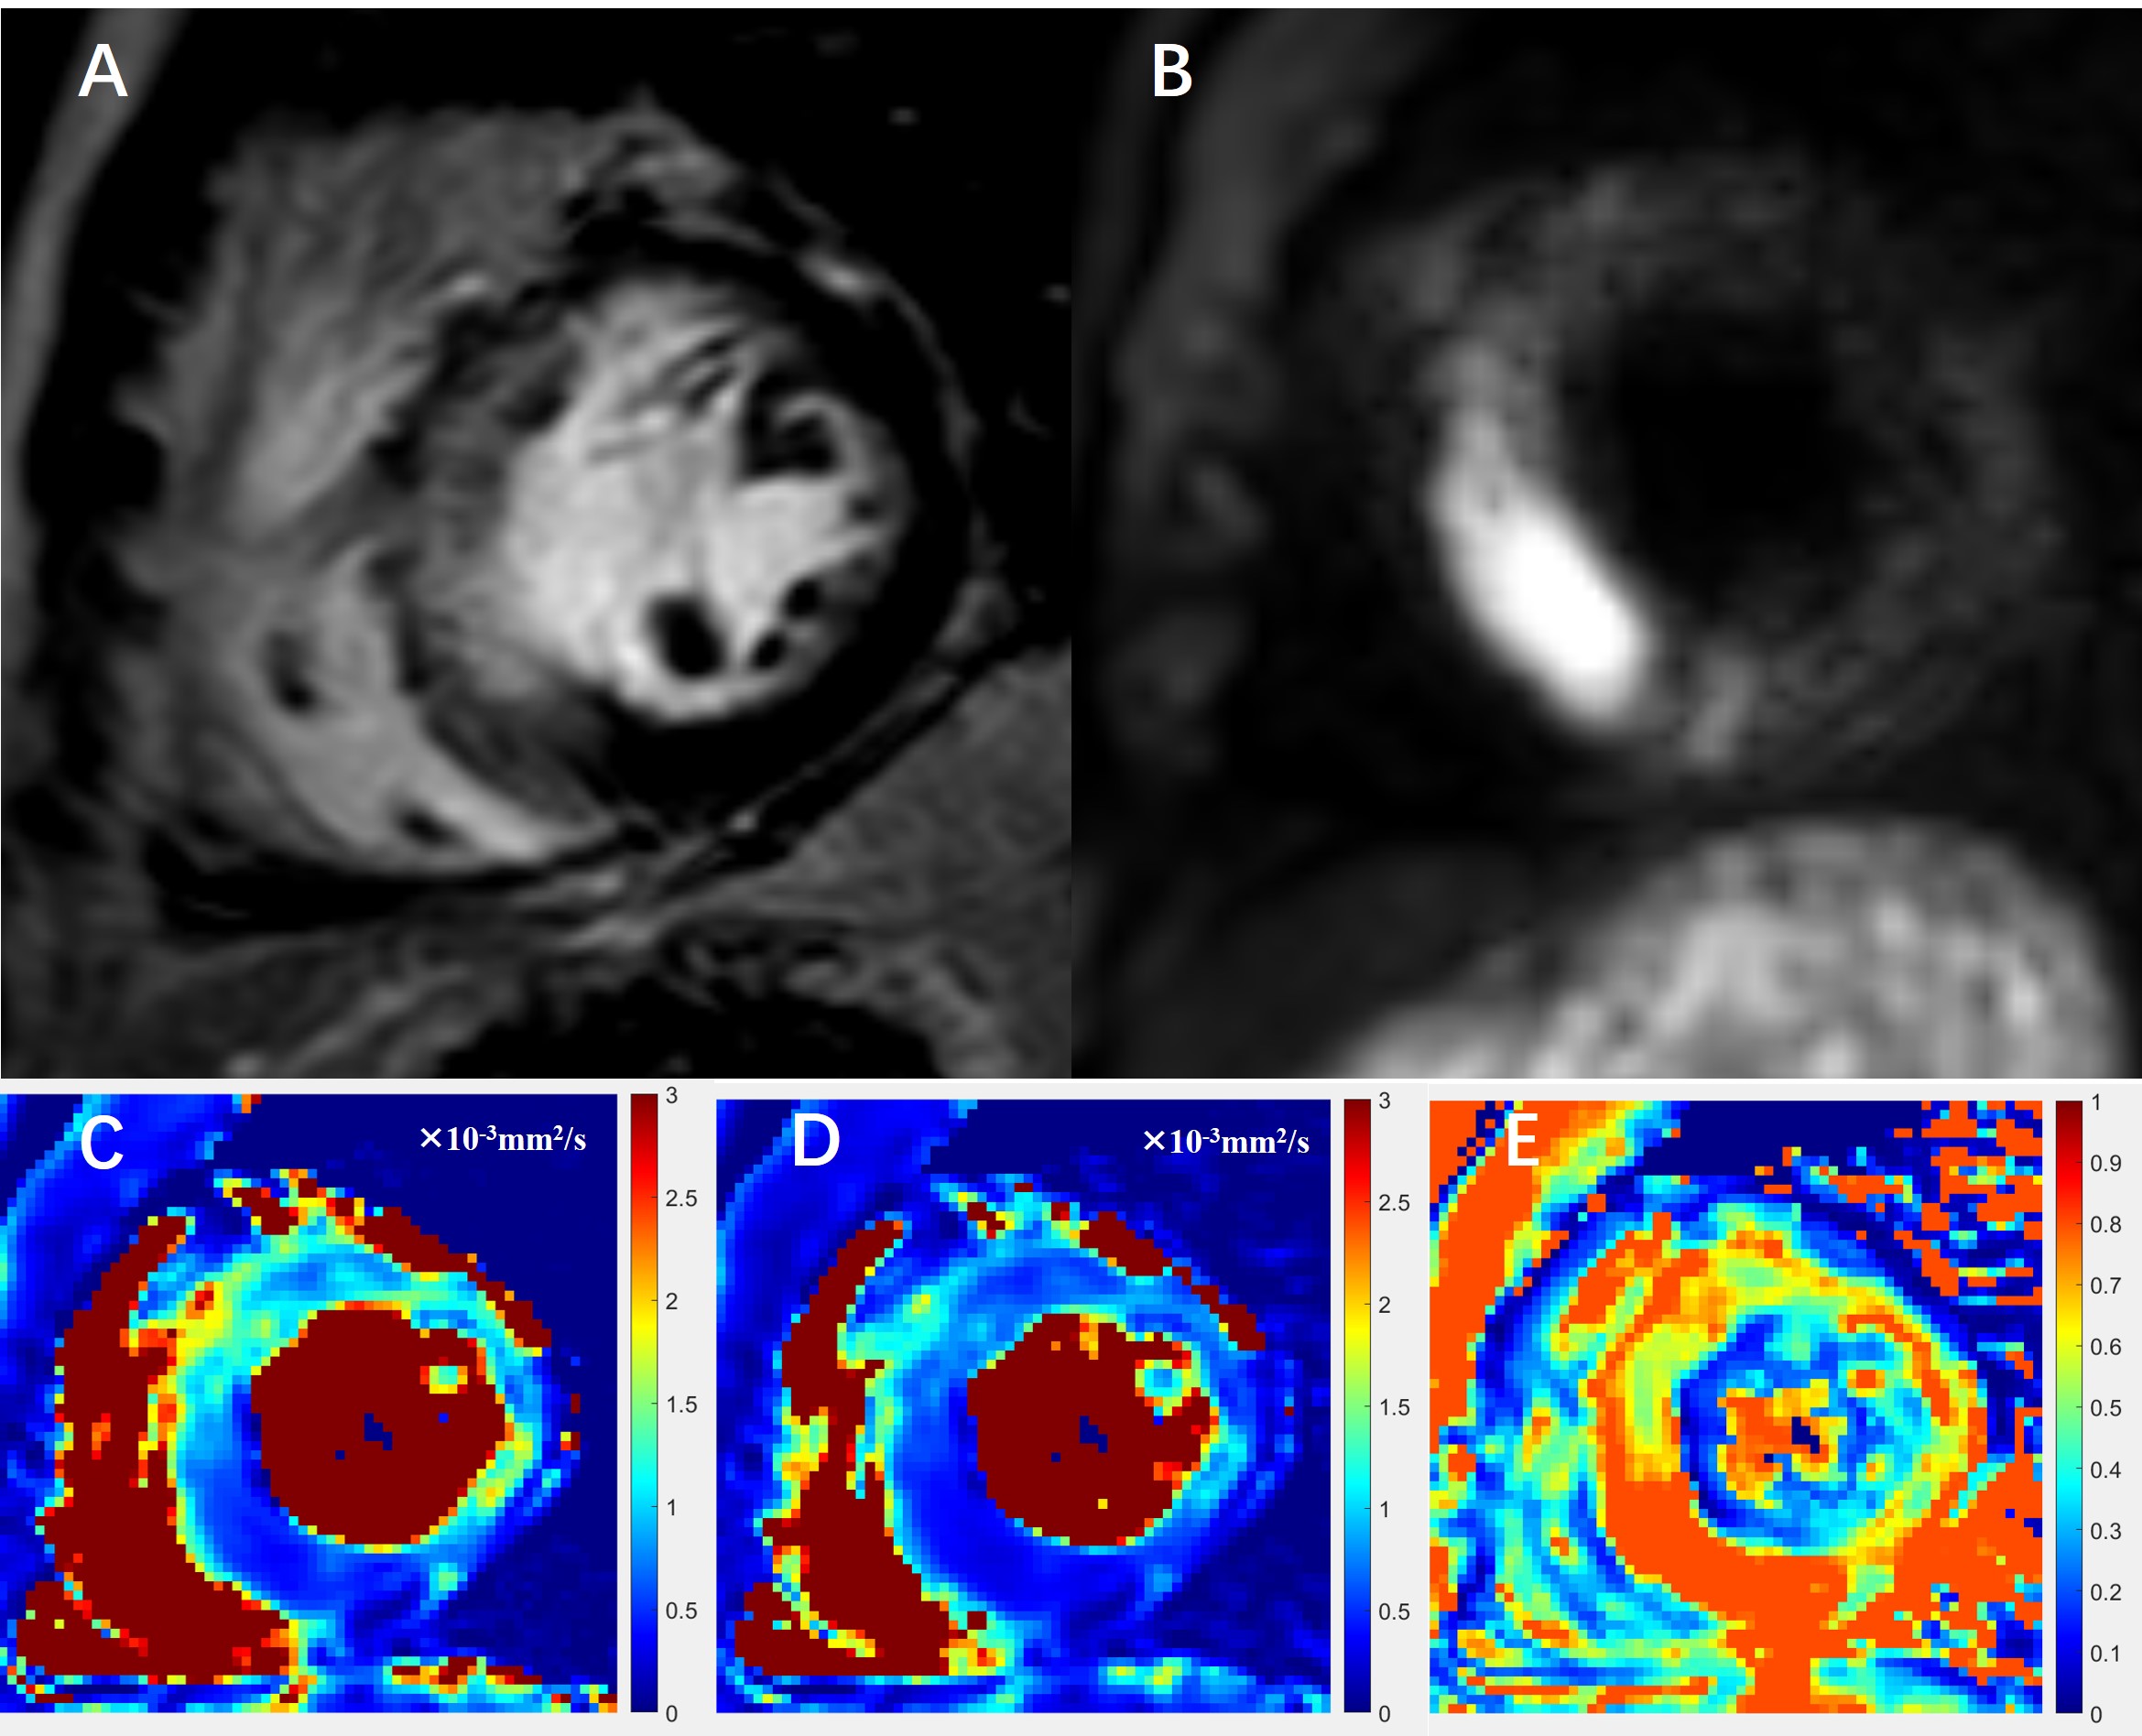
Fig. 1. A patient with
acute myocardial infarction. (A) Delayed enhancement MRI image. (B) DWI image
with b value of 50 s/mm2. The ADC map (C) derived from the
mono-exponential model, and the DDC map (D) and
map (E) derived from the
stretched exponential model.
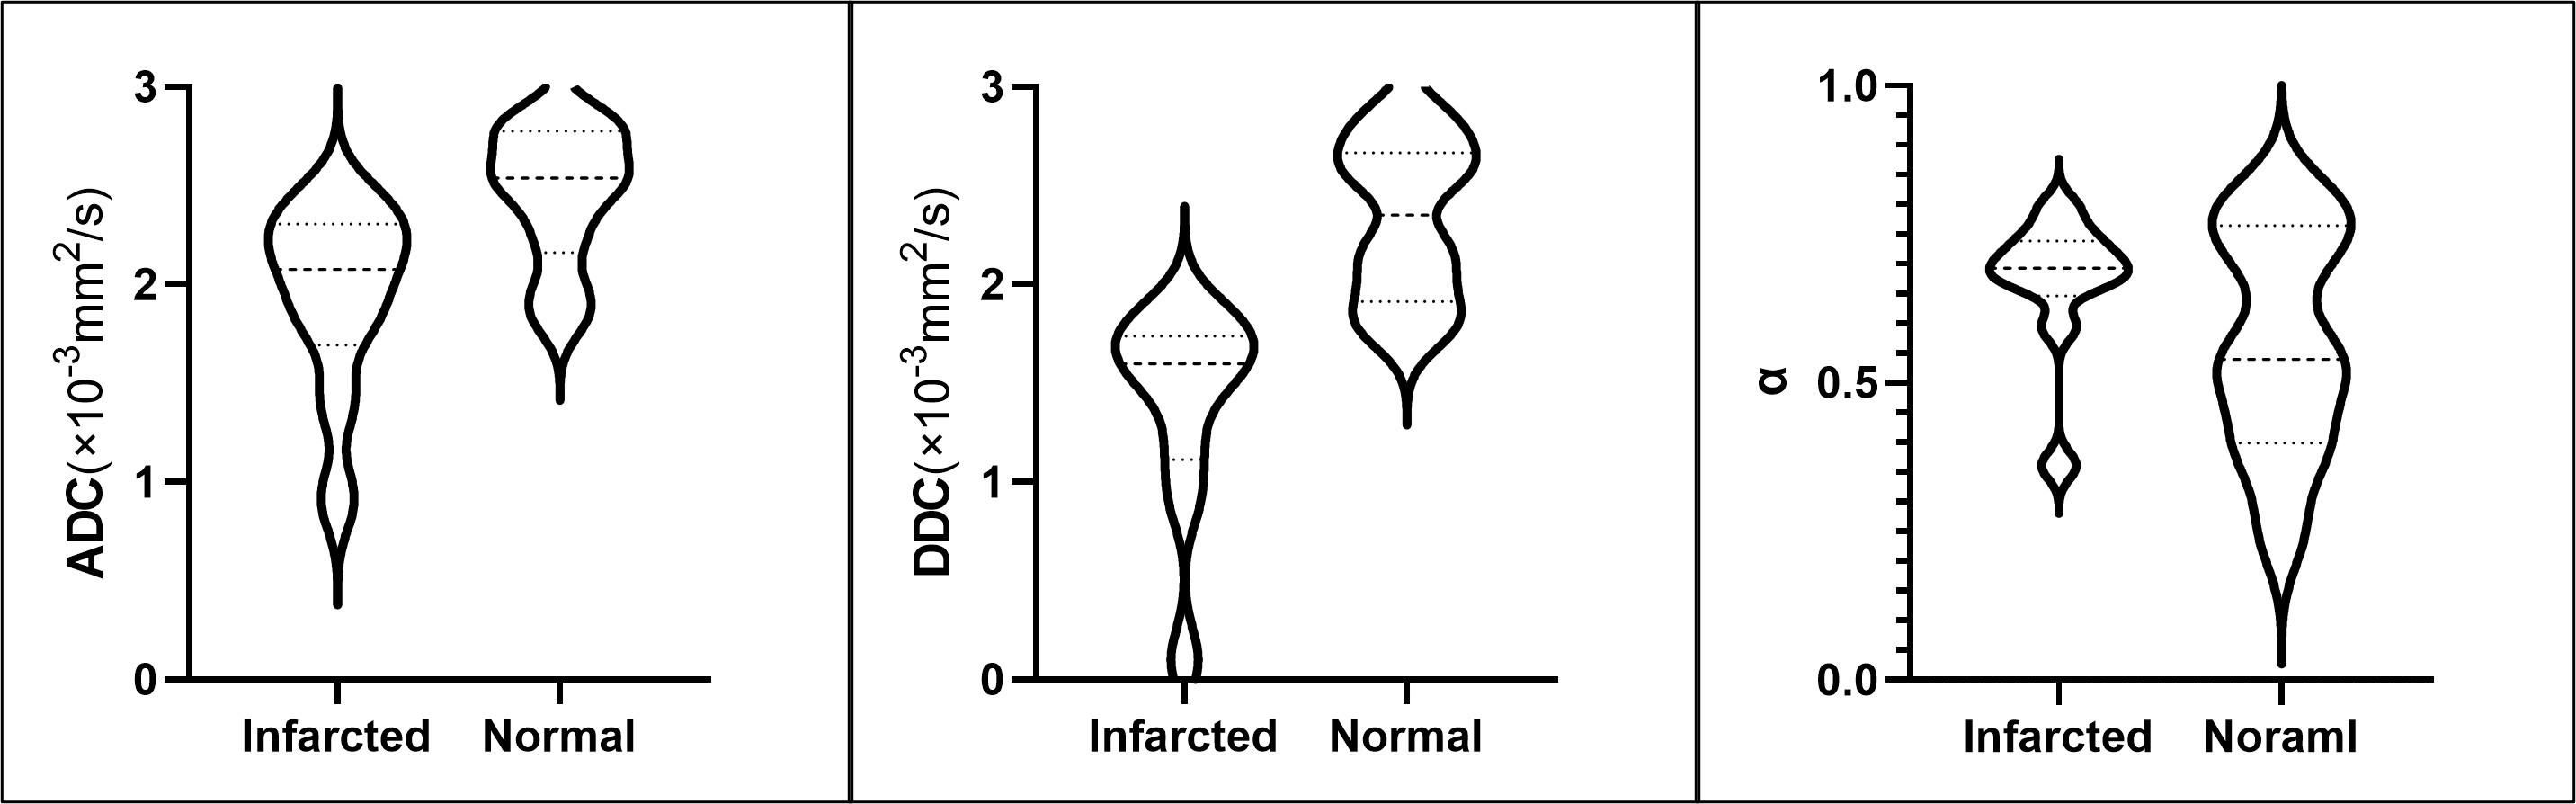
Fig. 2: Comparison of the ADC, DDC and values between the infarcted myocardium and remote healthy myocardium.
DOI: https://doi.org/10.58530/2022/4118