4100
Cell sorting microbeads as novel contrast agent for magnetic resonance imaging
Aman Khurana1, Francesc Marti2, Roberto Gedaly2, and Fanny Chapelin3
1Radiology, University of Kentucky, Lexington, KY, United States, 2Surgery, University of Kentucky, Lexington, KY, United States, 3Biomedical Engineering, University of Kentucky, Lexington, KY, United States
1Radiology, University of Kentucky, Lexington, KY, United States, 2Surgery, University of Kentucky, Lexington, KY, United States, 3Biomedical Engineering, University of Kentucky, Lexington, KY, United States
Synopsis
Due to their low cytoplasmic capacity and phagocytic activity, T cells have consistently been challenging to label for MR tracking applications. We developed a one-stop shop approach where the T cell sorting agent also labels the cells which can subsequently be imaged using non-invasive MRI. We demonstrate positive intracellular localization of the beads in Treg cells by means of histopathology analyses and MRI signal effects in phantoms containing different amounts of labeled cells.
Introduction
Rapid evolution and prevalent use of magnetic resonance imaging (MRI) in the clinic has fueled research in the development of contrast agents for specific cell tracking applications. Safe and efficient labeling of non-phagocytic cell types such as T cells nonetheless remains challenging. Magnetic-activated cell sorting (MACS) is a common method for cell population separation from tissue homogenates. The technique relies on targeting cell surface markers with specific antibodies bound to superparamagnetic nanoparticles also called ‘microbeads’. When placed in a high gradient magnetic field, the labeled cells remain trapped while unlabeled cells elute. Labeled cells can be collected by removing the magnetic field. Our hypothesis is that the microbeads used for cell separation have magnetic properties pertinent to cell labeling and tracking applications. We compared the MR signal effects of MACS microbeads (CD25) and in vitro activation beads (CD3/28) to the current preclinical standard ferumoxytol. Thereafter, we investigated in vitro labeling efficiency of regulatory T cells (Tregs) with MRI and histopathologic confirmation.Methods
Triplicate samples of half and one million Treg were labeled overnight (16 hours) with 10 µl CD25 microbeads per million Tregs. After incubation, excess microbeads were removed by three washes followed by centrifugation. Triplicate samples of unlabeled half and one million T cells were also prepared. All cell samples were resuspended in 100 µl agarose gel (1% dilution in PBS) and transferred to PCR tubes for MR imaging. MRI images were acquired on a preclinical Bruker 7T imaging system (Bruker, Billerica, MA) using a mouse birdcage body coil (Bruker). Axial images of the cell samples were acquired using a Turbo RARE sequence with parameters TR/TE= 2500/33 ms, Matrix size = 128×128, FOV = 28×28 mm2, Slice thickness = 0.7 mm, Averages = 2, Slice number = 16 and a T2map Multi Slice Multi Echo (MSME) sequence with TR = 2200 ms and TEs ranging from 7 to 90 ms, Matrix size = 96×96, FOV = 28×28 mm2, Slice thickness = 0.7 mm, Averages = 1, Slice number = 16. T2 values were extracted using the system’s inbuilt Image Sequence Analysis (ISA T2vtr) software by defining circular ROIs over each tube and averaged over 3 slices.Results
We tested the respective magnetic properties of CD3 and CD25 microbeads compared to cell tracking standard Ferumoxytol (Figure 1) and agarose gel controls. Both microbeads exhibit T2* effects with increasing dosage, with CD3 microbeads showing a weaker effect (Figure 1A&B). Regarding T2* relaxation curves, both agarose and CD3 microbeads exhibit linear relaxation within the echo time range selected (Figure 2), indicating long inherent T2* and limited impact of CD3 microbeads on MRI signal. However, ferumoxytol and CD25 microbeads display comparable logarithmic patterns (Figure 2), demonstrating CD25 microbeads’ ability to generate strong signal to noise on MR images. Overnight Treg cell labeling with CD25 microbeads shows positive intracellular Prussian Blue staining, indicating successful uptake of CD25 microbeads (Figure 3A) without viability impairment (94% viable cells, p<0.01 compared to unlabeled controls). CD25-labeled T cells and unlabeled controls do not exhibit positive staining (Figure 3C&D), signifying that CD25 needs to be present at the surface of the cells to enable internalization of the microbead. Intracellular labeling with CD3 microbeads was unsuccessful, possibly due to the large size of the bead and was therefore excluded from further testing. Likewise, Treg labeling with ferumoxytol is ineffective (Figure 3B), likely due to the non-phagocytic nature of T cells. CD25 microbead-labeled Tregs (Figure 4A, 1-2) displayed decreased signal on T2-weighted MR images compared to unlabeled cells (Figure 4A, 3-4) and agarose controls (Figure 4A, 5), consistent with adequate labeling with a paramagnetic iron oxide. T2 relaxation time maps (Figure 5B) yielded quantitative T2 signal decay. The T2 of half million Tregs (T2(2) = 62.67 ms ±0.67) is significantly lower and about three-fourth as high as the T2 of unlabeled T cells (T2(4) = 80.89 ms ±2.34) and agarose alone (T2(5) = 78.11 ms ±2.59, P = 0.0001 and 0.0006 respectively). T2 signal is further shortened in one million labeled Treg samples (T2(1) = 54.22 ms ± 0.51) and significantly lower than the half million labeled Treg samples (P=0.0001).Discussion and conclusion
The CD25 microbeads that serve as MRI contrast agents in this project are approved for clinical research. CD25 microbeads alone displayed strong MR T2 effects, comparable to the standard Ferumoxytol, which is also used ‘off label’ for cell tracking applications. Equivalent CD34 microbeads are FDA approved as a humanitarian use device, which should fast-track approval for clinical ‘off-label’ use of CD25 microbeads. This study demonstrates that the CD25 microbeads used for magnetic sorting of regulatory T cells constitute an excellent cell labeling agent for subsequent MR imaging. The specific antibody binding promotes internalization of the magnetic bead, leading to strong MR effects, which have so far been unattainable with other iron oxides. This novel cellular tracking method will be key in tracking the homing and fate of Tregs in inflammatory pathologies and solid organ transplantation. Given the use of this agent in the existing clinical Treg sorting workflow, this method offers ease of use for Treg labeling during transplant surgery given time and sterility constraints.Acknowledgements
This work was supported by the National Center for Research Resources and the National Center for Advancing Translational Sciences, National Institutes of Health, through Grant UL1TR001998 and by the Shared Resource Facilities of the University of Kentucky Markey Cancer Center P20CA177558.References
No reference found.Figures
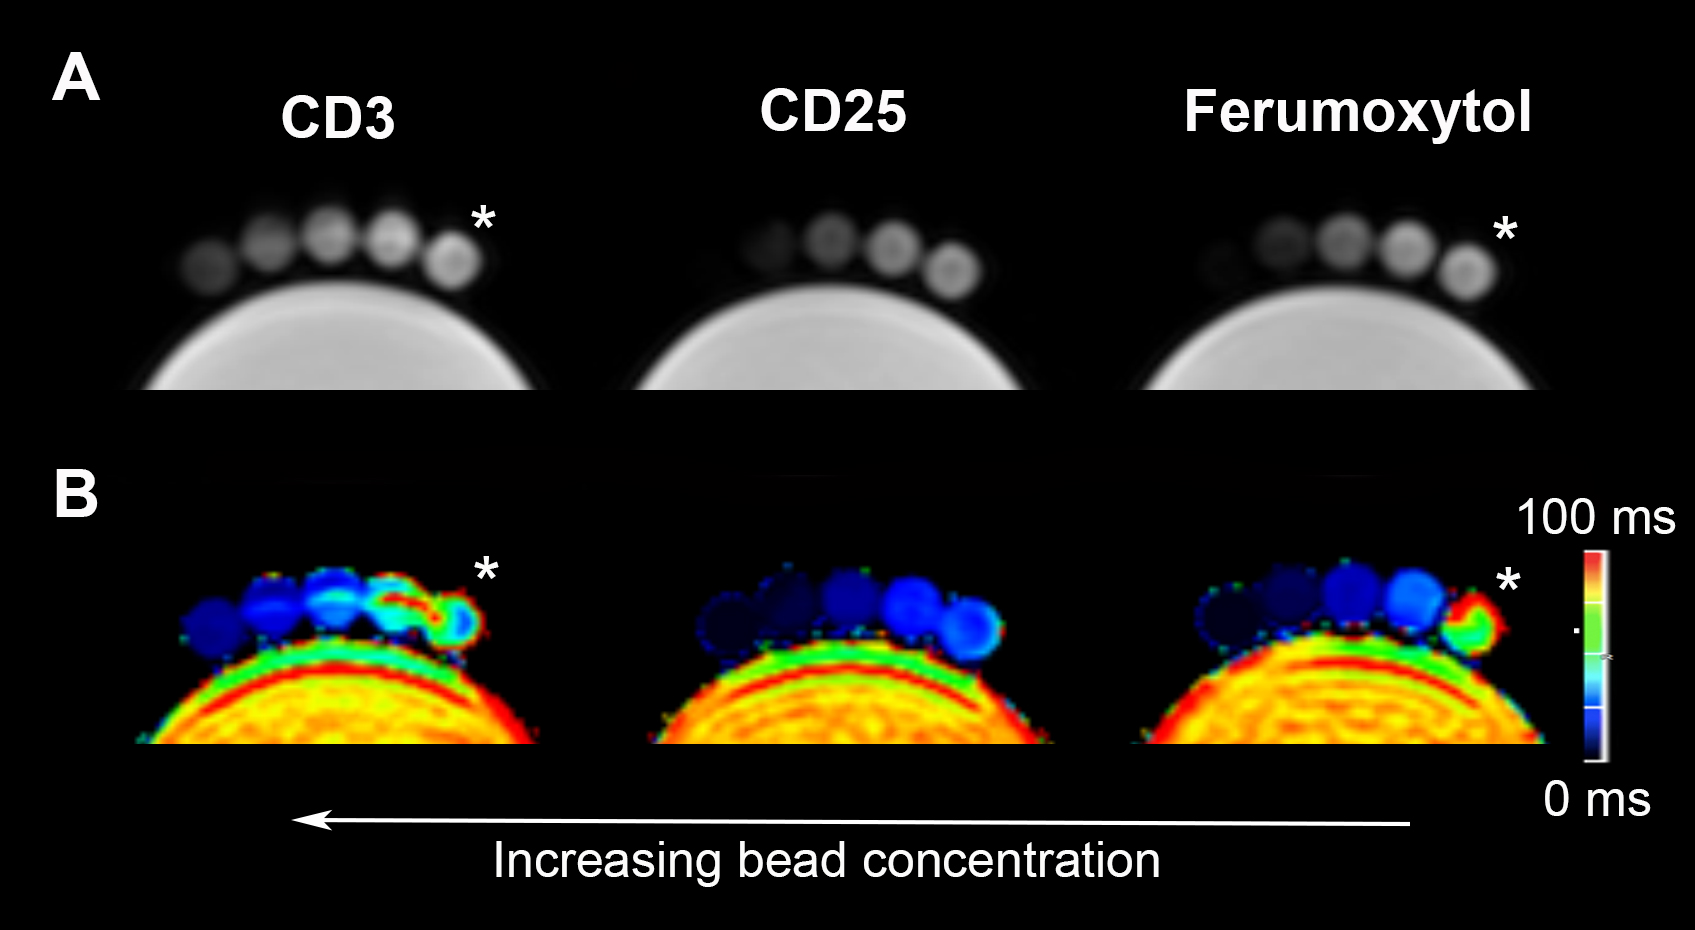
Figure 1: Magnetic resonance signal effects of CD3 and CD25 microbeads compared to ferumoxytol. T2-weighted magnetic resonance images (A) and corresponding T2* relaxation time maps (B) of agarose gels containing increasing bead concentrations show marked signal decrease (dark) for all contrast agents compared to controls (* = agarose gel alone). Signal decay is more pronounced for CD25 microbeads and ferumoxytol compared to CD3 microbeads. Data was acquired on a 1.5 T MRI.
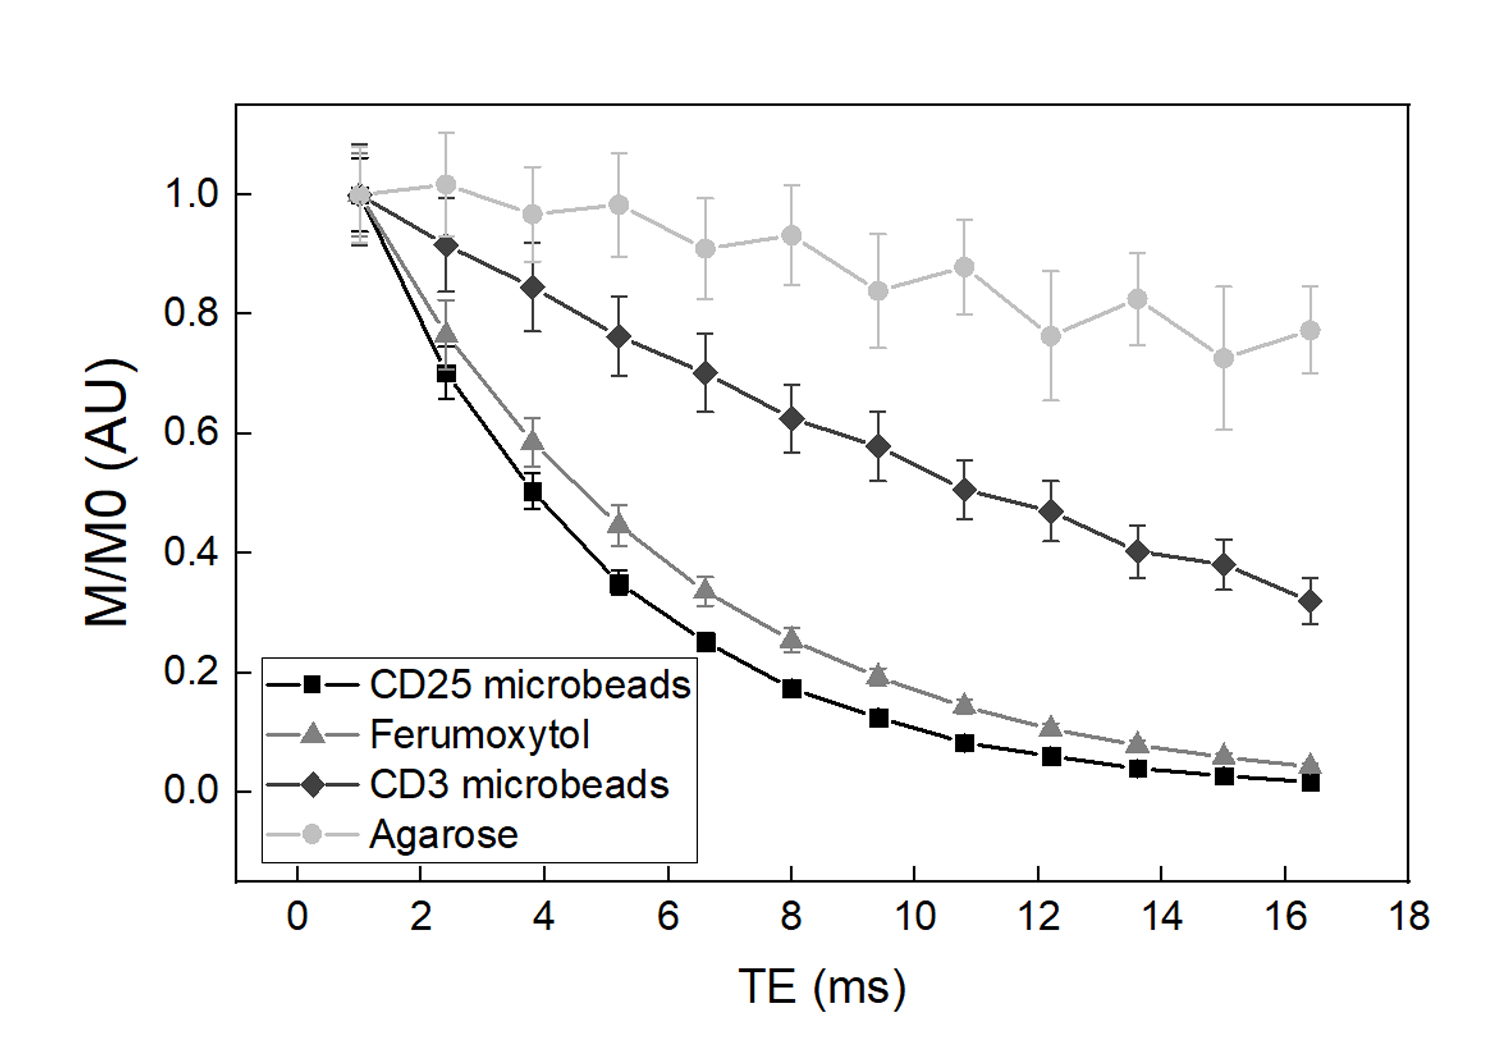
Figure 2: T2* relaxation curves of microbeads. CD25 microbeads and ferumoxytol display short T2* relaxation, enabling better contrast from surrounding water. In contrast, CD3 microbeads and agarose gel exhibit linear signal decay with respect to echo time.
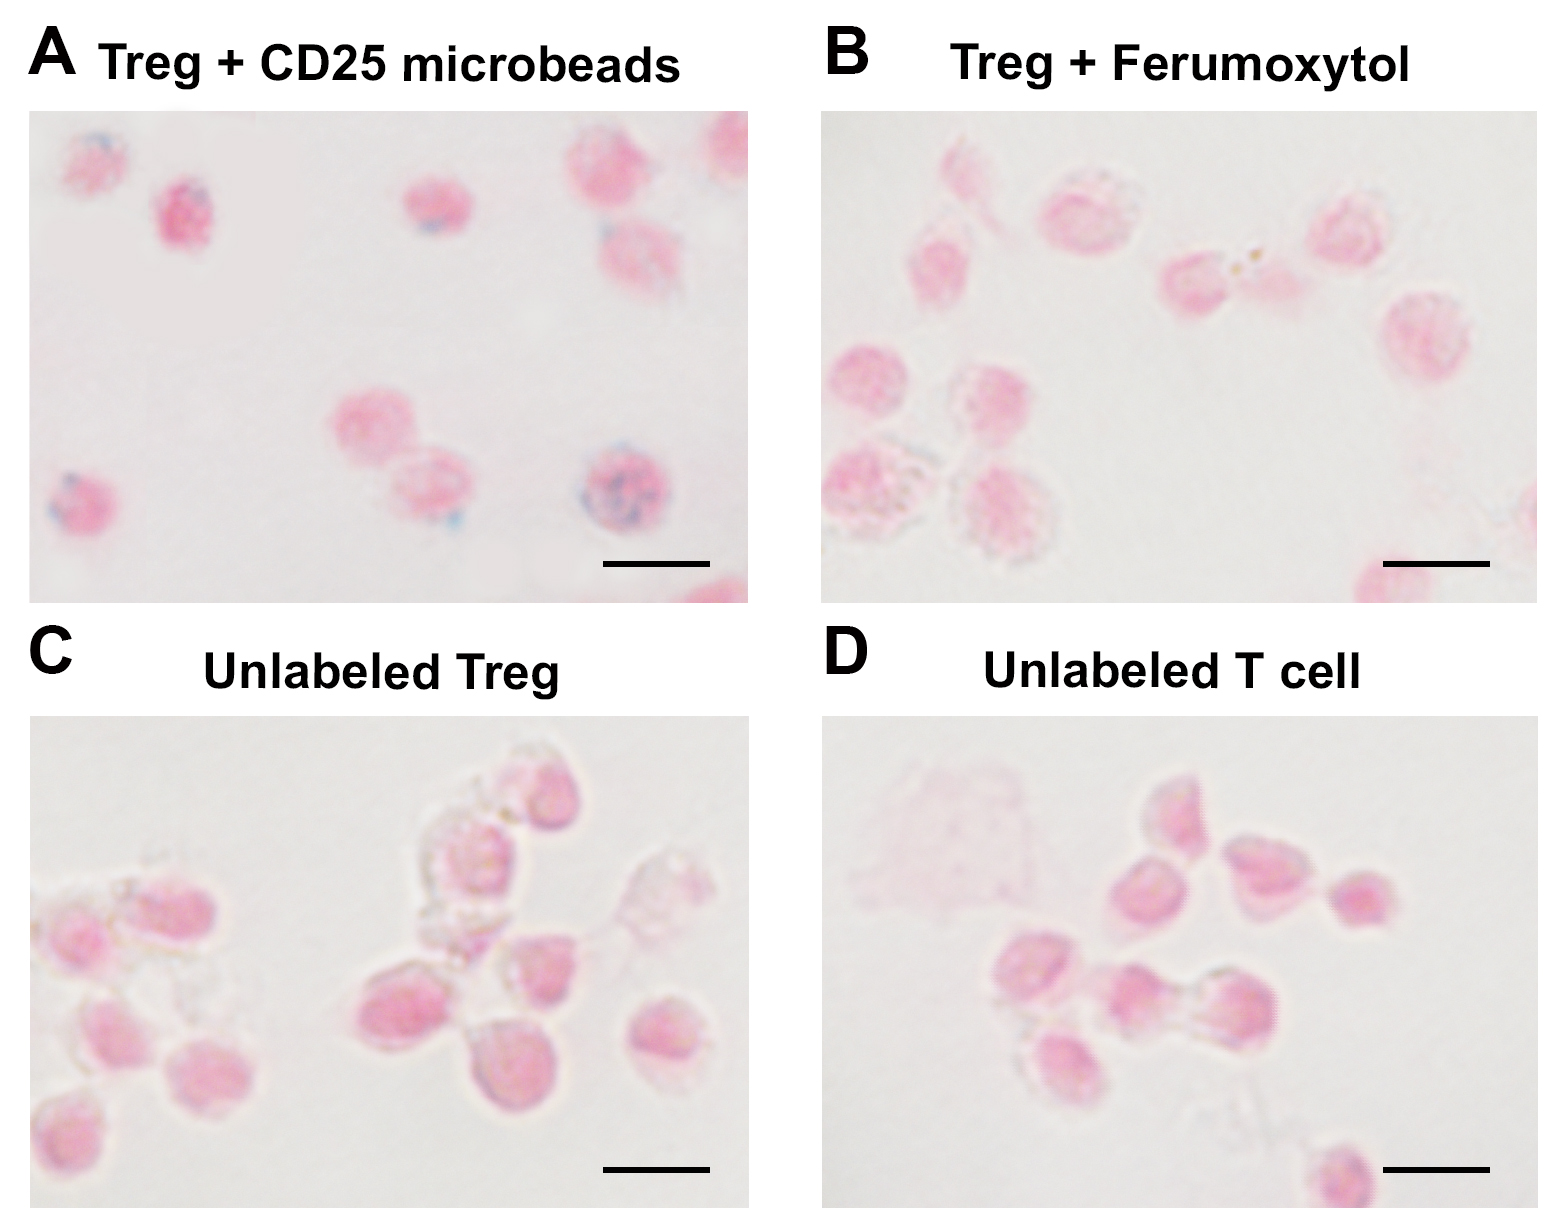
Figure 3: Confirmation of CD25 microbead intracellular uptake by Tregs. Regulatory T cells labeled overnight with 10 µl CD25 microbeads exhibit positive intracellular Prussian blue staining (A). Tregs labeled with Ferumoxytol overnight (B) do not internalize the contrast agent. Unlabeled control Treg (C) and T cells (D) do not exhibit blue staining.
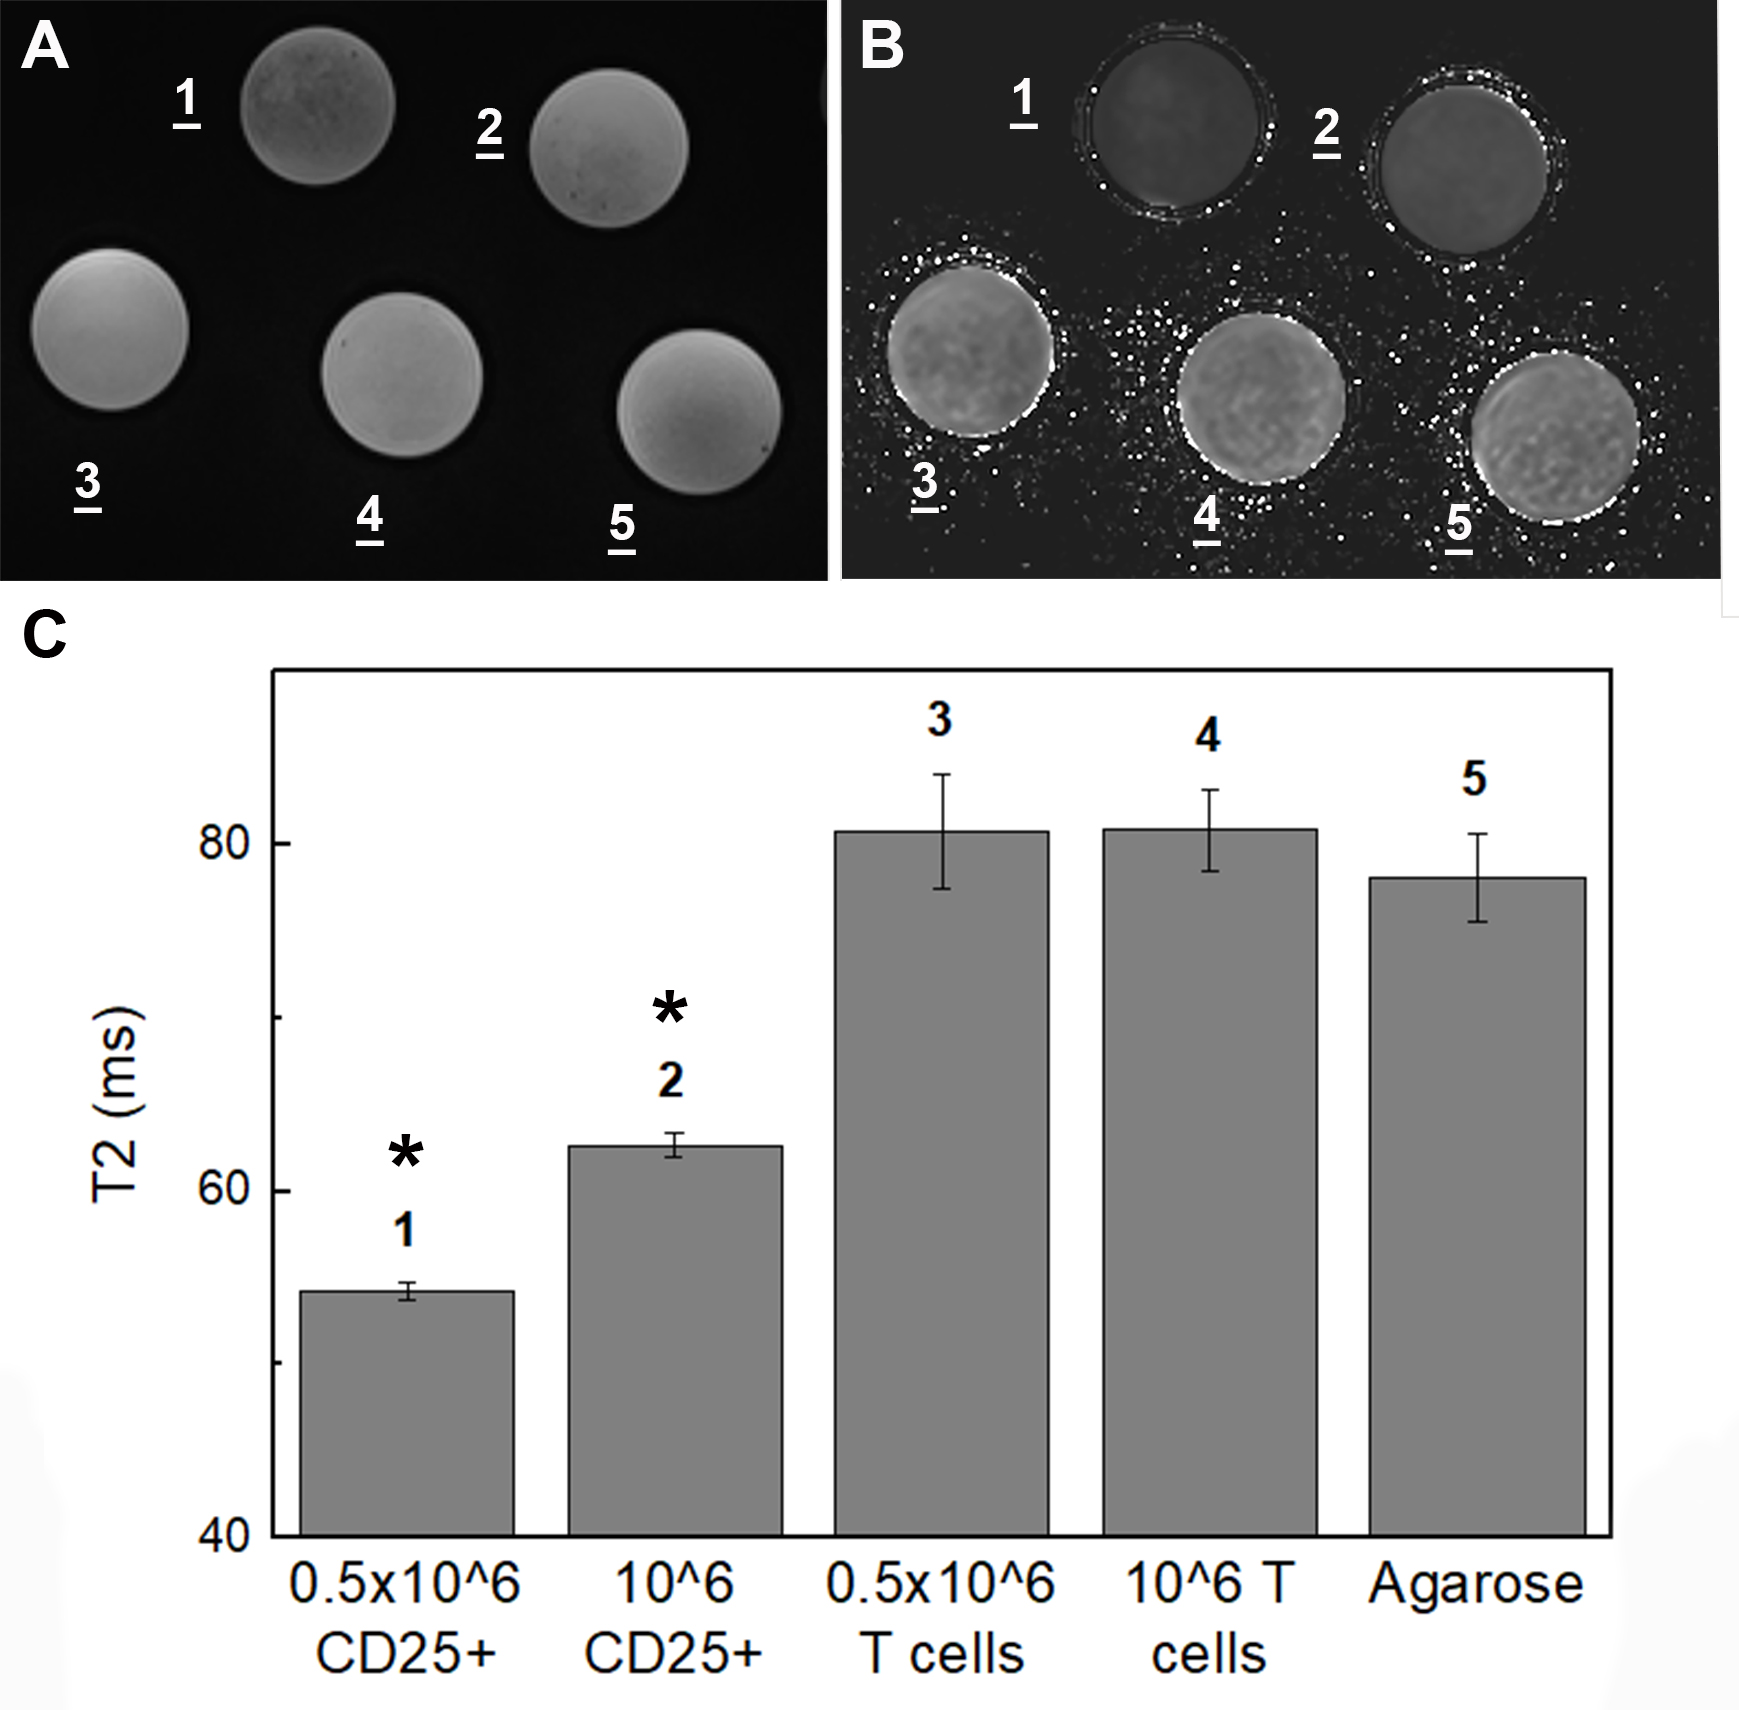
Figure 4: Magnetic resonance signal effects of CD25 microbead-labeled Tregs. T2-weighted magnetic resonance images (A) and corresponding T2 relaxation time maps (B) of agarose gels containing CD25 microbead-labeled Tregs (1-2) show marked signal reduction compared to unlabeled T cells (3-4) and agarose (5) controls. Quantitative analysis of the T2 relaxation times (C) confirms significant T2 shortening in CD25-microbead labeled cells. Data are presented as mean ± standard deviation.
DOI: https://doi.org/10.58530/2022/4100