4099
Repeatability and Robustness of MP-GRASP T1 Mapping1Department of Radiology, Stanford University, Palo Alto, CA, United States, 2Biomedical Engineering and Imaging Institute and Department of Radiology, Icahn School of Medicine at Mount Sinai, New York, NY, United States
Synopsis
The repeatability of fast 3D T1 mapping using MP-GRASP (Magnetization-Prepared Golden-angle RAdial Sparse Parallel) MRI and its robustness to variation of imaging parameters including flip angle in phantom and brain were demonstrated. The experiments showed that MP-GRASP has a good robustness to B1 inhomogeneity, with intra-slice repeatability below 1% in the single tube phantom experiment. The longitudinal experiments also yielded good repeatability both in phantom (<2.5%) and in the brain (<2%) under various imaging conditions. The T1 values estimated are accurate relative to inversion recovery spin echo (IR-SE) gold standard (R2=0.997, Lin’s CCC=0.996).
Introduction
Quantitative measurement of the spin-lattice relaxation time (T1), known as T1 mapping, has been increasingly used in the clinic for disease characterization and follow-ups1–6. It provides quantitative information that could serve as an image biomarker for various diseases6–14.The MP-GRASP technique is a 3D fast Look-Locker T1 mapping technique15 that uses an inversion recovery (IR) pulse to prepare the magnetization before a fast GRE sequence with a small flip angle is used to collect the T1 data. It has been shown that Look-Locker technique is more robust to the B1 inhomogeneity.
In this study we rigorously designed longitudinal experiments to evaluate the repeatability and robustness of MP-GRASP in a phantom over a period of ~12 months with varying imaging parameters, including spatial resolution, flip angle (FA), repetition time (TR), echo time (TE), acceleration rate/total scan time, receiver bandwidth and coil choices. Those experiments were repeated in a healthy volunteer for in vivo demonstration.
Technique
The signal evolution of the Look-Locker T1 mapping technique can be expressed as the following equation:$$M(t)=M_{ss}-(M+M_{ss})e^{-t/T_{1}^{*}}$$
Let -M to be the magnetization immediately before the first RF excitation in the GRE acquisition, $$$M_{ss}$$$ to be the magnetization after the signal achieved steady state with a small and constant FA=α˚ following the IR preparation. $$$T_{1}^{*}$$$ represents the effective T1 value under a small imaging RF train. $$$T_{1}^{*}$$$ is given by the following equation:
$$T_{1}^{*}=[\frac{1}{T_{1}}-(\frac{1}{TR})ln(cos\alpha)]^{-1}$$
With a small FA, Eq. 1 can be reformatted as the following three-parameter equation under the assumption that TR≪$$$T_{1}^{*}$$$<$$$T_{1}$$$, and TE≪$$$T_{2}^{*}$$$:
$$M(t)=A-Be^{-t/T_{1}^{*}}$$
where
$$A=M_{ss}=\frac{M_{0}(1-e^{-TR/T_{1}}}{1-\cos\alpha e^{-TR/T_{1}}}=\frac{M_{0}(1-e^{-TR/T_{1}^{*}})}{1-e^{-TR/T_{1}^{*}}}\approx M_{0}\frac{T_{1}^{*}}{T_{1}}$$
$$B=M+M_{ss}=M+M_{0}\frac{T_{1}^{*}}{T_{1}^{*}}$$
and T1 can be calculated as:
$$T_{1}=T_{1}^{*}(\frac{B}{A}-1)$$
In practice it is hard to acquire data so that $$$M=M_{0}$$$ due to the fact that a large spoiler is usually applied after the IR pulse, which would take up several ms time (denoted as Δt). In this case, the actual $$$M_{0}$$$ denoted as $$$M_{0}^{'}$$$ can be expressed as
$$M_{0}^{'}=M_{0}-2M_{0}e^{-\Delta t/T_{1}}\approx M_{0}(1-2\frac{\Delta t}{T_{1}})$$
and the fitted T1 (denoted as $$$T_{1}^{'}$$$) can be calculated as:
$$T_{1}^{'}=\frac{M_{0}^{'}}{M_{ss}}T_{1}^{*}=\frac{M_{0}^{'}}{M_{0}}T_{1}=T_{1}-2\Delta t$$
Thus the corrected T1 will need to be adjust by adding 2Δt.
Method
Repeatability studies were carried out on 3T MRI scanners (MAGNETOM Skyra, Siemens) with a standardize T1MES phantoms16 and in vivo brain. For the phantom study, a IR-SE sequence was used as a T1 reference with inversion time (TI) of 30, 50 100, 200, 400, 500, 700, 1000, 1500, 2000 and 3000ms. The following experiments were designed and carried out for the phantom and in vivo study:Experiment 1: MP-GRASP and IR-SE T1 mapping techniques were scanned 12 times. The acquired T1 maps from MP-GRASP were compared with the ones from IR-SE.
Experiment 2: A long term repeatability study of MP-GRASP throughout a period of 12 month was carried out on the T1MES phantom with varying scanning parameters. The acquired T1 maps were compared with IR-SE gold standard.
Experiment 3: Repeatability of MP-GRASP were studied in the brain of one healthy volunteer during a single visit. During which 24 repetitions of the MP-GRASP were carried out. For all the phantom studies, the T1MES phantom were put in the scanner room until its temperature was stabilized. And for the in vivo experiment, all 24 scans were conducted during the subject’s single visit to avoid T1 variations due to varying physiological conditions.
Results and discussion
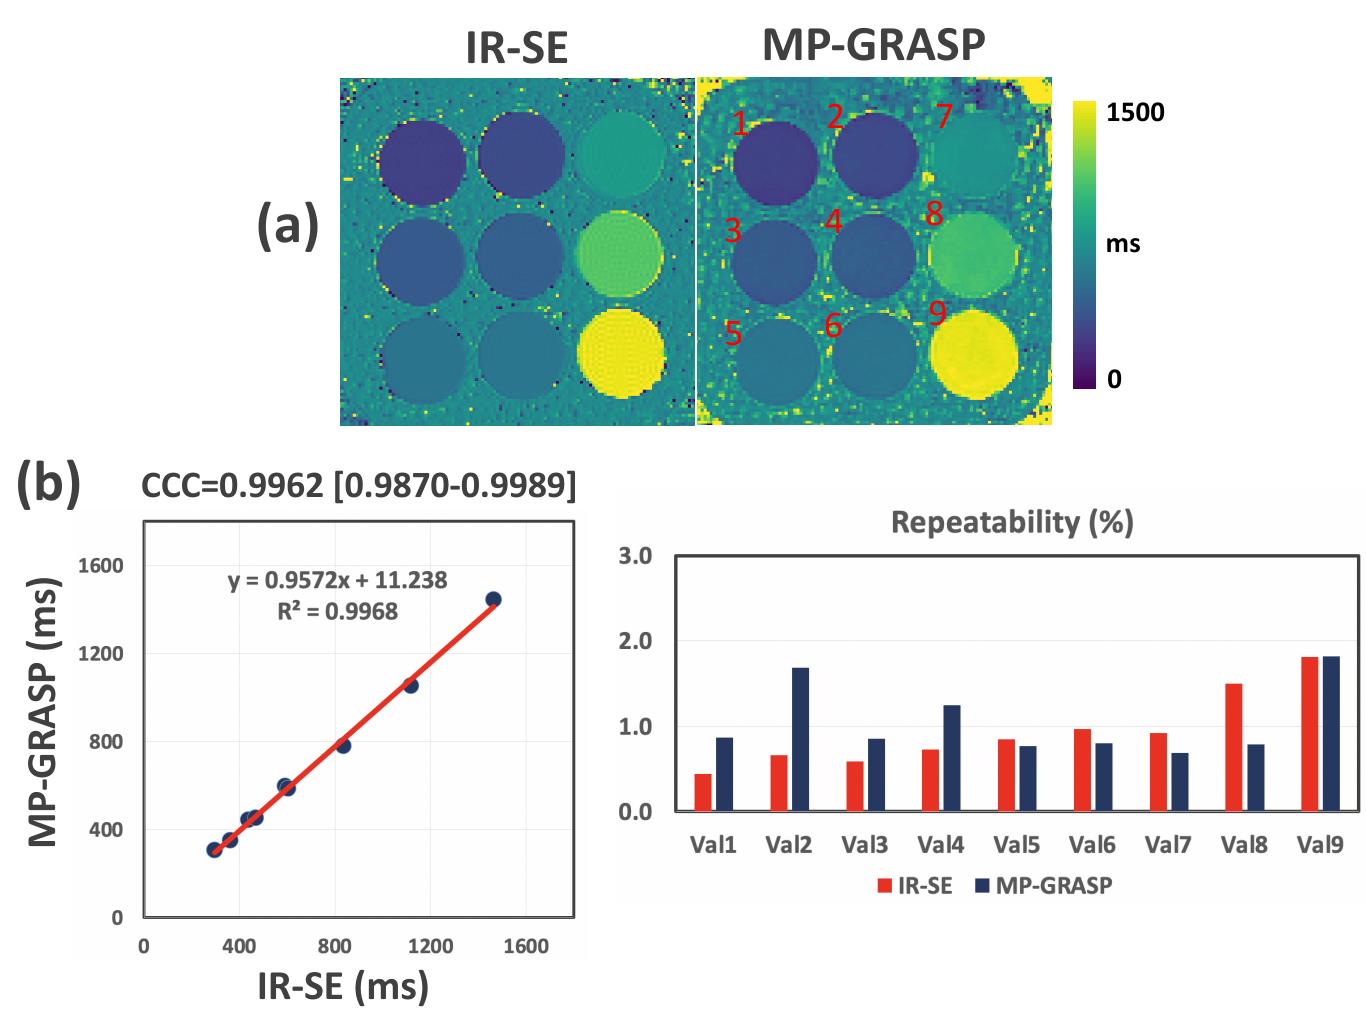
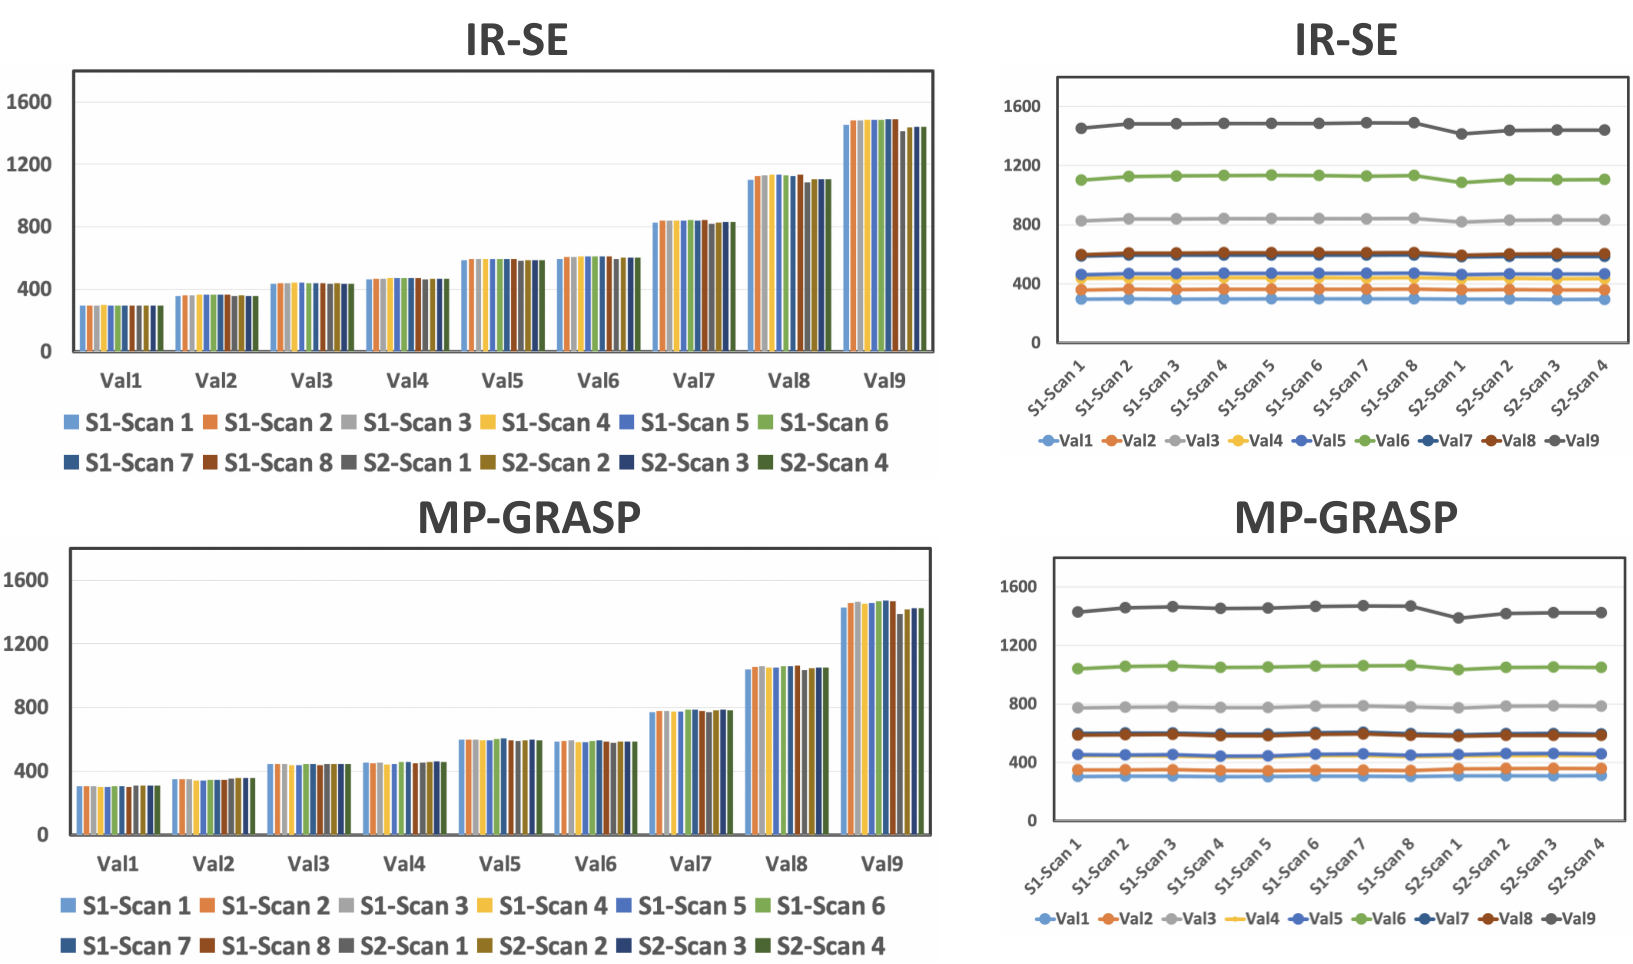
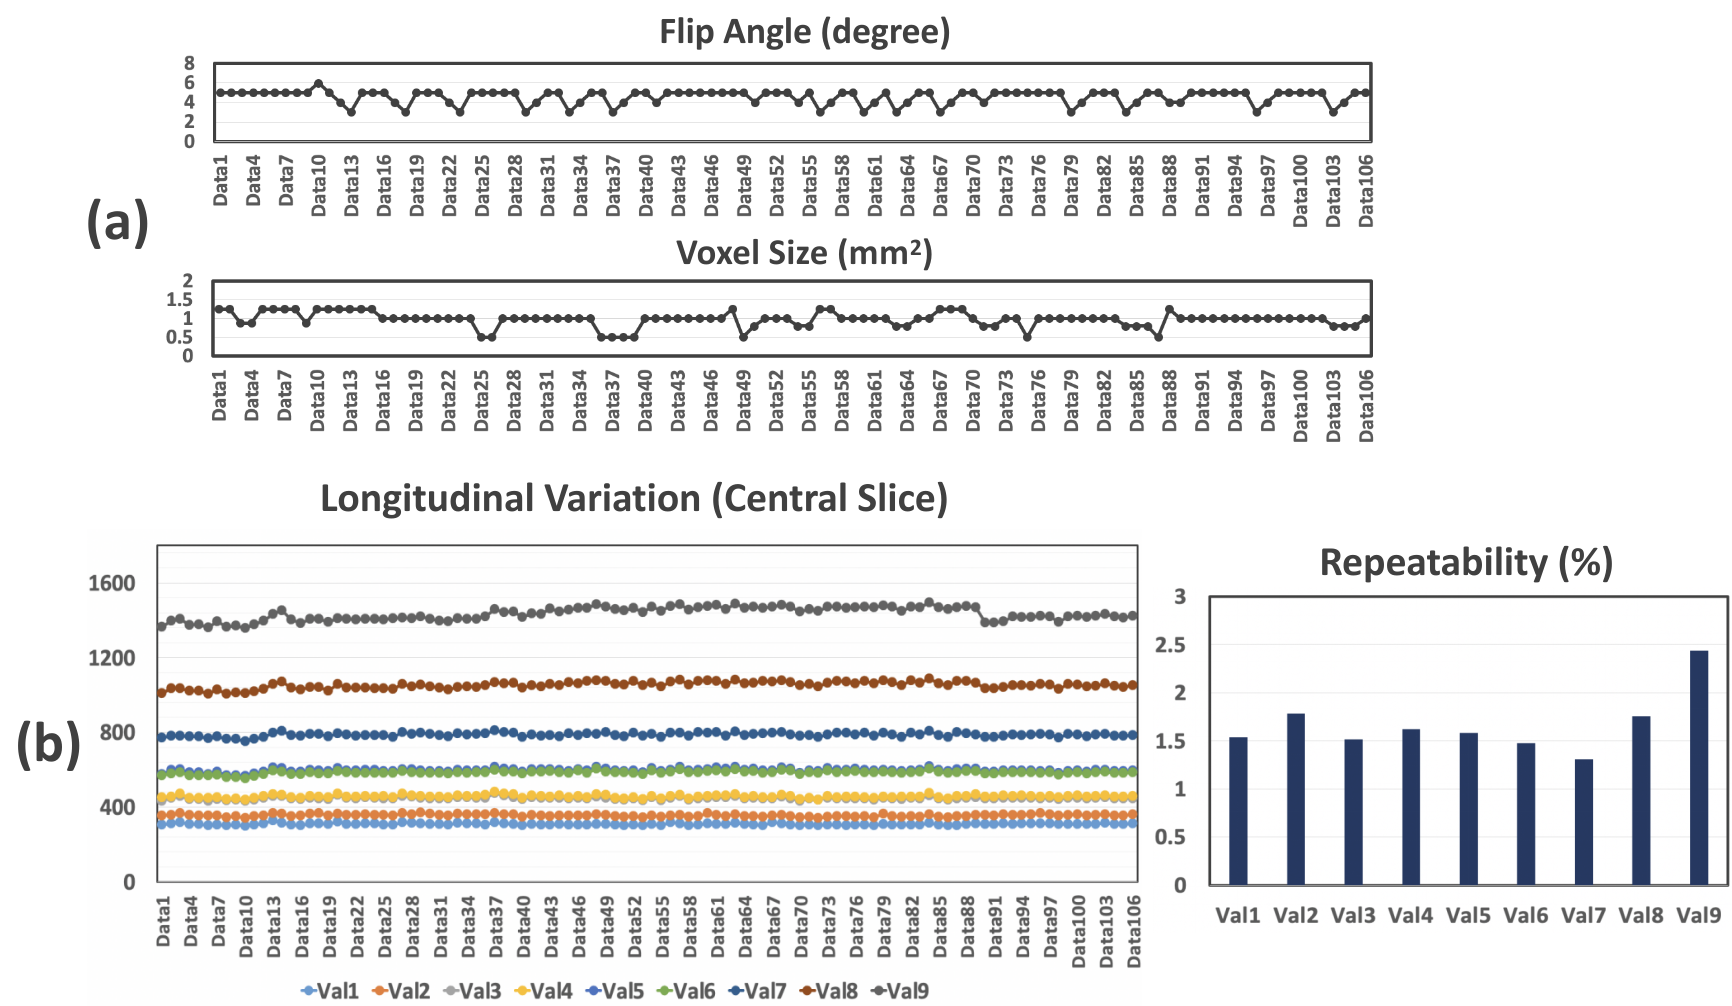
Results from the first experiment is presented in Figure 1. A single slice of T1 map from IR-SE and MP-GRASP were compared(a). As can be seem, a strong correlation between the mean T1 values from both methods can be observed(b). The calculated Lin’s concordance correlation coefficient (CCC) was 0.9962. The repeatability of T1 estimation over 12 scans is good for both IR-SE and MP-GRASP with all vials below 2%. Figure 2 shows bar plots and temporal variation of T1 values of the phantom study along time. As can be seem the T1 estimation from MP-GRASP is repeatable. Note there is a noticeable variation in the vials with larger T1 values, this can be observed in both the IR-SE and MP-GRASP, we believe this variation is the results of varying room temperature in the scanner room.A total of 106 longitudinal variations of mean T1 values of the phantom are summarized in Figure 3, along with corresponding variation of FA and voxel size. The longitudinal repeatability of T1 estimation is also shown. For vial 1-8 T1 variation was below 2%, for vial 9 it was 2.5%. This result indicates a good repeatability of T1 mapping over time.
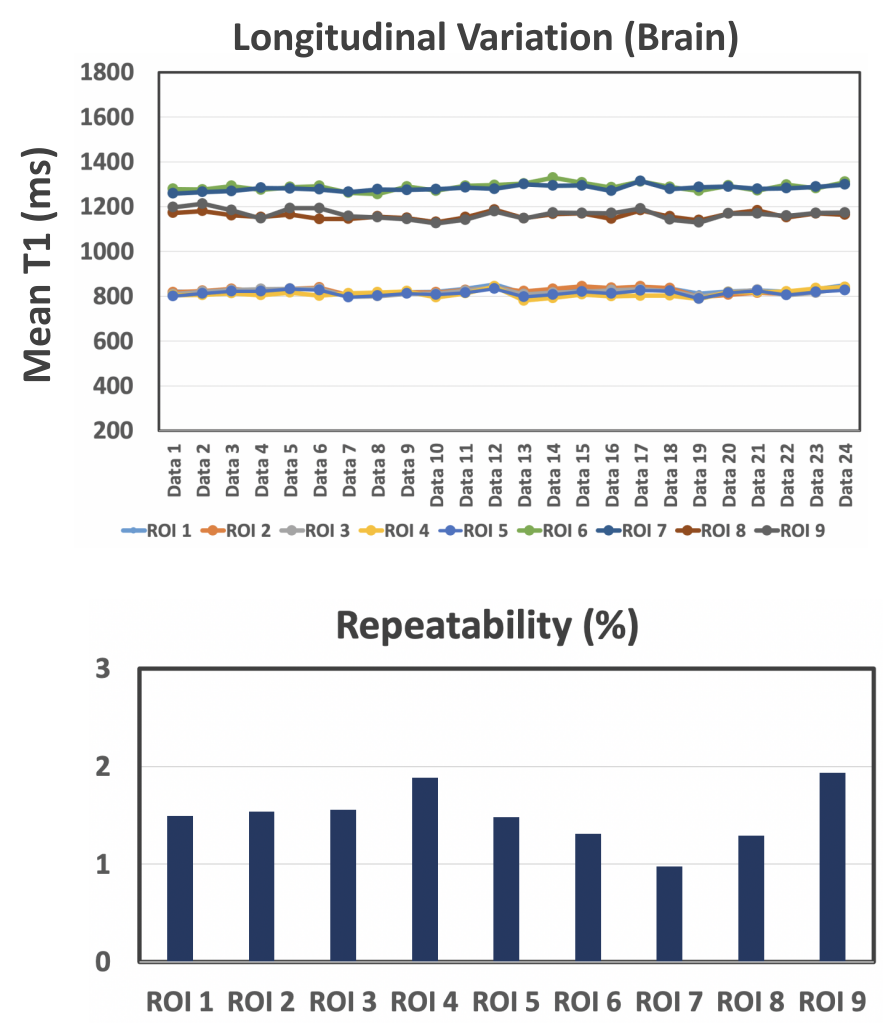
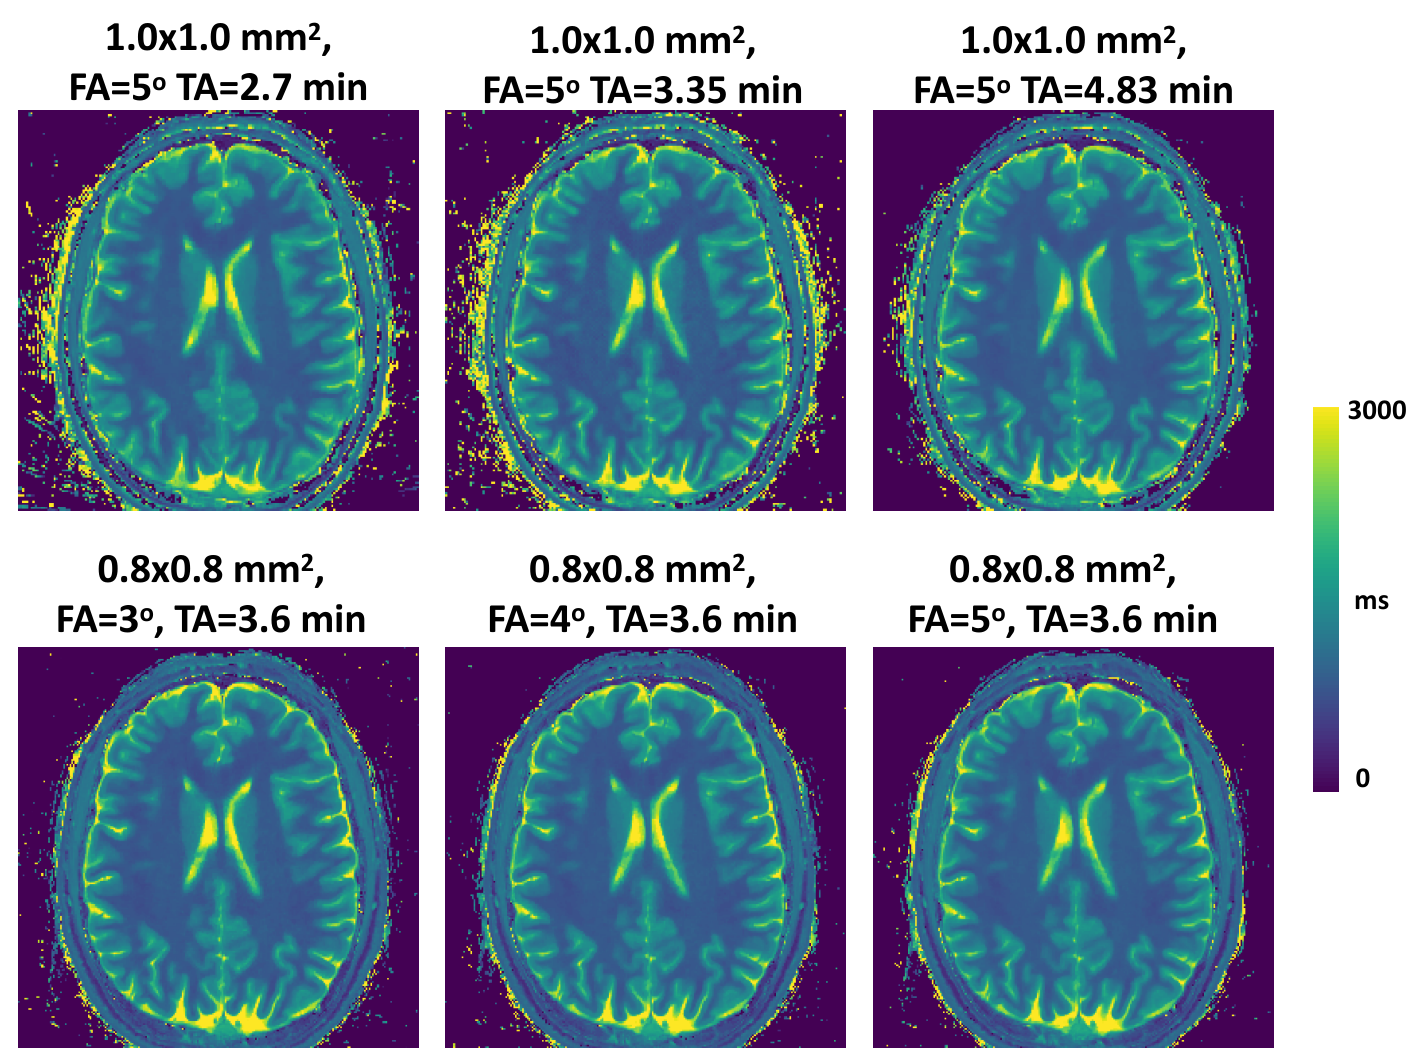
All 24 brain datasets are summarized in Figure 4. A total of 9 ROIs were selected and analyzed. The T1 variation in all ROIs is below 2% indicating a good repeatability of the MP-GRASP technique. A representative slice of the in vivo experiments is also shown in Figure 5 along with the different parameters used in the scan. The acquired in vivo T1 maps are also visually consistent confirming prior statistical observations.
Conclusion
This study demonstrated the good repeatability of MP-GRASP for T1 mapping over time, as well as its robustness to variation of different imaging parameters. With fast repeatable and reliable T1 mapping, MP-GRASP represents a promising quantitative MRI technique towards future routine clinical translate.Acknowledgements
NIH R01 EB030549References
1. Taylor AJ, Salerno M, Dharmakumar R, Jerosch-Herold M. T1 Mapping Basic Techniques and Clinical Applications. JACC Cardiovasc Imaging. 2016;9(1):67-81. doi:10.1016/j.jcmg.2015.11.005
2. Bottomley PA, Hardy CJ, Argersinger RE, Allen moore G. A review of 1H nuclear magnetic resonance relaxation in pathology: Are T1 and T2 diagnostic? Med Phys. 1987;14(1):1-37. doi:10.1118/1.596111
3. Puntmann VO, Peker E, Chandrashekhar Y, Nagel E. T1 Mapping in Characterizing Myocardial Disease: A Comprehensive Review. Circ Res. 2016;119(2):277-299. doi:10.1161/CIRCRESAHA.116.307974
4. Fontana M, Banypersad SM, Treibel TA, et al. Native T1 mapping in transthyretin amyloidosis. JACC Cardiovasc Imaging. 2014;7(2):157-165. doi:10.1016/j.jcmg.2013.10.008
5. Puntmann VO, Voigt T, Chen Z, et al. Native T1 mapping in differentiation of normal myocardium from diffuse disease in hypertrophic and dilated cardiomyopathy. JACC Cardiovasc Imaging. 2013;6(4):475-484. doi:10.1016/j.jcmg.2012.08.019
6. Vrenken H, Geurts JJG, Knol DL, et al. Whole-brain T1 mapping in multiple sclerosis: Global changes of normal-appearing gray and white matter. Radiology. 2006;240(3):811-820. doi:10.1148/radiol.2403050569
7. Larsson HBW, Frederiksen J, Petersen J, et al. Assessment of demyelination, edema, and gliosis by in vivo determination of T1 and T2 in the brain of patients with acute attack of multiple sclerosis. Magn Reson Med. 1989;11(3):337-348. doi:10.1002/MRM.1910110308
8. Coolen BF, Poot DHJ, Liem MI, et al. Three-dimensional quantitative T1 and T2 mapping of the carotid artery: Sequence design and in vivo feasibility. Magn Reson Med. 2016;75(3):1008-1017. doi:10.1002/mrm.25634
9. Jellis CL, Kwon DH. Myocardial T1 mapping: modalities and clinical applications. Cardiovasc Diagn Ther. 2014;4(2):126-137. doi:10.3978/j.issn.2223-3652.2013.09.03
10. Kim KA, Park MS, Kim IS, et al. Quantitative evaluation of liver cirrhosis using T1 relaxation time with 3 tesla MRI before and after oxygen inhalation. J Magn Reson Imaging. 2012;36(2):405-410. doi:10.1002/jmri.23620
11. Horowitz JM, Venkatesh SK, Ehman RL, et al. Evaluation of hepatic fibrosis: a review from the society of abdominal radiology disease focus panel. Abdom Radiol. 2017;42(8):2037-2053. doi:10.1007/s00261-017-1211-7
12. Goldberg MA, Hahn PF, Saini S, et al. Value of T1 and T2 relaxation times from echoplanar MR imaging in the characterization of focal hepatic lesions. Am J Roentgenol. 1993;160(5):1011-1017. doi:10.2214/ajr.160.5.8470568
13. Huang Y, Sadowski EA, Artz NS, et al. Measurement and comparison of T1 relaxation times in native and transplanted kidney cortex and medulla. J Magn Reson Imaging. 2011;33(5):1241-1247. doi:10.1002/jmri.22543
14. Fennessy FM, Fedorov A, Gupta SN, Schmidt EJ, Tempany CM, Mulkern R V. Practical considerations in T1 mapping of prostate for dynamic contrast enhancement pharmacokinetic analyses. Magn Reson Imaging. 2012;30(9):1224-1233. doi:10.1016/j.mri.2012.06.011
15. Feng L, Liu F, Soultanidis G, et al. Magnetization-prepared GRASP MRI for rapid 3D T1 mapping and fat/water-separated T1 mapping. Magn Reson Med. 2021;86(1):97-114. doi:10.1002/mrm.28679
16. Captur G, Gatehouse P, Keenan KE, et al. A medical device-grade T1 and ECV phantom for global T1 mapping quality assurance - the T1 Mapping and ECV Standardization in cardiovascular magnetic resonance (T1MES) program. J Cardiovasc Magn Reson. 2016;18(1):1-20. doi:10.1186/s12968-016-0280-z
Figures