4098
Imaging hypoxia in two brain tumor models using GdDO3NI
Babak Moghadas1, Jonathan Scirone1, Matthew Scarpelli2, Alberto Fuentes2, C. Chad Quarles2, and Vikram D. Kodibagkar3
1Arizona State University, Tempe, AZ, United States, 2Barrow Neurological Institute, Phoenix, AZ, United States, 3School of Biological and Systems Engineering, Arizona State University, Tempe, AZ, United States
1Arizona State University, Tempe, AZ, United States, 2Barrow Neurological Institute, Phoenix, AZ, United States, 3School of Biological and Systems Engineering, Arizona State University, Tempe, AZ, United States
Synopsis
In this study we have used the hypoxia-targeting MRI contrast agent GdDO3NI, (a nitroimidazole-based T1 contrast agent) to image the development of hypoxia in two types of rodent brain tumor models. Our results indicate a range of signal enhancements from 0-17% over baseline in the C6 and 9L tumors using GdDO3NI with clearance from contralateral brain and muscle tissue. This study further demonstrates the utility of GdDO3NI in non-invasive imaging of tissue hypoxia with high resolution.
Introduction
Glioblastoma multiforme (GBM) is the most common and deadliest type of primary malignant brain tumor. A chronic hypoxic microenvironment in solid tumors, i.e. deficit of oxygen, leads to changes in tumor cell metabolism and upregulating pro-survival proteins which in turn increase angiogenesis, proliferation, invasion, and metastases. The importance of hypoxia as a key factor in choosing therapy for patients, and personalized treatments has led development of imaging methods to assess tissue hypoxia in brain tumors [1,2]. Here, we determined the tumor hypoxia in 2 rat orthotopic glioma models using GdDO3NI a nitroimidazole-based T1 contrast agent for MRI in dynamic contrast enhancement (DCE) method. The hypoxia targeting contrast agent, GdDO3NI, had been synthesized as described previously [3].Materials and methods
All animal studies were performed in accordance with Institutional Animal Care and Use Committee approved animal protocol. Female Fischer rats were inoculated with 9L and Wister rats with C6 tumor models as described previously[1]. Imaging was performed after 25 days or more post implantation at 7 T with a preclinical MR scanner. Anatomical imaging was performed using a T2-weighted spin echo sequence with the following parameters: TR= 6.4s, TE= 50ms, averages= 4, matrix = 128x128, FOV=3.2cm×3.2cm, thickness = 1mm. The DCE study was performed using a FLASH sequence with TR=100ms, TE=2.5ms and a flip angle of 40 degree pre and post 2h after injection of 0.1 mmol/kg GdDO3NI. Image analysis was performed using built in-house algorithms with MATLAB. Data analysis was performed on regions of interest (ROIs) drawn on MR images. To normalize the data with the amount of delivered contrast agent for each animal, normalized differential enhancement (NDE) was calculated. The NDE is defined as the difference in percentage enhancement between the tumor region and the contralateral brain and the result is divided by the maximum value of the muscle enhancement for each data set. Results are presented as means ± standard deviation for rats. Individual groups were statistically compared with t-test and results with p<0.05 were considered significant.Results and Discussion
Figure 1 shows the time course contrast enhancement for three different ROIs: tumor, contralateral brain, and muscle on the representative animals. Our results indicate the signal enhancements of 0-17% in the tumors at 2hr post contrast using GdDO3NI with complete clearance from contralateral brain and muscle tissue. The comparison between enhanced MR imaging in the two cohorts with similar tumor sizes shows the 9L tumor have little to no hypoxia, while the C6 tumor exhibits considerable enhancement i.e. higher retention of contrast agent at 2hr post contrast. Table 1 summarize the tumor volume and the NDE value for the respective animal in each cohort. To study if there was any correlation between tumor size and the NDE value the correlation graphs were generated as Figure 2. There was no correlation between the tumor size and NDE in C6 group with a weak correlation for 9L (r2=0.53); however, the 9L cohort showed a good correlation between the tumor size and the NDE value for tumors with positive NDE values (r2= 0.99). This indicates that the C6 tumors develop hypoxic regions early and is not correlated with its size, which is in good agreement with the published reports[1].Conclusion
GdDO3NI allowed imaging of hypoxia in two brain tumor models using T1 wt DCE MRI. Our results indicate the presence of hypoxia in C6 tumors at a range of sizes as well as in large (> 20 mm3) 9L tumors.Acknowledgements
No acknowledgement found.References
1. Stokes AM, Hart CP, Quarles CC. Hypoxia Imaging With PET Correlates With Antitumor Activity of the Hypoxia-Activated Prodrug Evofosfamide (TH-302) in Rodent Glioma Models. Tomography. 2016;2(3): 2. Bruehlmeier M, Roelcke U, Schubiger PA, Ametamey SM. Assessment of Hypoxia and Perfusion in Human Brain Tumors Using PET with 18F-Fluoromisonidazole and 15O-H2O. 2004;45(11):1851-1859. 3. Rojas‐Quijano FA, Tircsó G, Tircsóné Benyó E, et al. Synthesis and Characterization of a Hypoxia-Sensitive MRI Probe. Chem – Eur J. 2012;18(31):9669-9676. doi:https://doi.org/10.1002/chem.201200266 29-237.Figures
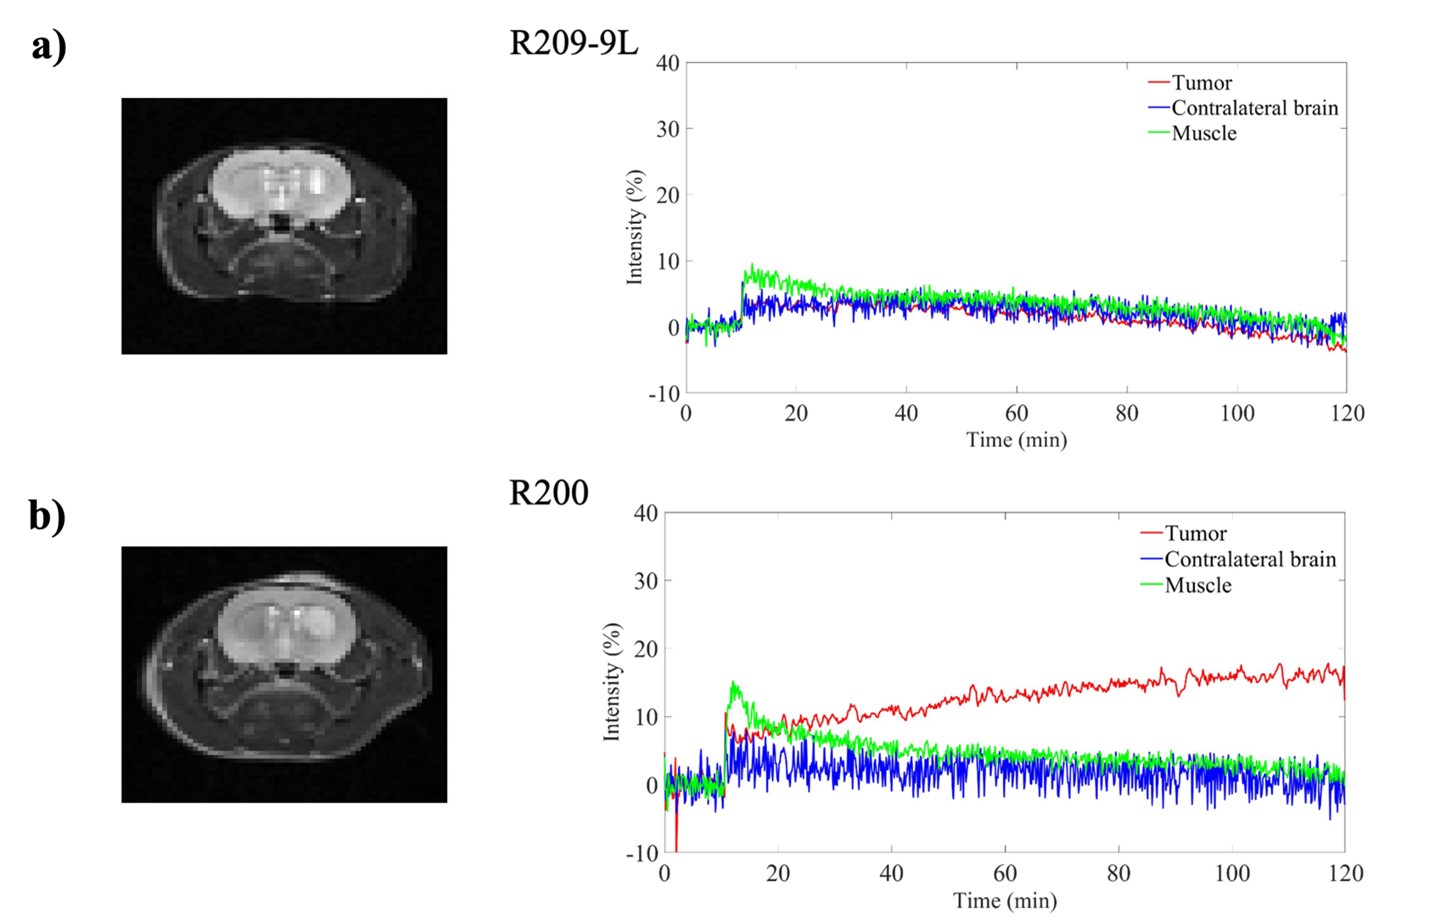
Percentage enhancement results from DCE
experiment over 2h, representative of 9L(top) and C6(bottom) tumors.
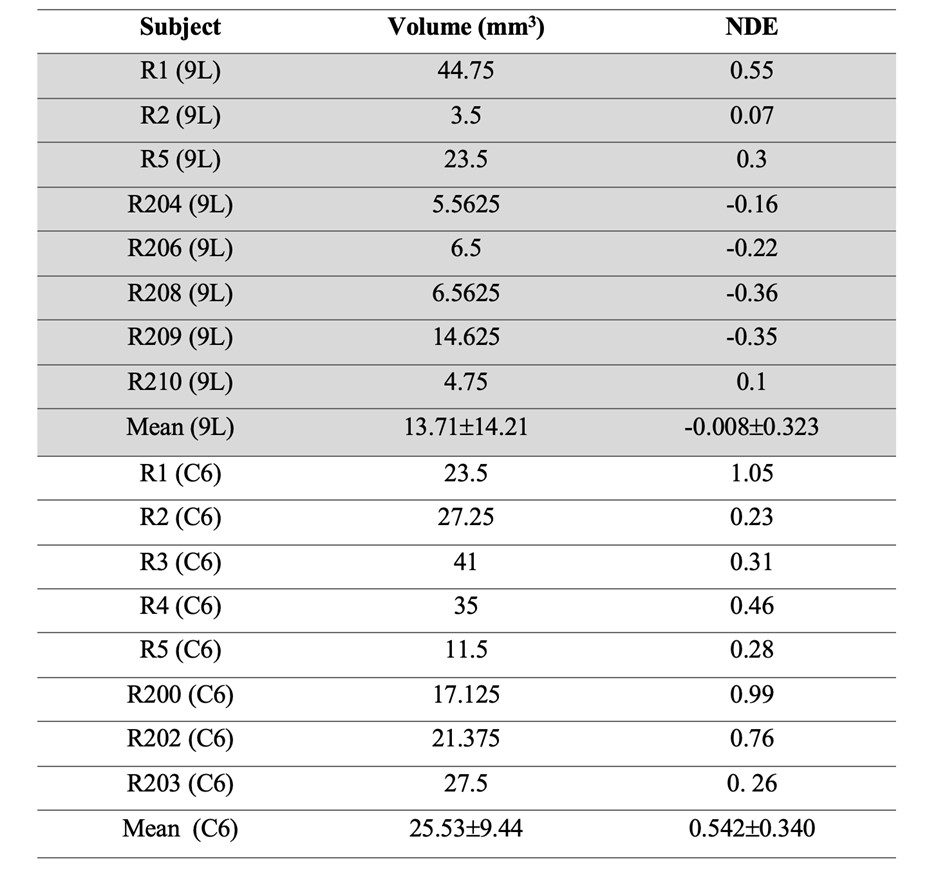
The tumor size and
the NDE value of the animals in the 9L and C6 cohorts.
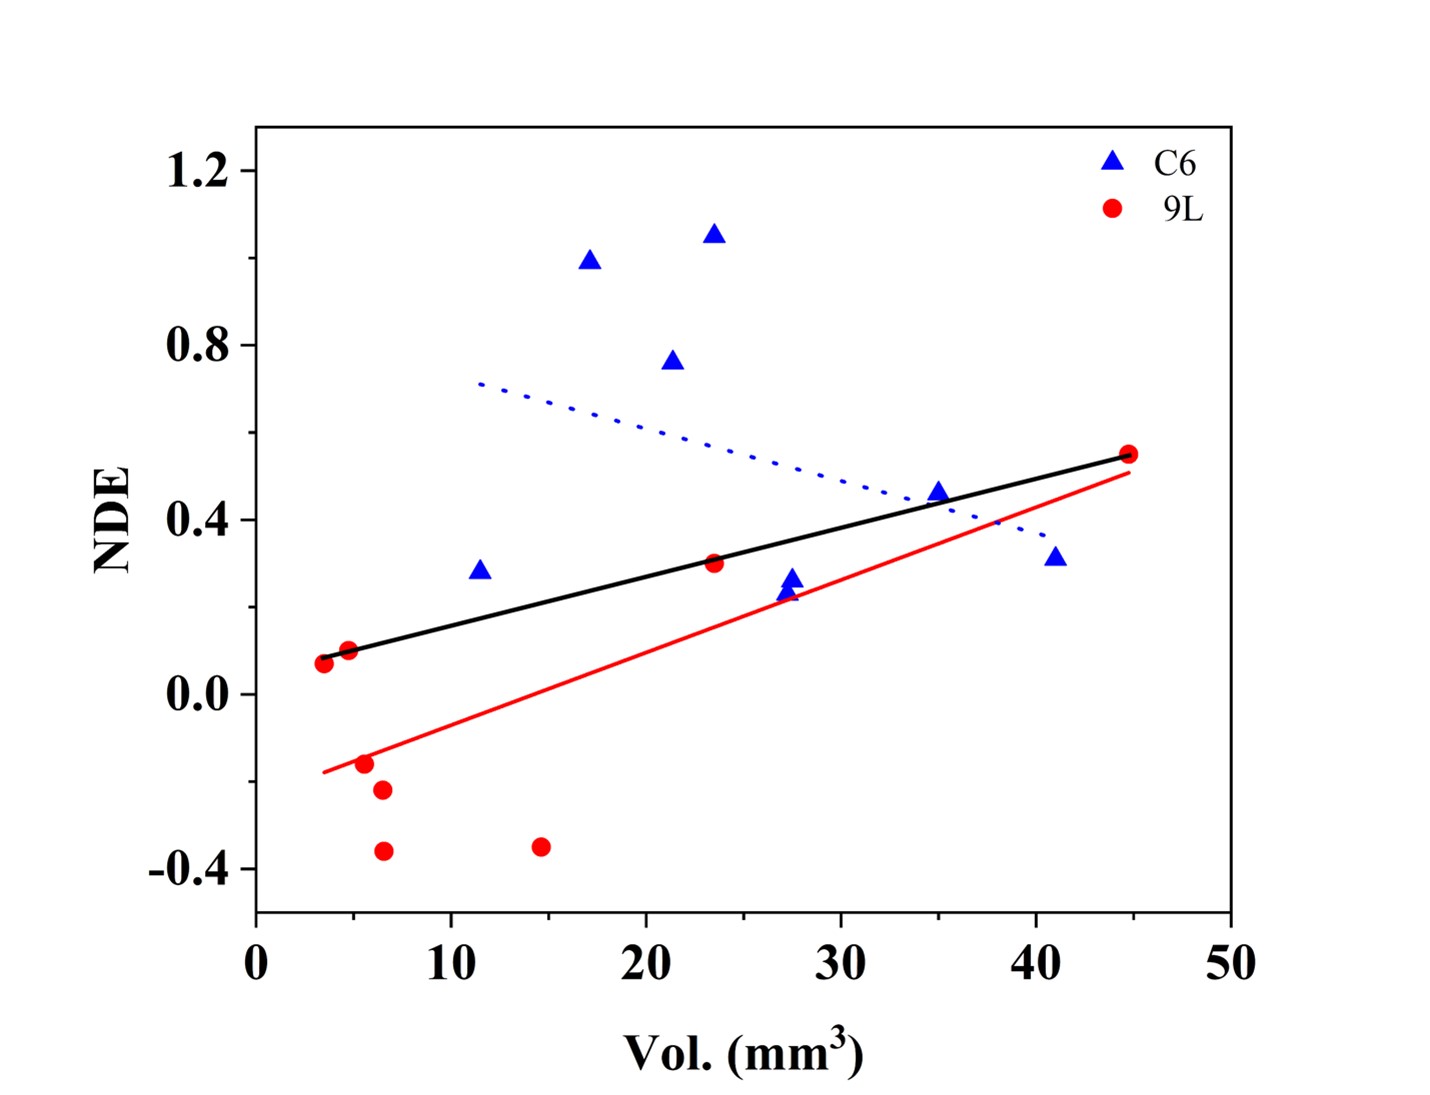
Correlation
between NDE and tumor volume in the 9L and C6 cohorts.
DOI: https://doi.org/10.58530/2022/4098