4097
An iron-based hypoxia targeting contrast agent
Babak Moghadas1, C. Chad Quarles2, and Vikram D. Kodibagkar3
1Arizona State University, Tempe, AZ, United States, 2Barrow Neurological Institute, Phoenix, AZ, United States, 3School of Biological and Systems Engineering, Arizona State University, Tempe, AZ, United States
1Arizona State University, Tempe, AZ, United States, 2Barrow Neurological Institute, Phoenix, AZ, United States, 3School of Biological and Systems Engineering, Arizona State University, Tempe, AZ, United States
Synopsis
We developed and tested a novel iron based contrast agent for imaging hypoxia using magnetic resonance imaging (MRI). After synthesis, the cytotoxicity data and the magnetic properties were studied to measure the relaxivity of the contrast agent. The ability of the contrast agent in targeting hypoxic was demonstrated in vitro by comparing cell cultures under hypoxia by T1 and T2 mapping. The cytotoxicity assay showed no significant changes to the cells’ viability over the period of 8h exposure to the contrast agent. The retention in the hypoxic condition is an indication of its performance under the proposed mechanism.
Introduction
Inadequate supply of oxygen known as hypoxia is an environmental feature that can affect the outcome of different pathologies[1]. Hypoxia can cause resistance to chemo- and radiotherapy, metastasis in cancer, alteration of therapy and neurological outcomes in TBI. Rojas‐Quijano et al. developed GdDO3NI[2] a Gd based hypoxia targeting contrast agent. While Gd-based agents are widely used, there are serious concerns for patients with impaired kidney function, and recent studies showed Gd accumulation in the bone and brain tissue even in patients with no renal impairment [3]. Iron-based contrast agents are considered versatile and capable of being engineered for different applications with the highest sensitivity. Here we test an iron-based hypoxia targeting contrast agent.Materials and Methods
The T1 and T2 relaxivities of the contrast agent were measured at 7T using a preclinical Bruker MRI scanner. The imaging parameters for this study were as matrix size 64 x 64, the field of view 2.56 cm x 2.56 cm and TR=205-5000 ms, TE=10 ms for the T1 map and TR=5000 ms, TE=8-200 ms for the T2 map. Alamar blue assay was used to study the cytotoxicity of the contrast agent [4]. NIH-3T3 fibroblast cells were exposed to different concentrations of the contrast agent for 4,8 and 24h under either hypoxic or normoxic conditions. The hypoxia targeting efficiency of the contrast agent was assessed by incubating cells in hypoxia or normoxia at 400 uM agent concentration . The exposed cells were imaged using a rat brain surface coil at 7 T. The T1 and T2 maps were calculated from Variable Repetition Time Fast Spin Echo (VTR) Sequence and multi-echo spin echo sequence, respectively. All results are reported as means ± standard deviations (SD).Results and Discussion
Figure 1 represents the result of the linear fit for R1 and R2 for the contrast agent. Using the linear fit function, the following equations are acquired for relaxation rate vs concentration, (red) and (gray) with R2>0.99 in both cases. The r2/r1 relaxivity ratio of 8.84, indicates its potential to generate T2 contrast. Cytotoxicity assay was a viability test using Alamar blue. The results are summarized in Figure 2 for normoxic and hypoxic conditions. The data showed no significant reduction (n=3) in the viability after up to 24h exposure of the cells to contrast agent at the concentrations of 100-400 μM using the control of the 4h exposure to assess the viability. The cytotoxicity assay under normoxic and hypoxic conditions did not show any significant difference in the final result this could indicate the toxicity is just resulting from prolonged exposure to the contrast agent. In the in vitro labelling study, the control cells showed a T1 value of 2098±106 ms and T2 value of 90.2±12.6 ms. The T1 and T2 values of the cells exposed to the contrast agent under normoxia were 1793±165 ms and 59.3±9.3 ms respectively, and under hypoxic conditions those were 1909±162 ms and 32.4±3.4 ms. The statistical analysis and unpaired t-test on the volumetric data i.e. taking into account the entire cell pellet showed statistically significant changes in T1 and T2 values of the control cell sample compared to the exposed cells. The most significant change in concentration of iron was obtained when cells experienced hypoxic conditions. The concentration of the accumulated contrast agent, calculated using the relaxivity equation for transverse relaxation rate R2 was 5.98 mM under hypoxia compared to 2.88 mM under normoxic condition, thus showing 1.73 fold increase.Conclusion
We developed a novel iron based contrast agent and successfully studied its properties as a potential hypoxia targeting contrast agent. Cytotoxicity assay showed no significant changes in viability of the cells exposed to the contrast agent with concentrations up to 400 uM for 8 h. The in vitro studies showed the T2 values of exposed cells under the hypoxic conditions significantly was reduced compared to control and normoxia. The contrast agent can thus provide spatial distribution of hypoxia using T2 weighted MRI.Acknowledgements
No acknowledgement found.References
[1] M. Höckel and P. Vaupel, “Tumor Hypoxia: Definitions and Current Clinical, Biologic, and Molecular Aspects,” JNCI J. Natl. Cancer Inst., vol. 93, no. 4, pp. 266–276, Feb. 2001, doi: 10.1093/jnci/93.4.266. [2] F. A. Rojas‐Quijano et al., “Synthesis and Characterization of a Hypoxia-Sensitive MRI Probe,” Chem. – Eur. J., vol. 18, no. 31, pp. 9669–9676, 2012, doi: https://doi.org/10.1002/chem.201200266. [3] M. Rogosnitzky and S. Branch, “Gadolinium-based contrast agent toxicity: a review of known and proposed mechanisms,” BioMetals, vol. 29, no. 3, pp. 365–376, Jun. 2016, doi: 10.1007/s10534-016-9931-7. [4] P. Kumar, A. Nagarajan, and P. D. Uchil, “Analysis of Cell Viability by the alamar Blue Assay,” Cold Spring Harb. Protoc., vol. 2018, no. 6, p. pdb.prot095489, Jun. 2018, doi: 10.1101/pdb.prot095489.Figures
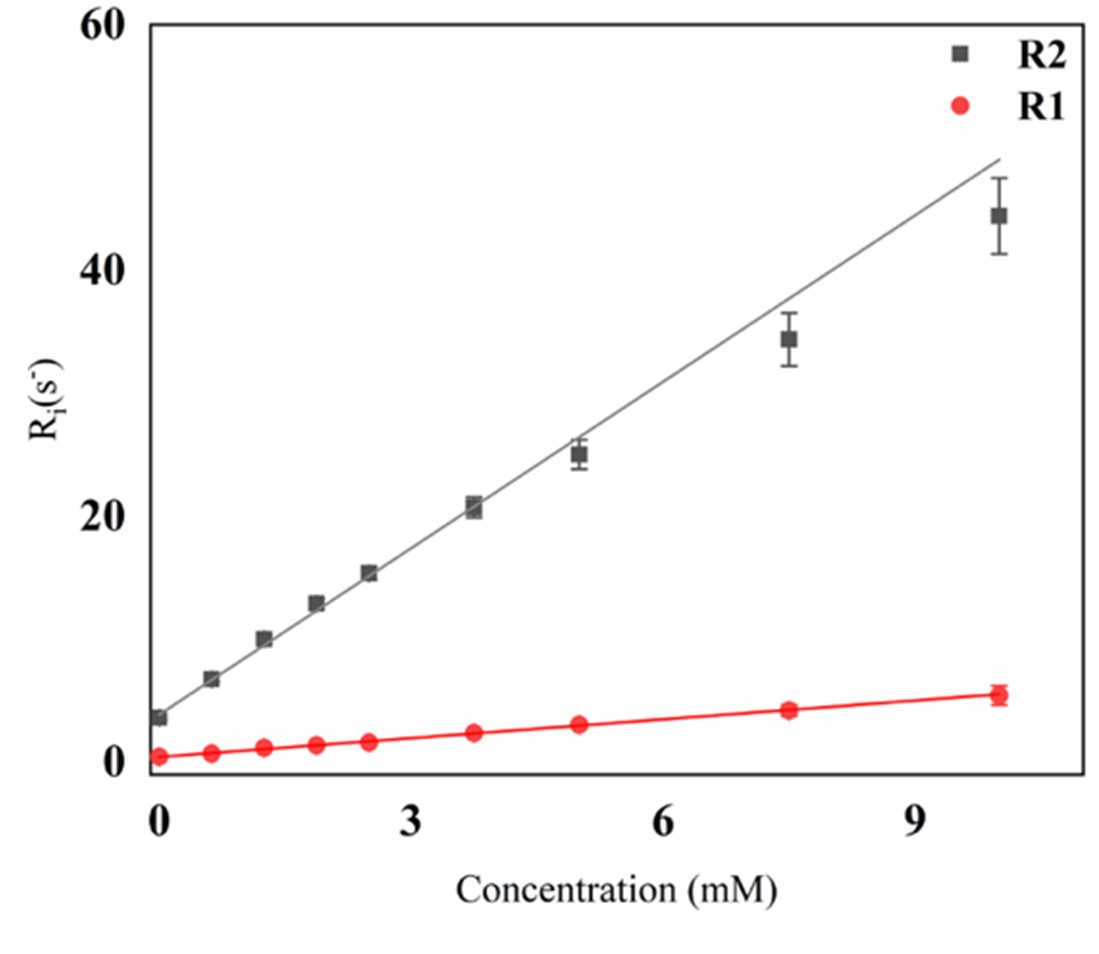
Relaxivity measurement of the contrast agent yields the linear fit equations as 𝑹𝟏 =(𝟎.𝟓𝟏±𝟎.𝟏)[𝑪]+(𝟎.𝟒𝟒±𝟎.𝟎𝟑) (in red) and 𝑹𝟐 =
(𝟒. 𝟓𝟏 ± 𝟎. 𝟏𝟒)[𝑪] + (𝟑. 𝟖𝟕 ± 𝟎. 𝟏𝟗) (in gray).
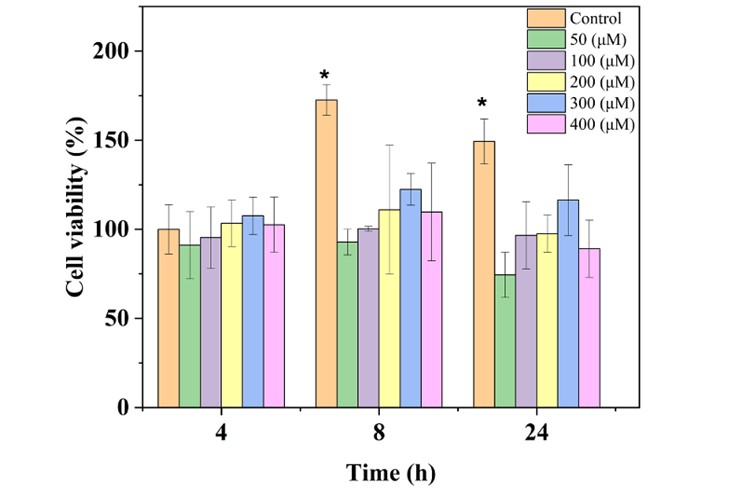
Fibroblast 3T3
cell viability assay using Alamar blue after being exposed to the
contrast agent over different periods under hypoxia. The * in each case shows
the statistical significance compared to control at 4h.
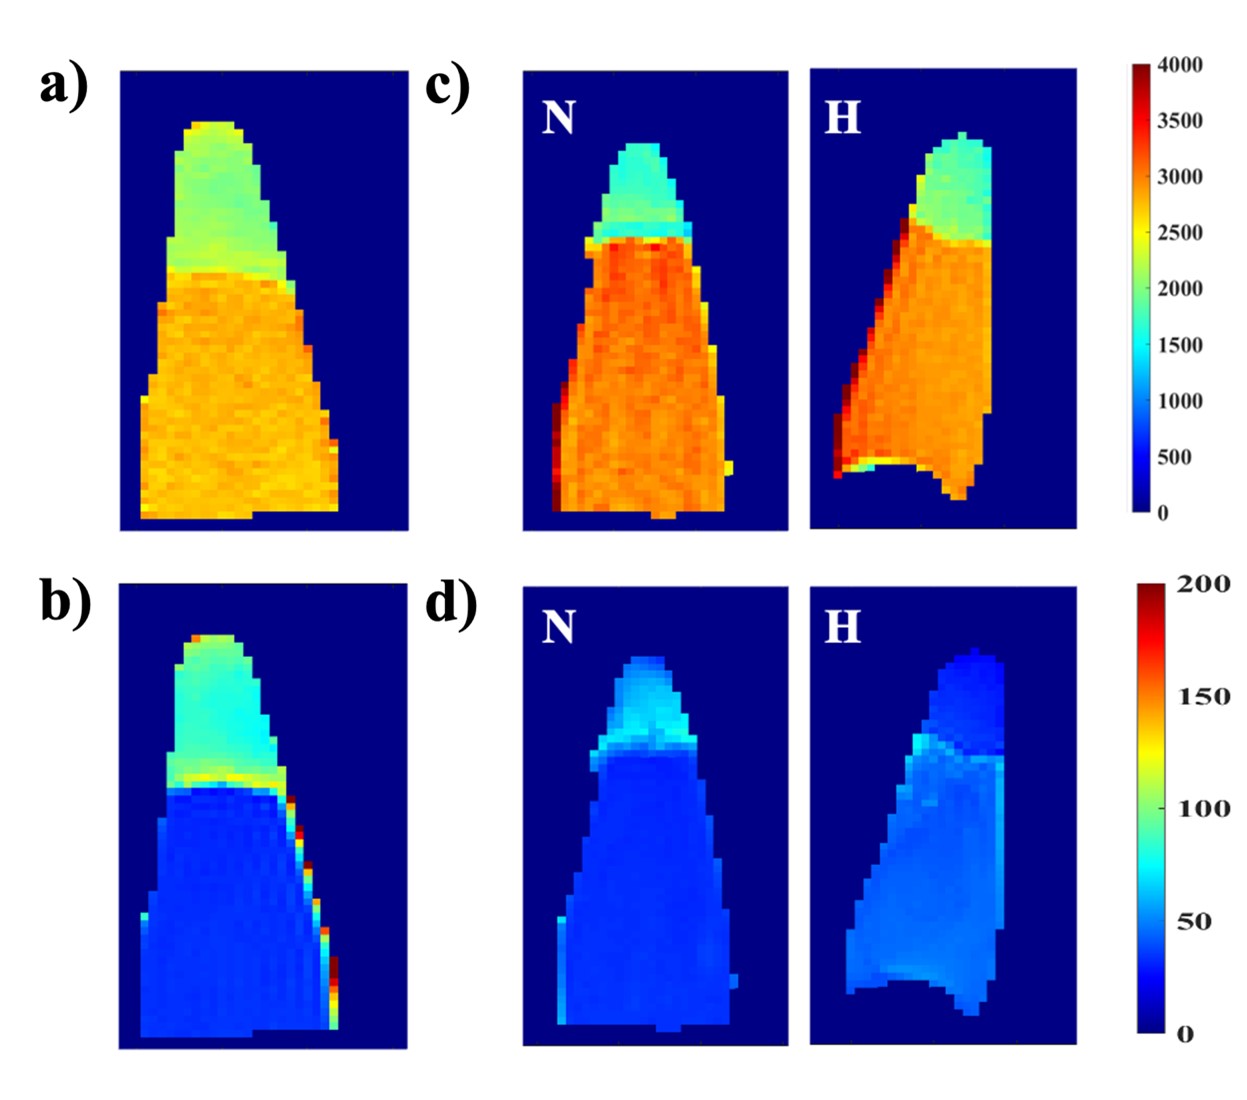
T1 (upper row)
and T2 (lower
row) maps of cell pellets, a) and b) control, c) and d) exposed to the contrast
agent under normoxic and hypoxic conditions.
DOI: https://doi.org/10.58530/2022/4097