4095
Oxygen Extraction Fraction using Quantitative BOLD and Cerebral Blood Flow during Vasodilation
Linh N N Le1, Gregory J Wheeler2, Alique M Momjian2, Corinne A Donnay3, Nicholas P Blockley4, and Audrey P Fan2,3
1Biomedical Engineering, University of California, Davis, San Diego, CA, United States, 2Biomedical Engineering, University of California, Davis, Davis, CA, United States, 3Neurology, University of California, Davis, Davis, CA, United States, 4School of Life Sciences, University Of Nottingham, Nottingham, United Kingdom
1Biomedical Engineering, University of California, Davis, San Diego, CA, United States, 2Biomedical Engineering, University of California, Davis, Davis, CA, United States, 3Neurology, University of California, Davis, Davis, CA, United States, 4School of Life Sciences, University Of Nottingham, Nottingham, United Kingdom
Synopsis
We quantified brain oxygen extraction fraction (OEF) using quantitative Blood-Oxygenation Level-Dependent (qBOLD) modeling of asymmetric spin echo (ASE) scans acquired at baseline and after pharmacological vasodilation with acetazolamide. In 9 healthy subjects, 60.51±42.00% CBF elevation and -8.45±9.71% OEF decrease in response to vasodilation was observed in multiple gray matter regions in the cortex. The correlation between cerebral blood flow (CBF) and OEF was inversely proportional (p=0.02), indicating complementary vascular responses to the acetazolamide stimulus.
Introduction
Brain tissue oxygenation is an important indicator for brain hemodynamic impairment in stroke, Alzheimer’s Disease, and other neurological conditions1-2. Quantitative BOLD model with R2′-weighted measurements using asymmetric spin echo pulse sequence (ASE) can provide measurements of tissue hemodynamic parameters, such as deoxygenated blood volume (DBV) and oxygen extraction fraction (OEF). In this study, our goal is to test OEF measurements from non-invasive qBOLD3,6 MRI during different physiological conditions induced by pharmacological vasodilation in healthy volunteers. We hypothesized that an increase in cerebral blood flow (measured by arterial spin labeling MRI) in brain tissue is correlated with a reduction in OEF as a compensation to maintain normal oxygen metabolic function.Methods
Nine healthy subjects (47±13 years, 7 female) were scanned on a 3T scanner (MAGNETOM Skyra, Siemens Healthineers, Erlangen, Germany) with a 32-channel head coil. The MR imaging acquisition protocols included a Gradient Echo Slice Excitation Profile Imaging (GESEPI) Asymmetric Spin Echo (GASE) scan, multi-delay ASL, and T1-weighted MPRAGE. To generate the quantitative CBF maps, the multi-delay arterial spin labeling (ASL) pulse parameters were the following: five post-labeling delays, 500-2500 ms; spatial resolution, 3.4x3.4x4.0 mm3; field of view (FOV) 220 mm; multi-band EPI factor = 6. The acquisition time was 6 minutes.For each subject, the GASE scan was acquired with an EPI readout with specialized z-shim gradients to mitigate within-slice homogeneities3,8. Imaging parameters included TR/TE, 3000ms/56 ms; 80 slices, 2.3x2.3x5 mm3 resolution; FOV, 224 mm. R2′ weighting was acquired by shifting the spin echo refocusing pulse for 7 values of the spin echo displacement time, τ, ranging from 16 ms to 40 ms in steps of 4 ms. The spin echo (τ = 0) was collected in a separate scan and aligned to the T1-weighted scan to create gray matter masks and define regions of interest. Total acquisition time was 3.5 minutes. Participants were administered with 15mg/kg acetazolamide as a pharmacological vasodilator and the GASE and ASL scans were repeated in the post-vasodilation state (after 15min of uptake time).
Data were preprocessed using FSL7, including kinetic modeling of ASL data in BASIL to generate CBF maps. GASE data were motion corrected with MCFLIRT and smoothed with a Gaussian kernel (σ = 1.5 mm) to reduce the effect of noisy voxels. GASE data were analyzed by using a linear qBOLD model, implemented in MATLAB4, which applies a linear fit of the GASE signal to τ > 15ms (total of 7 data points) as shown in Figure 1A. DBV and R2′ were estimated directly from the linear model; where DBV is the offset between the linear intercept and the spin echo data, and OEF was then quantified by known constant of proportionality:$$$\frac{3\times R_{2}'}{DBV\timesγ\times4\timesπ\timesΔ\chi_{0}\times Hct \times B0}$$$, with γ as the proton gyromagnetic ratio, Δχ0 as the susceptibility difference between fully oxygenated and deoxygenated red blood cells, Hct as hematocrit, and B0 as the field strength. All parameter maps were then mapped into a common reference space, Montreal Neurological Institute (MNI) space5 to create group-level average maps. Average OEF and CBF values were calculated for each ROIs (gray matter, frontal, parietal, temporal, and occipital lobes) and pairwise t-test with Bonferroni correction were used to determine the significant differences before and after injection of acetazolamide in each region. The correlation between CBF and OEF during vasodilation was assessed using a linear mixed effects model (in MATLAB) that accounted for subject clustering.
Results
Compared to baseline, increased CBF and decreased OEF were observed on the individual (Figure 1B) and group average level (Figure 2). The change in OEF and CBF in response to acetazolamide for each region were shown in Figure 3A-C. The correlation between ΔOEF and ΔCBF across all ROIs with the linear mixed-effect model, indicates that OEF change was inversely correlated with CBF change during vasodilation (p=0.02) (Figure 4).Discussion
With injection of acetazolamide, cortical regions with greater CBF increases also showed greater reduction in OEF from qBOLD, consistent with compensatory mechanisms in healthy individuals to maintain oxygen metabolism. In future analysis, non-linear model which fit to a complete qBOLD model, should be considered for analysis of OEF to address potential overestimation of OEF due to propagated error in R2′ estimation and noise in poor signal-to-noise ratio (SNR).Conclusion
The results demonstrate OEF measurements from qBOLD that are consistent across multiple physiological conditions and with ASL perfusion, suggesting that these two measurements are reliable indicators of tissue hemodynamic status. Further studies may assess oxygenation differences in white matter and neurovascular conditions including cerebrovascular disease and vascular dementia.Acknowledgements
This study was supported by NIH R00-NS102884References
- Yamauchi H, et al. Evidence of misery perfusion and risk for recurrent stroke in major cerebral arterial occlusive diseases from PET. J Neurol Neurosurg Psychiatry. 1996;61:18–25
- Yamauchi H, et al. Significance of increased oxygen extraction fraction in five-year prognosis of major cerebral arterial occlusive diseases. J Nucl Med 1999;40:1992–8.
- Stone, A., and Blockley, N. A streamlined acquisition for mapping baseline brain oxygenation using quantitative BOLD. NeuroImage. 2017; 147:79-88
- Cherukara, M., et al. Model-based Bayesian inference of brain oxygenation using quantitative BOLD. NeuroImage. 2019
- Evans A., et al. IEEE-Nuclear Science Symposium and Medical Imaging Conference. 1993; 1813-1817
- Yablonskiy, A., et al. Theory of NMR signal behavior in magnetically homogeneous tissues: the static dephasing regime. Magn. Reason. 1994; 32:749-763
- M. Jenkinson, et al. FSL. NeuroImage, 62:782-90, 2012
- Blockley, N., and Stone, A. Improving the specificity of R2' to the deoxyhaemoglobin content of brain tissue: Prospective correction of macroscopic magnetic field gradients. NeuroImage. 2016; 135: 253-260
Figures

(A) Schematic of qBOLD linear model explaining the transverse MR signal
decay in microvessels. Oxygen extraction fraction (OEF) is calculated by known
constants of proportionality from R2′ and DBV. (B) Representative maps
of OEF and CBF during vasodilation in one healthy volunteer. We observe that
CBF response to acetazolamide be increased with decreased OEF in response to
increased perfusion pressure.
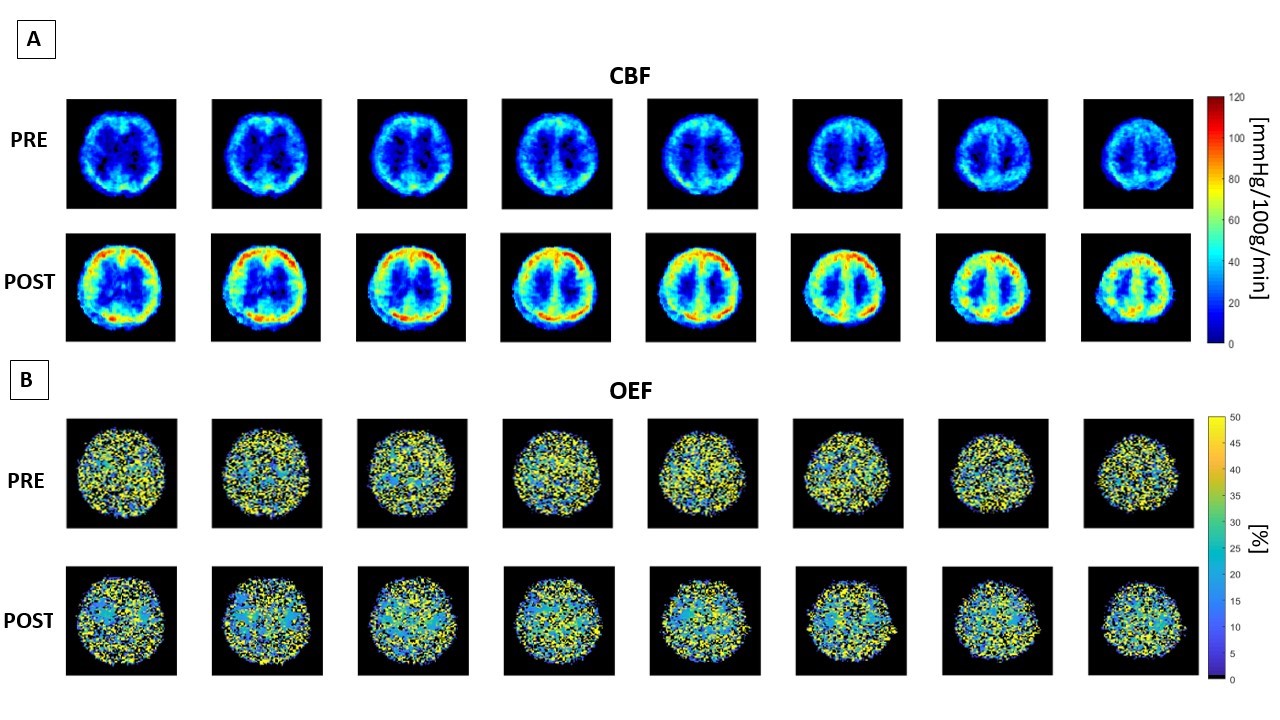
The average of cerebral blood flow (CBF) maps and oxygen extraction
fraction (OEF) maps across all 9 healthy subjects before (PRE) and after (POST)
vasodilation in Montreal Neurological Institute (MNI) space.
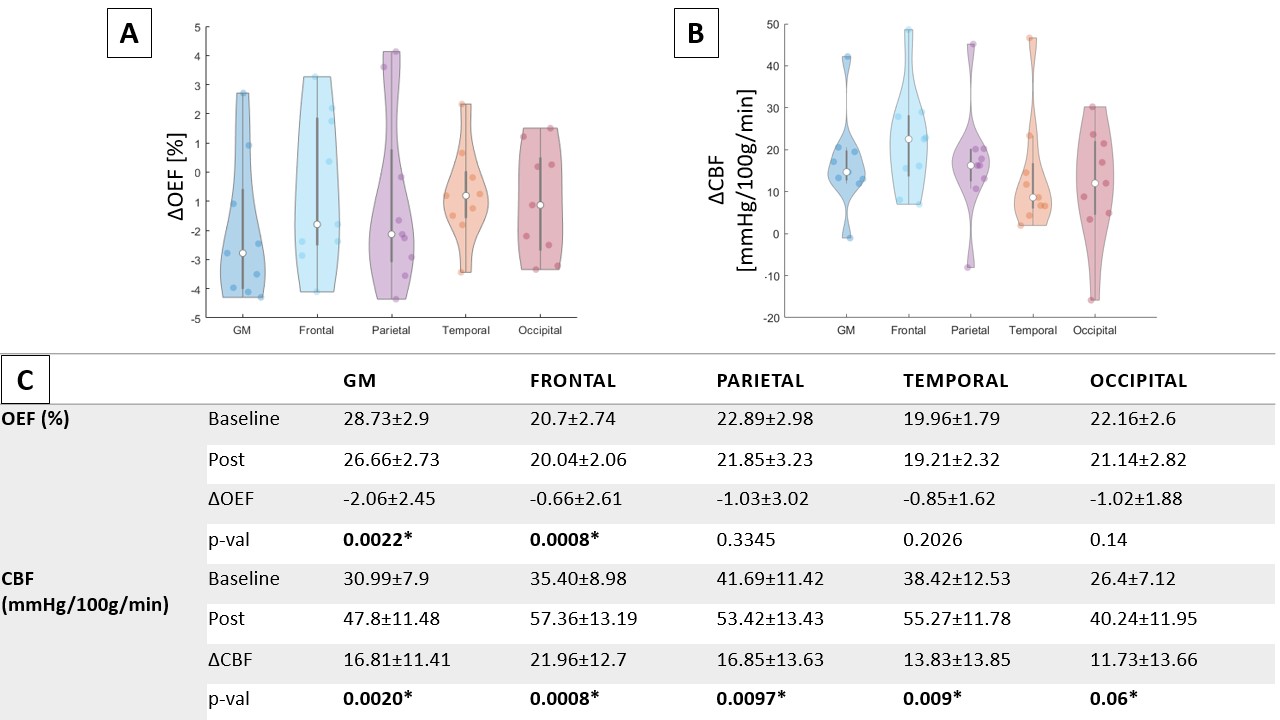
Changes in oxygen extraction fraction (OEF) in % (A) and cerebral blood
flow (CBF) in mmHg/100g/min (B) in response to acetazolamide at grouped level
in different ROIs: Gray Matter (GM), Frontal lobe, Parietal lobe, Temporal
lobe, and Occipital lobe. (C)
P-values for pairwise comparisons between pre- and post-acetazolamide of
changes in OEF in % and CBF in mmHg/100g/min with Bonferroni correction. All
tests were performed using pair-wise t-test. *p<0.01 after correction.
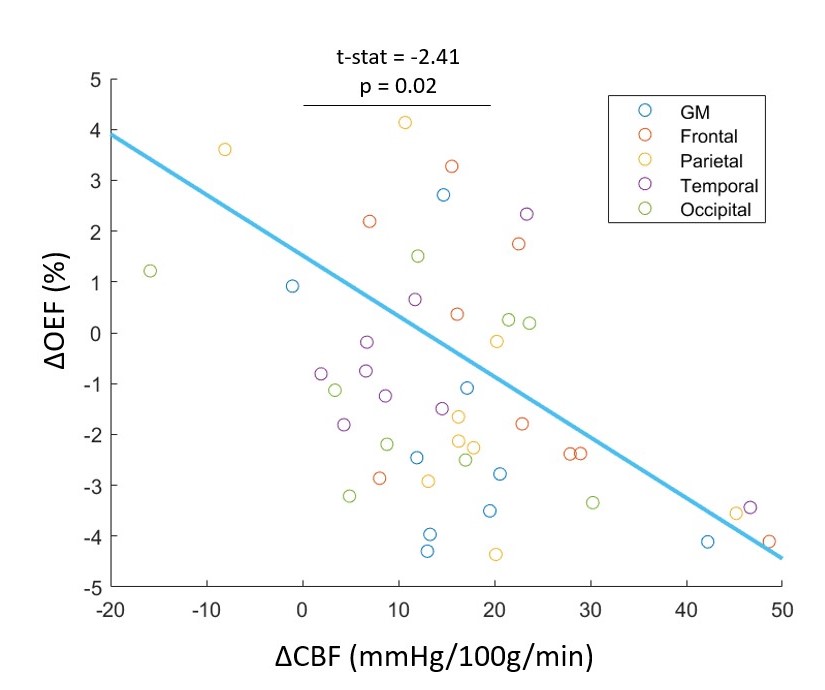
Scatterplot relating the change in cerebral blood flow (ΔCBF) to the
degree of change in oxygen extraction fraction (ΔOEF) in different ROIs in the
cerebral cortex. The blue solid line is the fitting from the linear
mixed-effects model fit adjusted for subject clustering.
DOI: https://doi.org/10.58530/2022/4095