4094
Comparison of Quantitative BOLD and Vascular MRF for Mapping Brain Oxygenation
Linh N N Le1, Gregory J Wheeler1, Thomas Christen2, Greg Zaharchuk3, and Audrey P Fan 1,4
1Biomedical Engineering, University of California, Davis, Davis, CA, United States, 2Grenoble Institute of Neuroscience, Grenoble, France, 3Radiology, Stanford University, Palo Alto, CA, United States, 4Neurology, University of California, Davis, Davis, CA, United States
1Biomedical Engineering, University of California, Davis, Davis, CA, United States, 2Grenoble Institute of Neuroscience, Grenoble, France, 3Radiology, Stanford University, Palo Alto, CA, United States, 4Neurology, University of California, Davis, Davis, CA, United States
Synopsis
We compared two approaches of quantitative Blood-Oxygenation Level-Dependent (qBOLD) and vascular MR Fingerprinting (vMRF) to map brain oxygenation from Gradient-Echo Sampling of Free Induction Decay and Echo (GESFIDE) scans acquired during normoxic, hyperoxic, and hypoxic gas breathing conditions. In 12 healthy subjects, OEF calculated from qBOLD (qOEF) and OEF generated from vMRF (vOEF) were inversely correlated to pulse oxygenation (SaO2) (p=0.032 and p=0.014, respectively), indicating that qBOLD and vMRF are reliable methods for brain oxygenation mapping.
Introduction
Brain oxygenation measurements are important indicators for studies of brain pathologies and physiology. Different MRI methods to measure brain oxygenation (e.g., oxygen extraction fraction) have been proposed, but have not been directly compared to each other. Quantitative BOLD (qBOLD) and Vascular magnetic resonance fingerprinting (vMRF) represent promising approaches for mapping brain oxygenation based on gradient and spin echo scans.1,5,7 This study directly compares qBOLD and vMRF oxygenation methods in healthy, young participants scanned at 3T across various oxygen inhalation conditions.Methods
Twelve healthy volunteers (33±6 yo) were scanned at 3.0 Tesla (MR 750, GE Healthcare, Waukesha, WI). The MR imaging acquisition protocols for this study included Gradient-Echo Sampling of Free Induction Decay and Echo (GESFIDE) imaging for oxygenation measurements and T1-weighted imaging for structural information and registration. GESFIDE imaging parameters were spin echo TESE/TR, 100/2000 ms; 40 TEs between 5 and 130 ms; voxel size 1.5x1.5x2.5 mm3; 14 slices. GESFIDE acquisitions (3.5 min / scan) were acquired while participants breathed hyperoxic gas (100% O2), normal air (21% O2), and hypoxic gas (14% O2) using an in-house gas delivery setup. GESFIDE was then aligned to T1-weighted scan to create gray matter masks and define regions of interest.In this study, we compared two modeling techniques to quantify brain oxygenation qBOLD and VMRF from the same GESIDE datasets (Figure 1). For vMRF, a dictionary of signal time-courses was generated by performing biophysical simulations of brain microvasculature with known susceptibility.8 The dictionary contained 64,000 signal time-courses using 40 different values of cerebral blood volume (CBV; 0-25%), microvascular vessel radii (R; 1-25 µm), and tissue oxygen saturation (SO2; 0-100%) in every possible combination. The signal evolutions across all 40 TEs for each voxel was then compared against this dictionary to find the single best fit using an iterative inner product pattern matching algorithm. With the closest simulated signal known, the CBV, R, and SO2 values associated with that best fit are assigned to that voxel. This was repeated for every voxel in the brain to generate full quantitative parameter maps. For a direct comparison of metrics to qBOLD, the SO2 measurements acquired using vMRF were converted to OEF measurements using $$$OEF = \frac{SaO_{2} - SvO_{2}}{SaO_{2}}$$$. Here SvO2 stands for venous oxygen saturation and represents the measurements obtained from vMRF for each voxel, and SaO2 is the average arterial oxygen saturation recorded via pulse oximeter throughout each scan.
For qBOLD modeling, R2′ was calculated by using the Free Induction Decay (FID) denoted as regime A of signal evolution, with decay rate of R2*A, and refocusing echoes (regime B) with decay rate R2*B: $$$R_2′ = \frac{R_2^*A - R_2^*B}{2}$$$. GESFIDE data were motion corrected with MCFLIRT and smoothed with a Gaussian kernel of (σ = 1.5mm) to eliminate the effect of noisy voxels in FSL6. The data then were analyzed by linear qBOLD model2, implemented in MATLAB, which applies a linear fit of GESFIDE signal to the spin echo displacement time, τ > 15ms (total of 5 data points) as shown in Figure 2B. Deoxygenated Blood Volume (DBV) was then estimated directly from the linear model; where DBV is the offset between the linear intercept and the spin echo data. OEF was then calculated by known constant of proportionality: $$$OEF = \frac{3\times R_2^{'}}{DBV \times \gamma \times 4 \times \pi \times \triangle \chi_{0} \times Hct \times B_{0}}$$$, with γ as the proton gyromagnetic ratio, Δχ0 as the susceptibility difference between fully oxygenated and deoxygenated red blood cells, Hct as hematocrit, and B0 as the field strength. All parameter maps from both vMRF and qBOLD were then transformed into a standard reference space (Montreal Neurological Institute (MNI) space)3, to create group-level average maps as shown in Figure 1. A linear mixed effects model was used to assess the correlation between OEF using the different methods and the changes in SO2 calculated from vMRF and OEF generated from qBOLD during different gas conditions.
Results
Compared to the normal air condition, Figure 3 shows changes in OEF during hyperoxia, and hypoxia. There was a significant increase in OEF during hyperoxia (p=0.001 and p=0.026, respectively); and slight opposite results for hypoxia in vMRF and qBOLD. The correlation between OEF from qBOLD (qOEF) and OEF from vMRF (vOEF) in gray matter with a mixed-effect model indicates a trend toward positive correlation between qOEF and vOEF across all subjects and conditions, as shown in Figure 4. OEF in brain gray matter was inversely correlated with increased arterial oxygen saturation, as measured by pulse oximetry for both oxygenation imaging methods (p=0.032 for vMRF and p=0.014 for qBOLD).Discussion and Conclusion
The finding of this study reveals that brain OEF measurements from both qBOLD and vMRF provide sensitivity to physiological changes across oxygen inhalation conditions. OEF values from vMRF were overestimated compared to literature values and compared to qBOLD. However, OEF maps from vMRF showed higher signal-to-noise ratio and more significant changes during different gas conditions, potentially reflecting the robustness of fingerprint matching to noise. Further studies may utilize these models to assess oxygenation changes in neurovascular conditions such as vascular dementia.Acknowledgements
This study was supported by NIH R00-NS102884.References
- Stone, A., and Blockley, N. A streamlined acquisition for mapping baseline brain oxygenation using quantitative BOLD. NeuroImage. 2017; 147:79-88
- Cherukara, M., et al. Model-based Bayesian inference of brain oxygenation using quantitative BOLD. NeuroImage. 2019
- Evans A., et al. IEEE-Nuclear Science Symposium and Medical Imaging Conference. 1993; 1813-1817
- Yablonskiy, A., et al. Theory of NMR signal behavior in magnetically homogeneous tissues: the static dephasing regime. Magn. Reason. 1994; 32:749-763
- Yablonskiy, DA. Quantification of Intrinsic Magnetic Susceptibility-Related Effects in a Tissue Matrix. Phantom Study. Magn Reson Med. 1998; 39:417-428
- M. Jenkinson, et al. FSL. NeuroImage, 62:782-90, 2012
- Christen T, Pannetier NA, Ni WW, et al. MR vascular fingerprinting: A new approach to compute cerebral blood volume, mean vessel radius, and oxygenation maps in the human brain. Neuroimage. 2014;89:262-270.
- Pannetier NA, Debacker CS, Mauconduit F, Christen T, Barbier EL. A Simulation Tool for Dynamic Contrast Enhanced MRI. PLoS ONE. 2013;8(3):e57636.
Figures
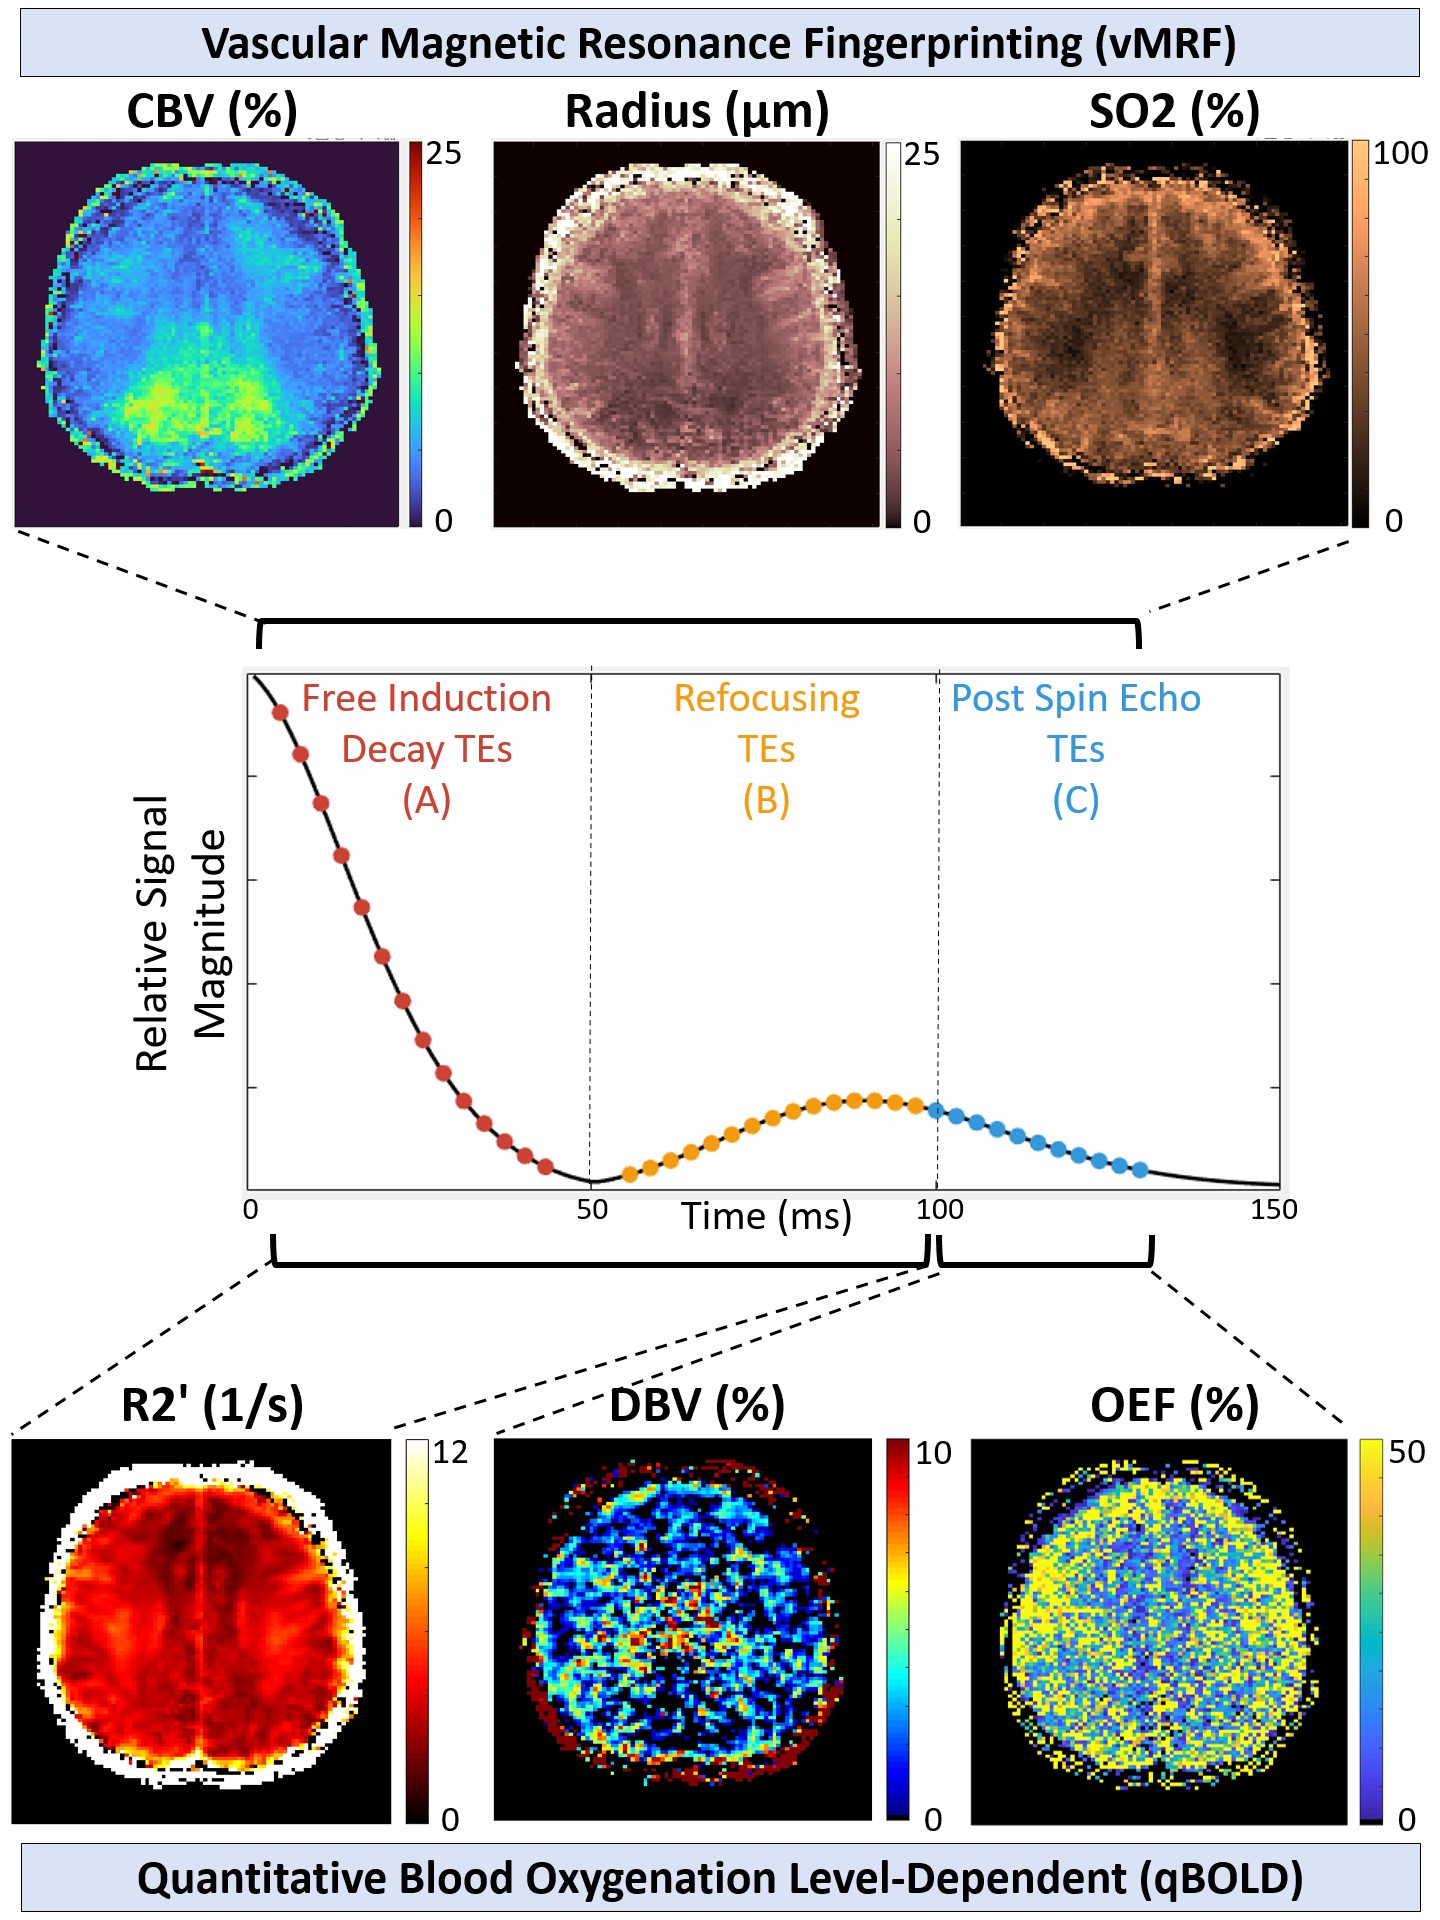
GESFIDE sequence with
brain mapping parameters from two different approaches, vMRF and qBOLD. vMRF
uses all echoes available in the imaging data while the qBOLD method here uses
certain subsets for different maps.
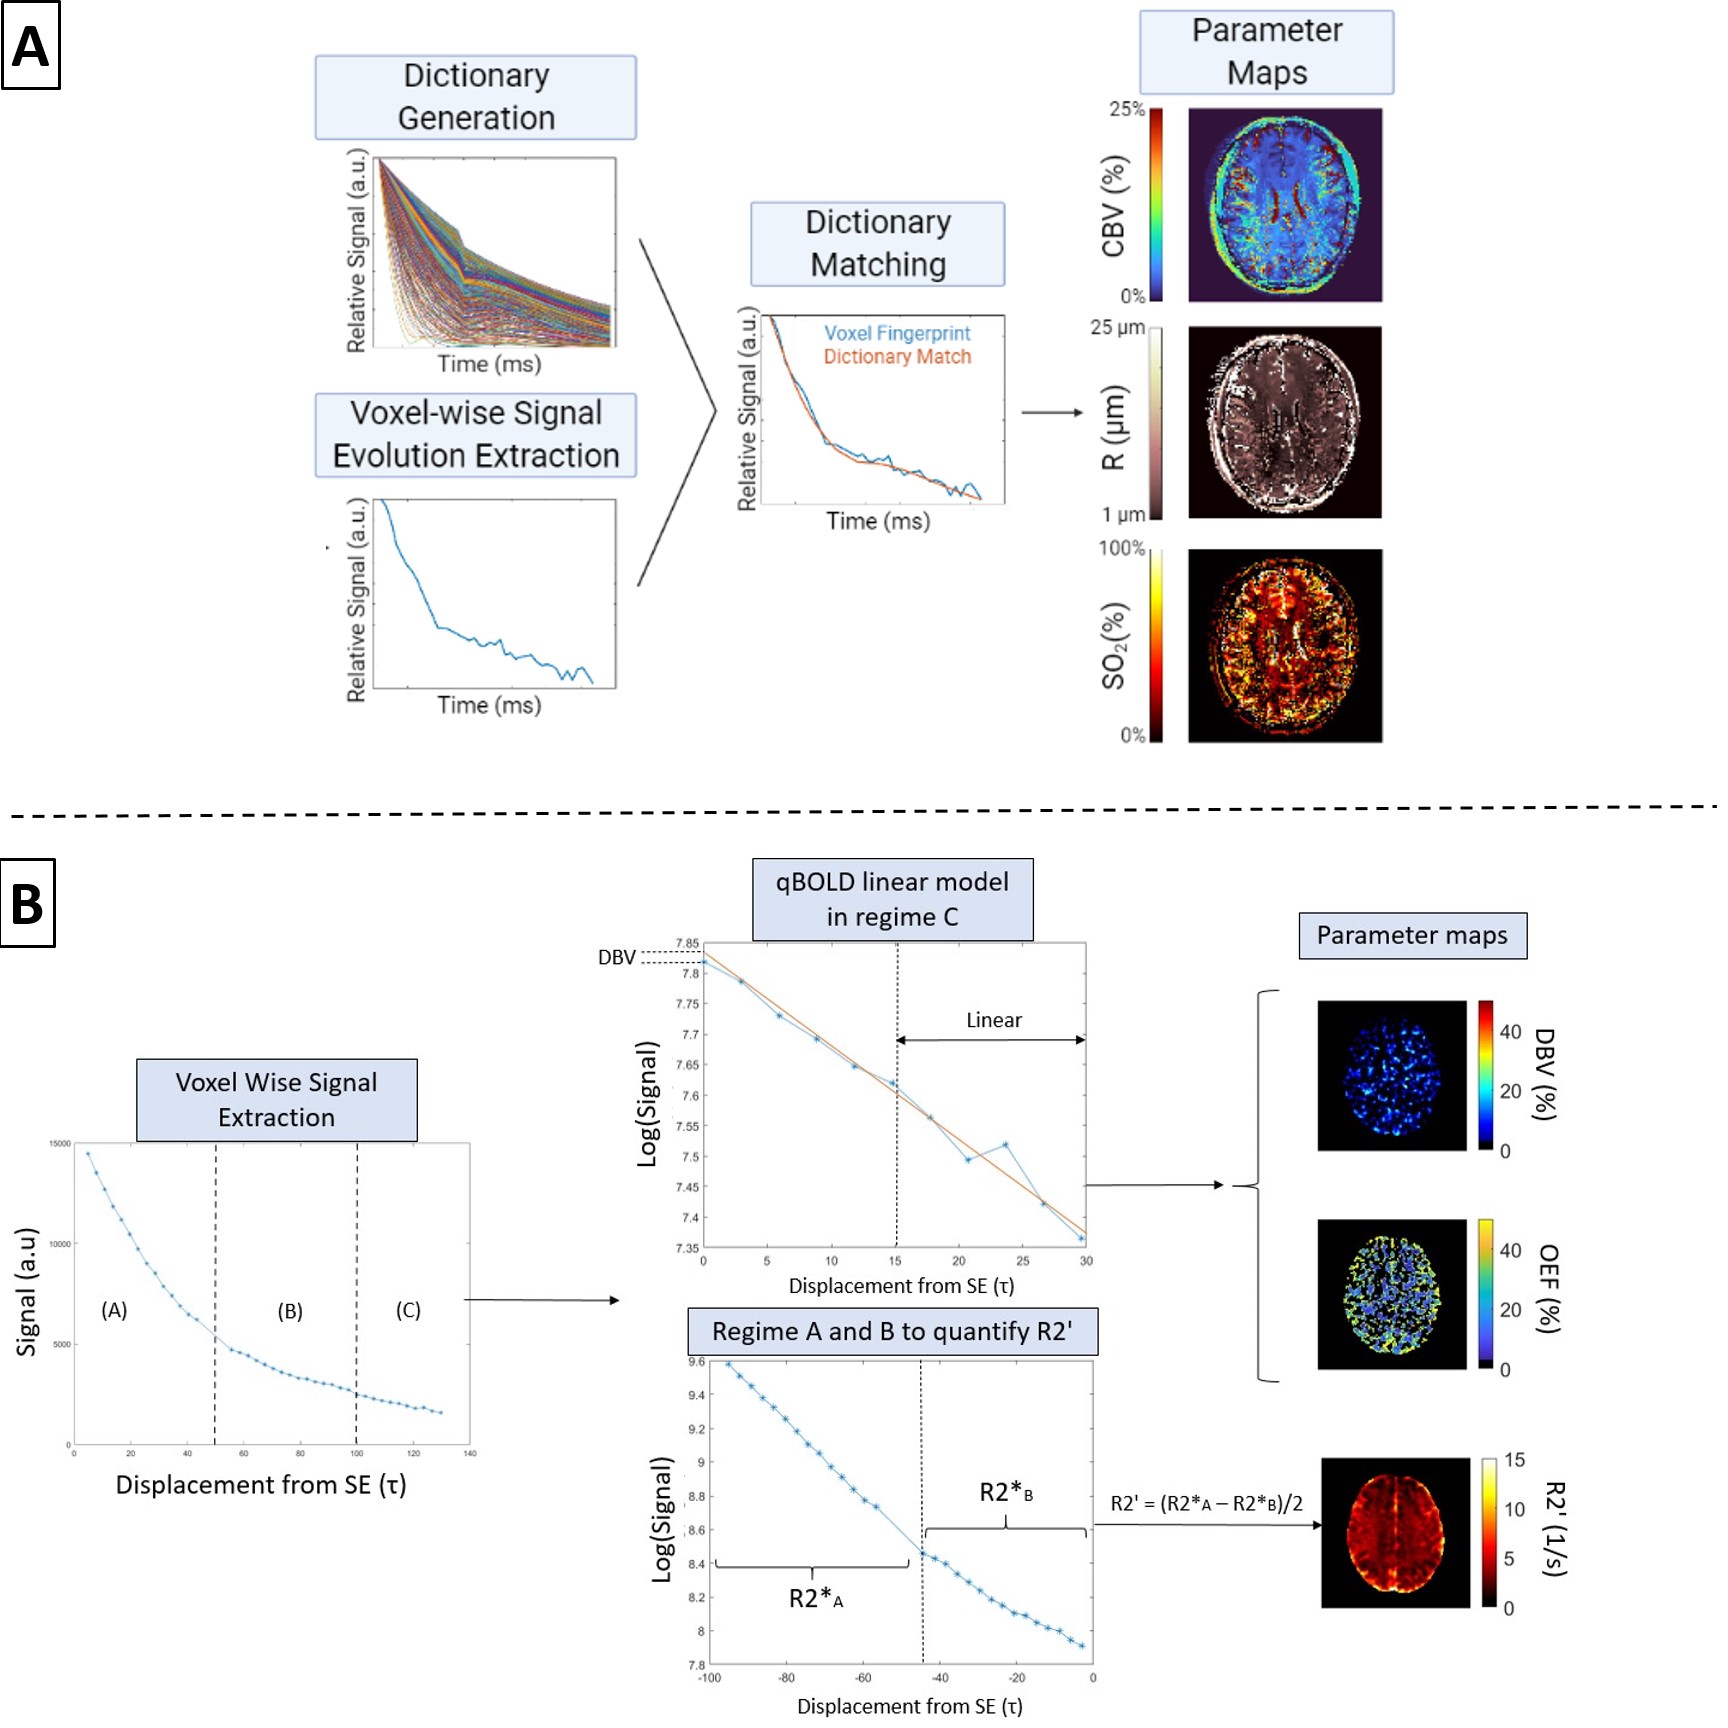
(A) Schematic of vascular
magnetic resonance fingerprinting (vMRF), in which simulated signals are matched
to the signal time-courses of imaged voxels. The CBV, R, and SO2 values
underlying the simulated signal that provided the best match for a given voxel
are then extracted for quantitative multi-parametric mapping. (B) Schematic of quantitative
BOLD linear model applied to regime C of the GESFIDE sequence. OEF is
calculated by known constants of proportionality from deoxygenated blood volume
(DBV) and R2′, which are calculated from regimes A and B.
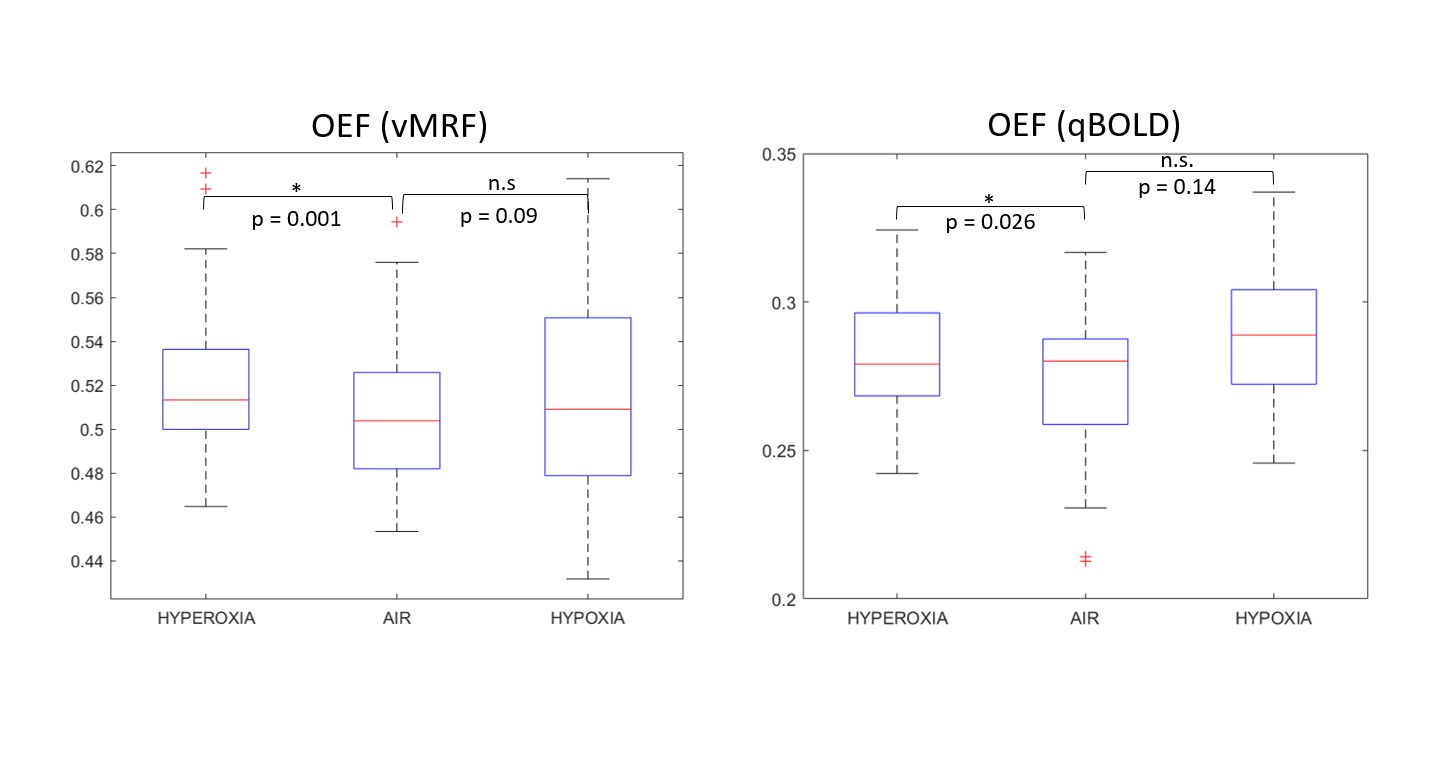
Percent changes in OEF
from vMRF and qBOLD during different oxygen inhalation conditions at a group
level in gray matter in the frontal and parietal lobes. * indicates that the p-value
is significant. n.s indicates a non-significant p-value.
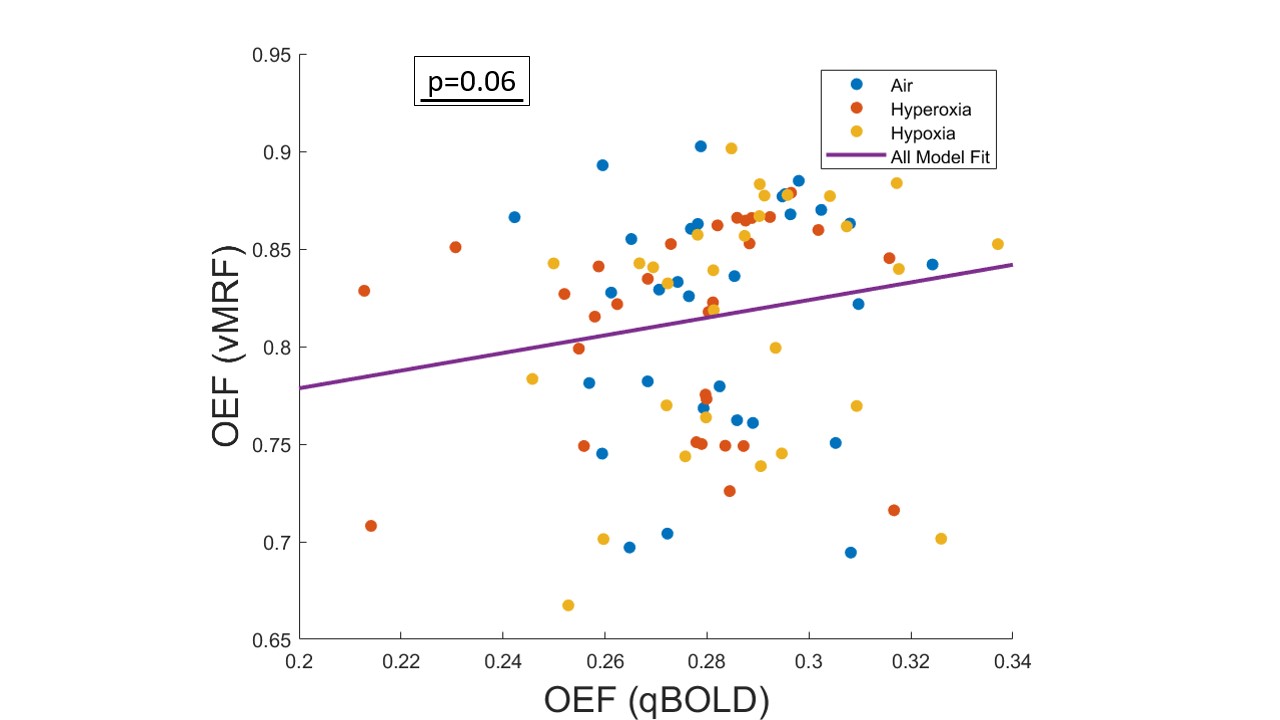
The correlation
between OEF across patients in gray matter in the frontal and parietal lobes from
two approaches (vMRF vs. qBOLD). The purple solid line is the fitting from the
linear-mixed effects model fit adjusted for subject clustering.
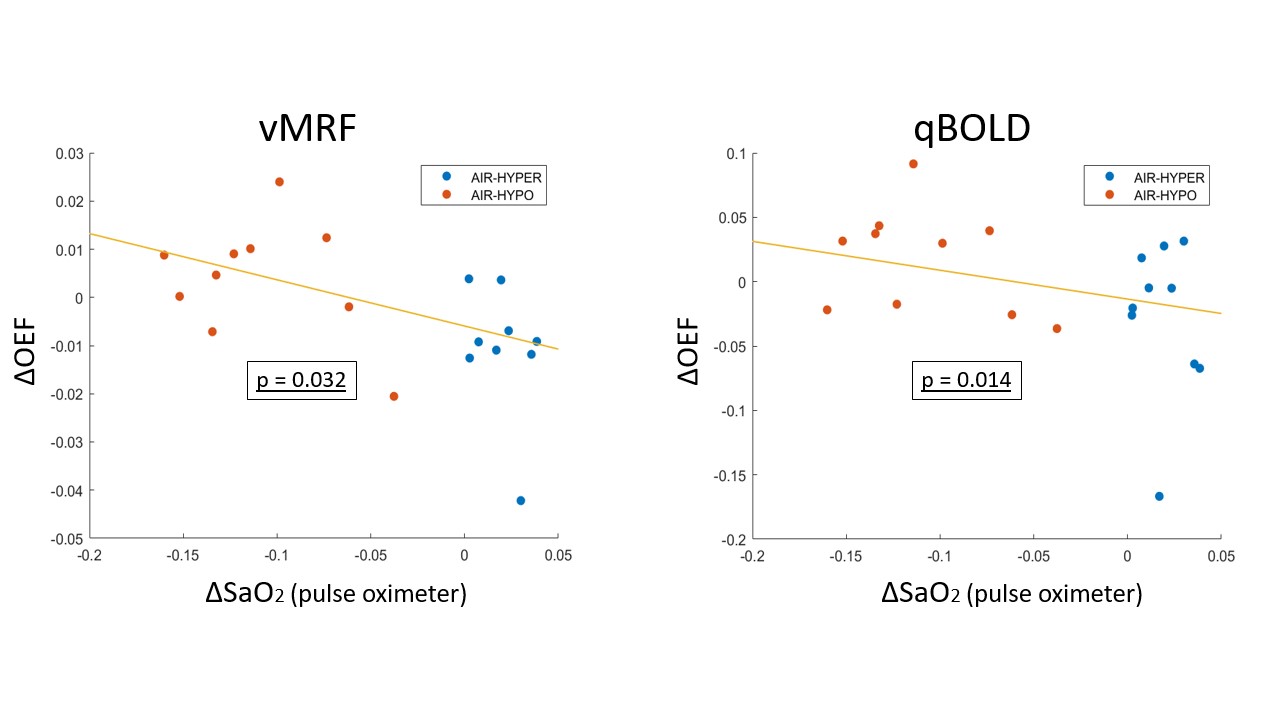
Scatterplot relating
the change in OEF in gray matter to the degree of change in arterial oxygen saturation
(SaO2) measured by pulse oximetry. The yellow solid line is the fitting from
the linear mixed-effects model fit adjusted for subject clustering with the vascular
magnetic fingerprinting (vMRF) approach (p=0.032) and the quantitative BOLD (qBOLD)
approach (p=0.014).
DOI: https://doi.org/10.58530/2022/4094