4093
Measuring cerebral venous oxygenation: multi-site multi-vendor standardization of TRUST MRI and association with end-tidal CO21Department of Diagnostic Radiology and Nuclear Medicine, University of Maryland School of Medicine, Baltimore, MD, United States, 2The Russell H. Morgan Department of Radiology & Radiological Science, Johns Hopkins University School of Medicine, Baltimore, MD, United States, 3Department of Biomedical Engineering, Johns Hopkins University School of Medicine, Baltimore, MD, United States, 4F.M. Kirby Research Center for Functional Brain Imaging, Kennedy Krieger Research Institute, Baltimore, MD, United States
Synopsis
This work presents a multi vendor multi-site MRI study in which a TRUST sequence was harmonized across three MRI platforms from GE, Siemens, and Philips to measure the cerebral venous oxygenation Yv. We carried out intra-scanner and inter-scanner analysis on the variability of the venous oxygenation measurements and demonstrated high measurements reproducibility across the three platforms. Moreover, we examined the relationship between the fluctuations in end-tidal CO2 and the Yv measurements and showed that end-tidal CO2 can reduce the variability in Yv measurements in multi-site setting.
INTRODUCTION
T2-Relaxation-Under-Spin-Tagging (TRUST) MRI1,2 is a widely used method for quantification of venous oxygenation (Yv), and has demonstrated its potential as a biomarker for various brain diseases3-9. Several new clinical trials are proposing to use TRUST as a secondary outcome measure. Since such large-scale clinical trials are based on a multi-site multi-vendor setting, ensuring the reproducibility of TRUST Yv measurements across multiple vendors is an important step to facilitate its use as a robust biomarker to characterize brain diseases.Previous evaluations of the reproducibility of TRUST were based on either a multi-site single-vendor (Philips) setting10 or a single-site dual-vendor (Philips and Siemens) setting11. In this work, the reproducibility of TRUST Yv measurements was evaluated across three major MR vendors (Philips, Siemens, and GE). These MRI scanners were located at two research institutions: University of Maryland School of Medicine (UM SOM) and Johns Hopkins University School of Medicine (JHU SOM). Moreover, previous single-site studies 11-13 revealed that normal variations in Yv can be accounted for by fluctuations in end-tidal CO2 (EtCO2). In the present study, we aimed to examine whether such relationship can be observed in a multi-site setting, in which Yv was measured by different MRI scanners and EtCO2 was measured by different capnograph devices.
METHOD
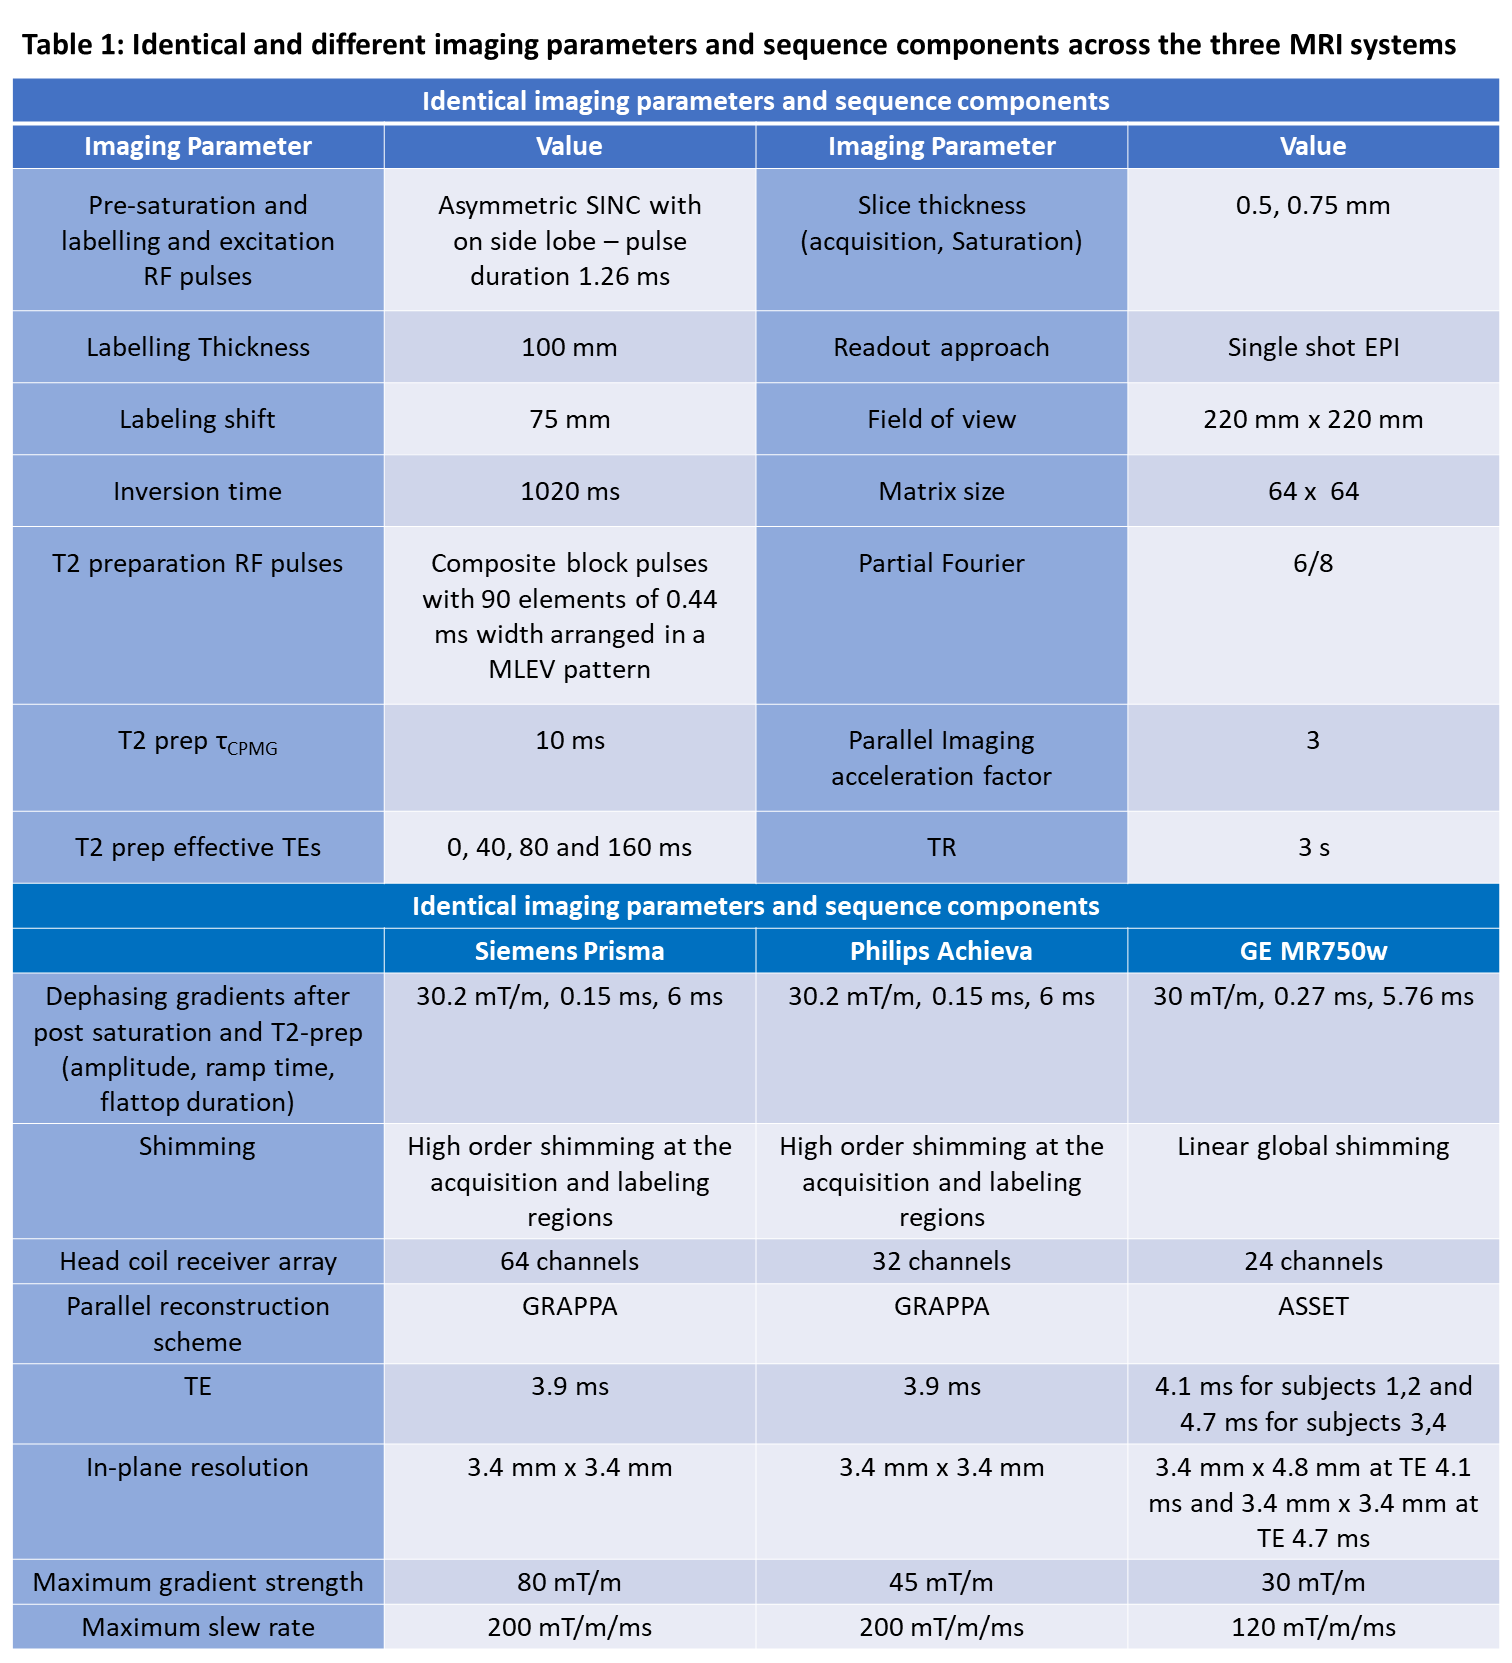
Pulse sequence: The TRUST pulse sequence was newly implemented on a 3T GE scanner. The sequence components were largely matched to a previously harmonized TRUST implementation on the other two vendors11, with only minor differences due to hardware limitations. Tables 1 summarizes the sequence parameters across the vendors.MRI experiments: Four healthy volunteers (4M, age 27.5±2.6) were recruited. Each participant was scanned with the standardized TRUST sequences on three MRI platforms: a 3T Siemens Prisma scanner and a 3T GE MR750w scanner located at UM SOM; and a 3T Philips Achieva scanner located at JHU SOM. All MRI scans for each subject were completed within a period of 4 hours to reduce physiological fluctuations. On each scanner, each subject was scanned in two sessions with repositioning to assess the inter-session reproducibility of TRUST Yv measurements. Within each session, three TRUST scans were performed to evaluate the intra-session variability. Importantly, each scanner was equipped with a capnograph device (NM3 Respiratory Profile Monitor, Philips Healthcare), and the EtCO2 of each subject was recorded during scanning.
Data analysis: The TRUST data were processed following the literature 2,11. Yv was obtained from the measured venous T2 using a published calibration model14, assuming a hematocrit of 0.42 for all subjects.
The relationship between Yv and EtCO2 was examined by linear regression analyses, separately for each subject and also for the entire group. If a dependence of Yv on EtCO2 was observed, we further performed a correction of the measured Yv values based on the recorded EtCO2 at each TRUST scan:
$$ Y_v\mid_{corrected}=Y_v\mid_{raw}-\alpha(EtCO_2-\overline{EtCO_2})$$
where $$$ \overline{EtCO_2}$$$ is the averaged EtCO2 across all TRUST scans of all subjects. The coefficient α used a literature value of 1.6%/mmHg11.
The intra-session, inter-session and inter-scanner variability in Yv measurements was assessed by calculating the coefficient-of-variation (CoV = standard deviation/mean).
RESULTS AND DISCUSSIONS
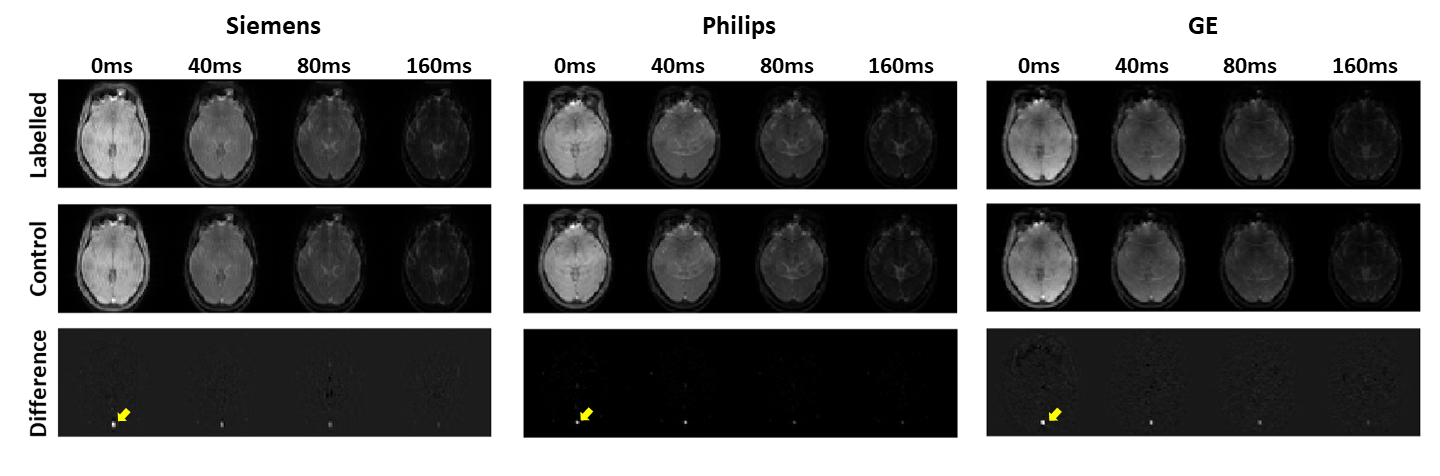
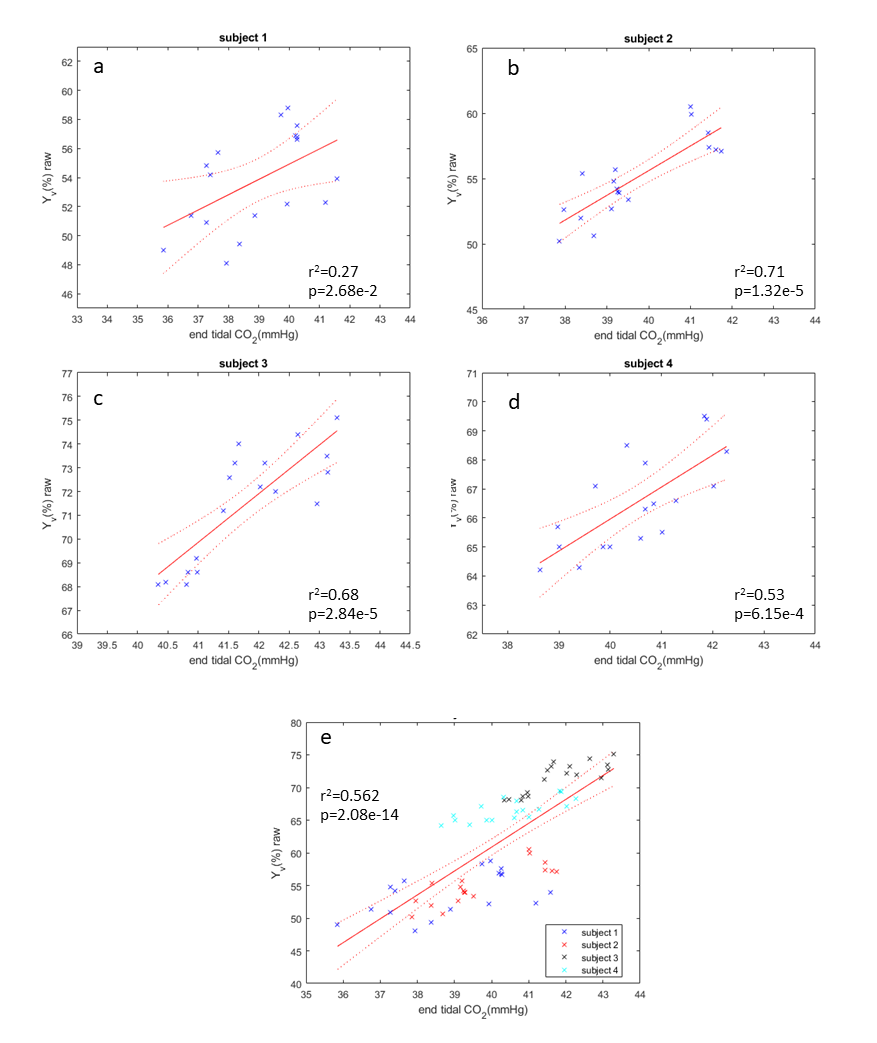
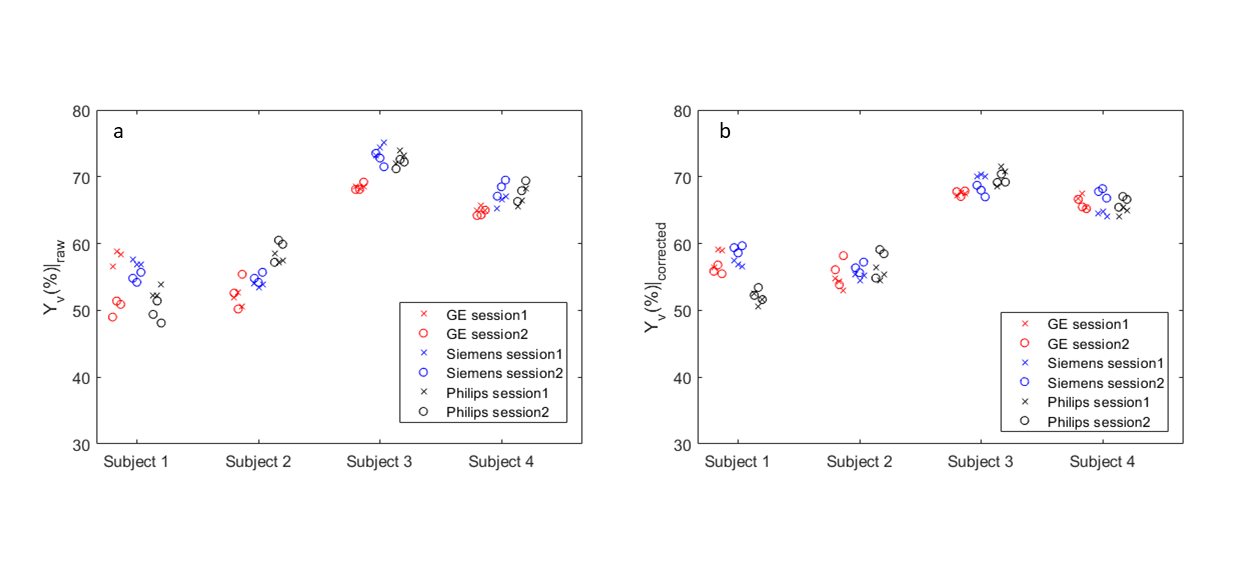
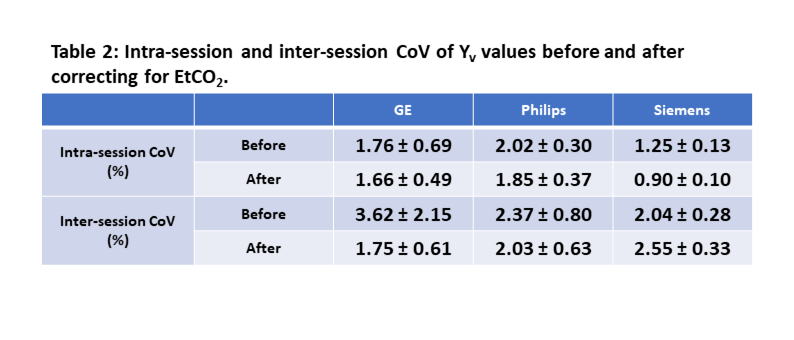
Figure 1 shows representative TRUST images from the three scanners. Strong venous signals in the superior-sagittal-sinus can be seen on all scanners (yellow arrows). As shown in Figure 2, there were strong positive correlations between the measured Yv and EtCO2 for each subject and also for the entire group. This demonstrates that the Yv-EtCO2 relationship is robust across different subjects in a multi-site multi-vendor setting. Therefore, we performed a correction of the measured Yv value based on EtCO2. Figure 3 shows the Yv data of each subject on each scanner before and after correction. Table 2 lists the intra-session and inter-session CoVs on each scanner. In general, correcting for EtCO2 tended to slightly reduce intra-session and inter-session CoV, although the difference is insignificant (paired t-test, P>0.2). The inter-scanner CoV was 4.3±0.87 % (mean ± standard error) before EtCO2 correction and it was reduced to 3.09±0.80 % after correction (P=0.052). In addition, we found that correcting for EtCO2 also reduced the inter-subject CoV of Yv, which was 13.5% and 10.1% before and after correction, respectively.Finally, we compared the TRUST Yv measurements across the three scanners. To minimize the influence of physiological fluctuations, we used the corrected Yv values for the cross-vendor comparisons. The average Yv values were 61.46±1.66 %, 61.00±1.51 %, and 62.22±1.17 % on GE, Philips and Siemens, respectively, showing no significant bias across the scanners (ANOVA P=0.796). There were no significant differences in the intra-session CoV (P=0.199) and inter-session CoV (P=0.587) across the scanners. These results suggest that the harmonized TRUST sequences have similar accuracy and reproducibility in Yv quantifications across the three vendors.
CONCLUSION
There were two major findings of this work. First, we demonstrated a robust correlation between Yv and EtCO2 in a multi-site multi-vendor setting. Accounting for EtCO2 reduced Yv variations caused by normal physiological fluctuations, which is expected to enhance the sensitivity of Yv to disease-related abnormalities. Second, we showed that the harmonized TRUST sequences provided consistent measurements of Yv across three major MR vendors. These findings together facilitate large-scale multi-site multi-vendor studies of Yv as a biomarker for brain diseases.Acknowledgements
No acknowledgement found.References
1. Lu H, Ge Y. Quantitative evaluation of oxygenation in venous vessels using T2‐relaxation‐under‐spin‐tagging MRI. Magnetic Resonance in Medicine: An Official Journal of the International Society for Magnetic Resonance in Medicine. 2008 Aug;60(2):357-63.
2. Xu F, Uh J, Liu P, Lu H. On improving the speed and reliability of T2‐relaxation‐under‐spin‐tagging (TRUST) MRI. Magnetic resonance in medicine. 2012 Jul;68(1):198-204.
3. Ge Y, Zhang Z, Lu H, Tang L, Jaggi H, Herbert J, Babb JS, Rusinek H, Grossman RI. Characterizing brain oxygen metabolism in patients with multiple sclerosis with T2-relaxation-under-spin-tagging MRI. Journal of Cerebral Blood Flow & Metabolism. 2012 Mar;32(3):403-12.
4. Thomas BP, Sheng M, Tseng BY, Tarumi T, Martin-Cook K, Womack KB, Cullum MC, Levine BD, Zhang R, Lu H. Reduced global brain metabolism but maintained vascular function in amnestic mild cognitive impairment. Journal of Cerebral Blood Flow & Metabolism. 2017 Apr;37(4):1508-16.
5. Jiang D, Lin Z, Liu P, Sur S, Xu C, Hazel K, Pottanat G, Darrow J, Pillai JJ, Yasar S, Rosenberg P. Brain oxygen extraction is differentially altered by Alzheimer's and vascular diseases. Journal of Magnetic Resonance Imaging. 2020 Dec;52(6):1829-37.
6. Xu F, Ge Y, Lu H. Noninvasive quantification of whole‐brain cerebral metabolic rate of oxygen (CMRO2) by MRI. Magnetic Resonance in Medicine: An Official Journal of the International Society for Magnetic Resonance in Medicine. 2009 Jul;62(1):141-8.
7. Xu F, Liu P, Pekar JJ, Lu H. Does acute caffeine ingestion alter brain metabolism in young adults?. Neuroimage. 2015 Apr 15;110:39-47.
8. Xu F, Liu P, Pascual JM, Xiao G, Huang H, Lu H. Acute effect of glucose on cerebral blood flow, blood oxygenation, and oxidative metabolism. Human brain mapping. 2015 Feb;36(2):707-16.
9. Zheng G, Wen J, Lu H, Lou Y, Pan Z, Liu W, Liu H, Li X, Zhang Z, Chen H, Kong X. Elevated global cerebral blood flow, oxygen extraction fraction and unchanged metabolic rate of oxygen in young adults with end-stage renal disease: an MRI study. European radiology. 2016 Jun 1;26(6):1732-41.
10. Liu P, Dimitrov I, Andrews T, Crane DE, Dariotis JK, Desmond J, Dumas J, Gilbert G, Kumar A, Maclntosh BJ, Tucholka A. Multisite evaluations of a T 2‐relaxation‐under‐spin‐tagging (TRUST) MRI technique to measure brain oxygenation. Magnetic resonance in medicine. 2016 Feb;75(2):680-7.
11. Jiang D, Liu P, Li Y, Mao D, Xu C, Lu H. Cross‐vendor harmonization of T2‐relaxation‐under‐spin‐tagging (TRUST) MRI for the assessment of cerebral venous oxygenation. Magnetic resonance in medicine. 2018 Sep;80(3):1125-31.
12. Xu F, Uh J, Brier MR, Hart Jr J, Yezhuvath US, Gu H, Yang Y, Lu H. The influence of carbon dioxide on brain activity and metabolism in conscious humans. Journal of Cerebral Blood Flow & Metabolism. 2011 Jan;31(1):58-67.
13. Jiang D, Lin Z, Liu P, Sur S, Xu C, Hazel K, Pottanat G, Yasar S, Rosenberg P, Albert M, Lu H. Normal variations in brain oxygen extraction fraction are partly attributed to differences in end-tidal CO2. Journal of Cerebral Blood Flow & Metabolism. 2020 Jul;40(7):1492-500.
14. Lu H, Xu F, Grgac K, Liu P, Qin Q, Van Zijl P. Calibration and validation of TRUST MRI for the estimation of cerebral blood oxygenation. Magnetic resonance in medicine. 2012 Jan;67(1):42-9.Figures