4091
Multivariate mapping of cortical myeloarchitecture in the macaque cortex
Erika P Raven1, Jeffrey Bennett2, Jelle Veraart1, Claude Lepage3, Joey Charbonneau2, Eliza Bliss-Moreau2, and Jiangyang Zhang1
1Radiology, NYU School of Medicine, New York, NY, United States, 2Psychology, UC Davis, Davis, CA, United States, 3Montreal Neurological Institute, McGill University, Montreal, QC, Canada
1Radiology, NYU School of Medicine, New York, NY, United States, 2Psychology, UC Davis, Davis, CA, United States, 3Montreal Neurological Institute, McGill University, Montreal, QC, Canada
Synopsis
Mapping cortical myelination has been a long-standing goal for accurate parcellation and classification of cytoarchitectonic boundaries. We investigated a multivariate myelin mapping approach for the accurate parcellation of small cortical subregions of the insula by exploiting the co-localization of iron with dense bands of myelin in cortical gray matter. We assessed the performance of multivariate myelin mapping in the rhesus macaque, both in vivo and ex vivo, and compared its performance with T1w/T2w ratio imaging. We demonstrated that multivariate myelin mapping is a translatable myelin sensitive technique for the differentiation of insula subregions.
Introduction
Mapping cortical myelination has been a long-standing goal for accurate parcellation and classification of cytoarchitectonic boundaries1. Various techniques have been used, including T1w/T2w ratio, T1/T2* mapping, magnetization transfer (MT) imaging, and more recently, the multivariate combinations of quantitative MRI contrasts2.Iron and myelin contribute independently to T1 and T2* contrasts3. In cortical gray matter, iron tends to co-localize with dense bands of myelin, amplifying architectonic boundaries, especially at high field strengths4. Multivariate analysis exploits this co-localization to produce more robust identification of the boundaries. Here, we investigate a multivariate myelin mapping approach for 1) accurate parcellation of small cortical subregions, focusing on the insula, while 2) attempting to infer greater sensitivity to myeloarchitecture as it relates to known histology, and 3) demonstrating the feasibility of an in vivo workflow.
The insula is a current target of increasing study in both humans and nonhuman animals because of its broad implications in psychological functions and neuropsychiatric diseases. It is composed of three major subdivisions that are defined based on the presence of granular cells (i.e., agranular, dysgranular, and granular). These subregions can be further subdivided using cyto-and myelo-architectural features5. While determination of major subregions is, to date, only possible via histological analyses, understanding them on an individual-by-individual basis is extremely important. Each region appears not only to have different cellular and connectivity profiles, but also to carry out different functions - making the ability to accurately parcellate these subregions in alive subjects of utmost importance for discovery.
Methods
All experiments have been approved by local IACUC. Two female rhesus macaques (Subject 1=1yr, Subject 2=10yr) were scanned. In vivo MRI data were acquired with a 3T Siemens Skyra scanner and 8-channel monkey coil at UC Davis. Animals were sedated by ketamine (5 mg/kg) and sedation was maintained with 1.0-1.5% isoflurane. The animals were positioned in a stereotaxic frame in the sphinx position. The scan included T1w, T2w, and a Multi-Parameter Mapping (MPM) protocol for myelin-sensitive quantitative imaging (MT-sat, R1, R2*)6. Calibration data was used to correct MPM maps for spatial variation using B1+, B1-, and B0 maps (Table 1).One week after in vivo scanning, subjects were humanely euthanized and brain specimens were extracted and submerged in 4% paraformaldehyde for approximately 12 weeks. Prior to ex vivo scanning, specimens were transferred to phosphate buffered saline for one week, then immersed in Fomblin in MRI compatible tubes to reduce susceptibility artifacts. Using a 7T Bruker with a 72 mm volume coil, a similar MPM protocol was reacquired with minor modifications.
Processing: In vivo T1w/T2w ratio images were computed using FSL7 and used as the established reference for cortical parcellation8. Quantitative maps, including MT-sat, R1, and R2*, were processed using the hMRI toolbox9 and QUIT10. Ex vivo data were nonlinearly aligned to in vivo contrasts using ANTS tools to account for deformations and shrinkage due to fixation11. The registered, ex vivo MT-sat image was aligned to the NIMH Macaque Template (NMTv1.2)12 and cortical surfaces were extracted using CIVET-macaque13. From the 246 cortical regions14, we identified three insula subregions: agranular, dysgranular, and granular. To mitigate partial volumes at the boundary of the pial surface, surfaces were resampled to remove the outer 30% of the cortical ribbon. Parametric maps were then projected onto cortical surfaces using Connectome Workbench15.
Data Analysis: Principal component analysis (PCA) with oblique matrix rotation was performed on the quantitative imaging metrics (MT-sat, R1, R2*) for in vivo and ex vivo scans. Sampling adequacy was assessed using the Kaiser-Meyer-Olkin (Subj1=0.6, Subj2=0.66) and Bartlett's test of sphericity (p<0.05). Parallel analysis determined one component was sufficient to represent the data. PCA loadings were used to compute a composite score, i.e. the myelin estimation, that was then projected onto the cortical surfaces. Unpaired t-tests were used to compare differences between subregions.
Results
Although in vivo T1w/T2w ratio reflects different whole brain profiles when compared to the PCA-defined myelin estimates (Figure 2), they shared several spatial patterns. Both suggested more myelin in the occipital lobes and the older subject (#2) had higher myelin content in the sensory cortex than the younger subject (#1). Despite differences in contrast related to resolution and fixation, in vivo and ex vivo PCA-myelin estimates shared similar profiles, promoting the use of this technique for in vivo pipelines.Both T1w/T2w ratio and PCA-defined myelin estimates were sensitive to atlas-defined subregions of the insula (Figure 3). Ex vivo myelin estimation benefited from high resolution and SNR, showing remarkable contrast in anterior temporal regions which are typically difficult to image in vivo due to susceptibility artifacts. When comparing ex vivo myelin estimates with cortical thickness, we observed unique signatures across all three regions, in addition to subregions in the agranular cortex, as observed in histology.
Discussion
While all contrasts were sensitive to differentiating insula subregions, multivariate myelin estimation demonstrated promise as a translatable myelin sensitive technique for both in vivo and ex vivo scanning. T1w/T2w imaging in vivo is favorable due to higher achievable resolution in shorter scan times, but uncorrected bias fields on this metric might pose practical limitations16. Future directions will confirm both myelin estimations and T1w/T2w ratio with histological markers of myelin in the macaque cortex.Acknowledgements
ER is supported by a NIH fellowship (NICHD / 1F32HD103313-01). The research was partially performed at the Center of Advanced Imaging Innovation and Research (CAI2R, www.cai2r.net), a Biomedical Technology Resource Center supported by NIBIB with the award P41 EB017183.References
- Glasser, M. F. et al. A multi-modal parcellation of human cerebral cortex. Nature 1–11 (2016).
- Mangeat, G., Govindarajan, S. T., Mainero, C. & Cohen-Adad, J. Multivariate combination of magnetization transfer, T2* and B0 orientation to study the myelo-architecture of the in vivo human cortex. Neuroimage (2015).
- Stüber, C. et al. Myelin and iron concentration in the human brain: a quantitative study of MRI contrast. Neuroimage 93, 95–106 (2014).
- Fukunaga, M. et al. Layer-specific variation of iron content in cerebral cortex as a source of MRI contrast. Proc. Natl. Acad. Sci. 107, 3834–3839 (2010).
- Evrard, H. C. The organization of the primate insular cortex. Front. Neuroanat. 13, 1–21 (2019).6. Callaghan, M. F. et al. Example dataset for the hMRI toolbox. Data Br. 25, (2019).
- Jenkinson, M., Beckmann, C. F., Behrens, T. E. J., Woolrich, M. W. & Smith, S. M. FSL. Neuroimage 62, 782–790 (2012).
- Glasser, M. F. & Van Essen, D. C. Mapping human cortical areas in vivo based on myelin content as revealed by T1- and T2-weighted MRI. J. Neurosci. 31, 11597–616 (2011).
- Tabelow, K. et al. hMRI – A toolbox for quantitative MRI in neuroscience and clinical research. Neuroimage 194, 191–210 (2019).
- Wood, T. C. QUIT: QUantitative Imaging Tools. J. Open Source Softw. 3, 656 (2018).
- Avants, B. B. et al. A reproducible evaluation of ANTs similarity metric performance in brain image registration. Neuroimage 54, 2033–2044 (2011).
- Seidlitz, J. et al. A population MRI brain template and analysis tools for the macaque. Neuroimage 170, 121–131 (2018).
- Lepage, C. et al. CIVET-Macaque: an automated pipeline for MRI-based cortical surface generation and cortical thickness in macaques. bioRxiv (2020).
- Jung, B. et al. A comprehensive macaque fMRI pipeline and hierarchical atlas. bioRxiv (2020).
- Marcus, D. S. et al. Informatics and data mining tools and strategies for the Human Connectome Project. Front. Neuroinform. 5, 1–12 (2011).
- Glasser, M. F. et al. Transmit field bias correction of T1w/T2w myelin maps. bioRxiv 2021.08.08.455570 (2021).
Figures
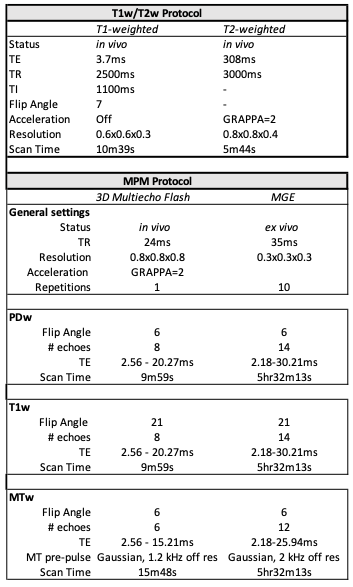
Table 1: In vivo and ex vivo acquisition parameters. In vivo scanning included T1w/T2w ratio imaging and the MPM protocol as described in 6. The ex vivo MPM protocol was slightly modified to account for differences in relaxation at high field strengths.
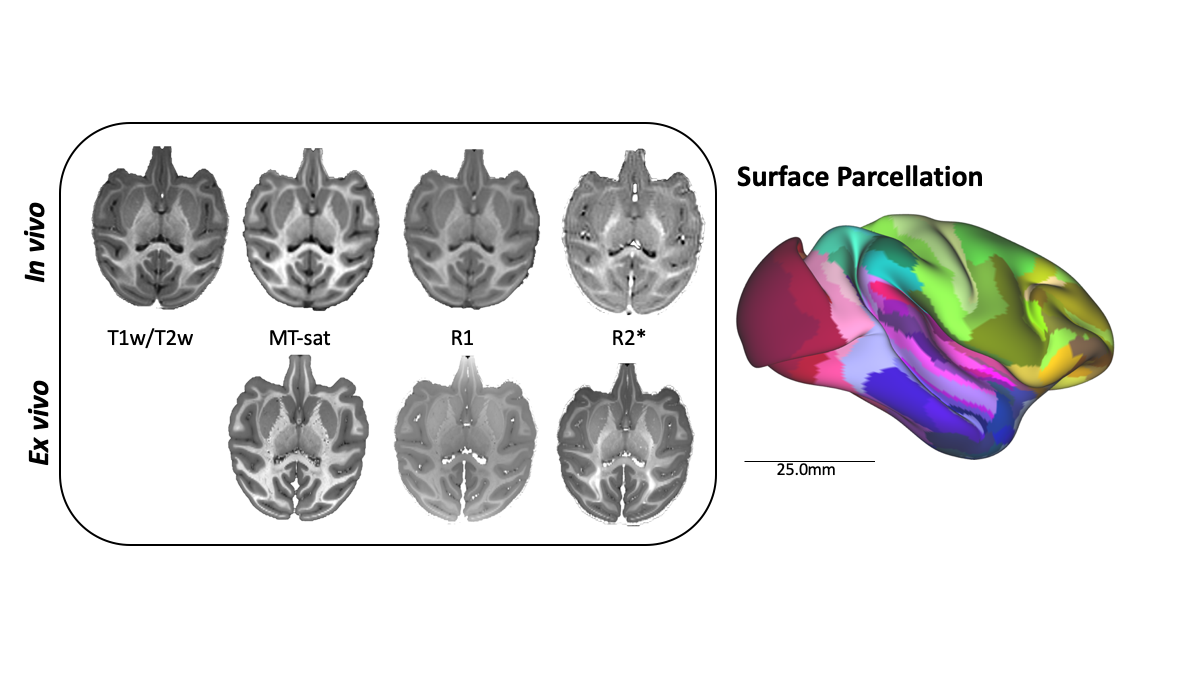
Figure 1: Processing pipeline of multimodal imaging data. Parametric maps are shown from a single subject for both in vivo and ex vivo modalities. The ex vivo data was registered to in vivo data to account for deformation and shrinkage due to fixation. The registered ex vivo MT-sat image was most similar to T1w contrast and used for surface extraction. The atlas parcellation for this subject is shown on a semi-inflated surface (scale bar 25mm).
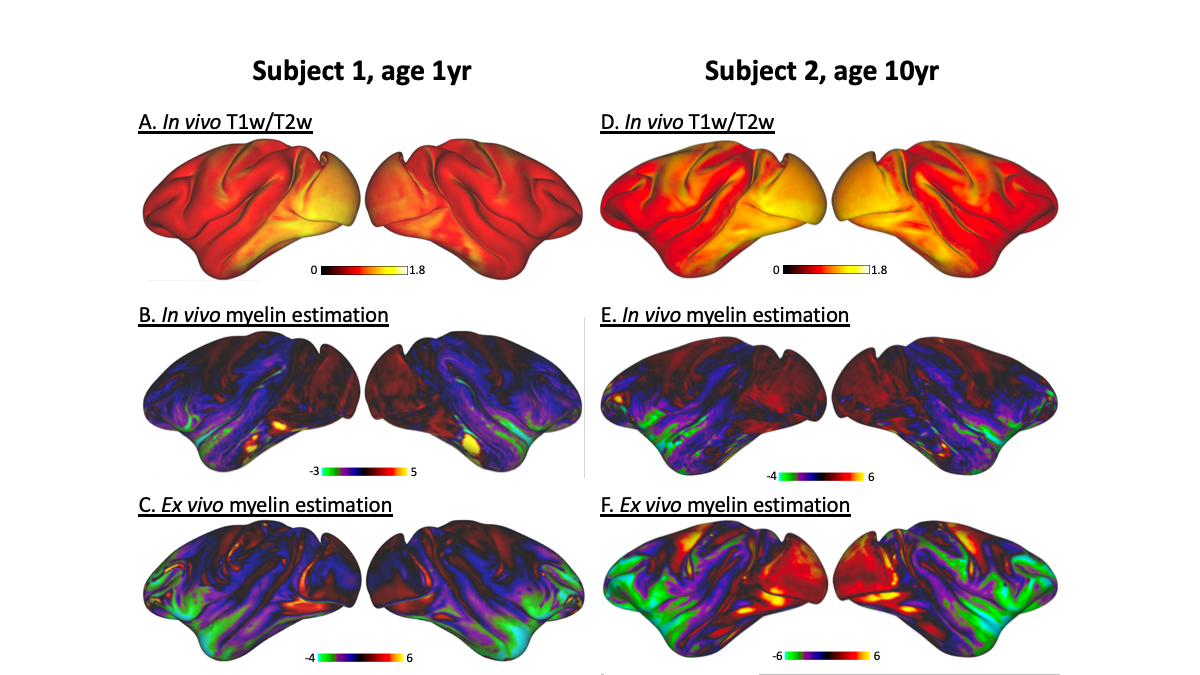
Figure 2: Whole brain comparison of myelin sensitive contrasts. T1w/T2w and PCA-based myelin estimation is shown for each hemisphere of each subject. Ex vivo myelin estimation (C, F) shows the greatest sensitivity in temporal and insular regions.
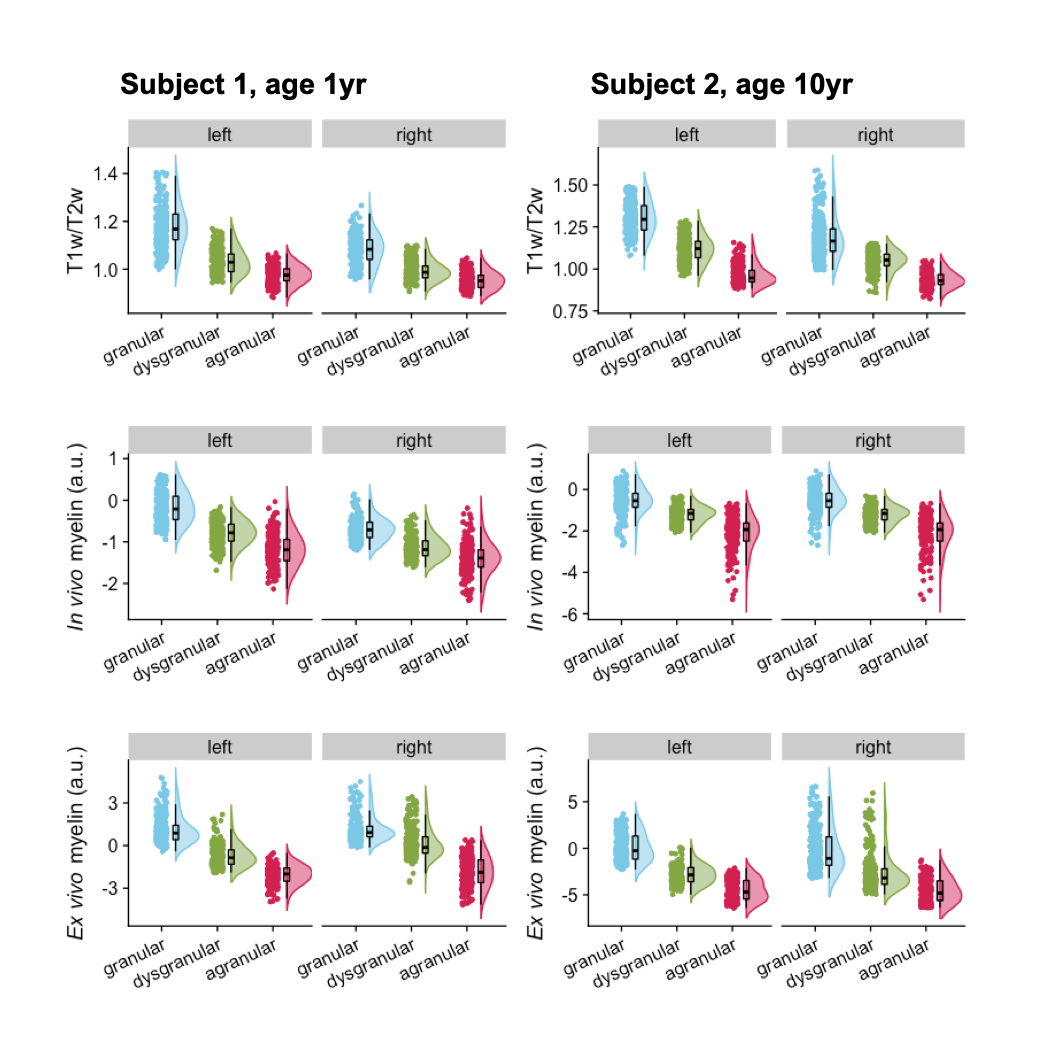
Figure 3: Subregions of the insula. Subregions are presented from posterior to anterior, going from granular (blue), dysgranular (green), and agranular (red). T1w/T2w and PCA-based myelin estimation are shown for each hemisphere of each subject. All comparisons between each subregion of each hemisphere were p ≤ 0.0001, therefore significance markers were left out.
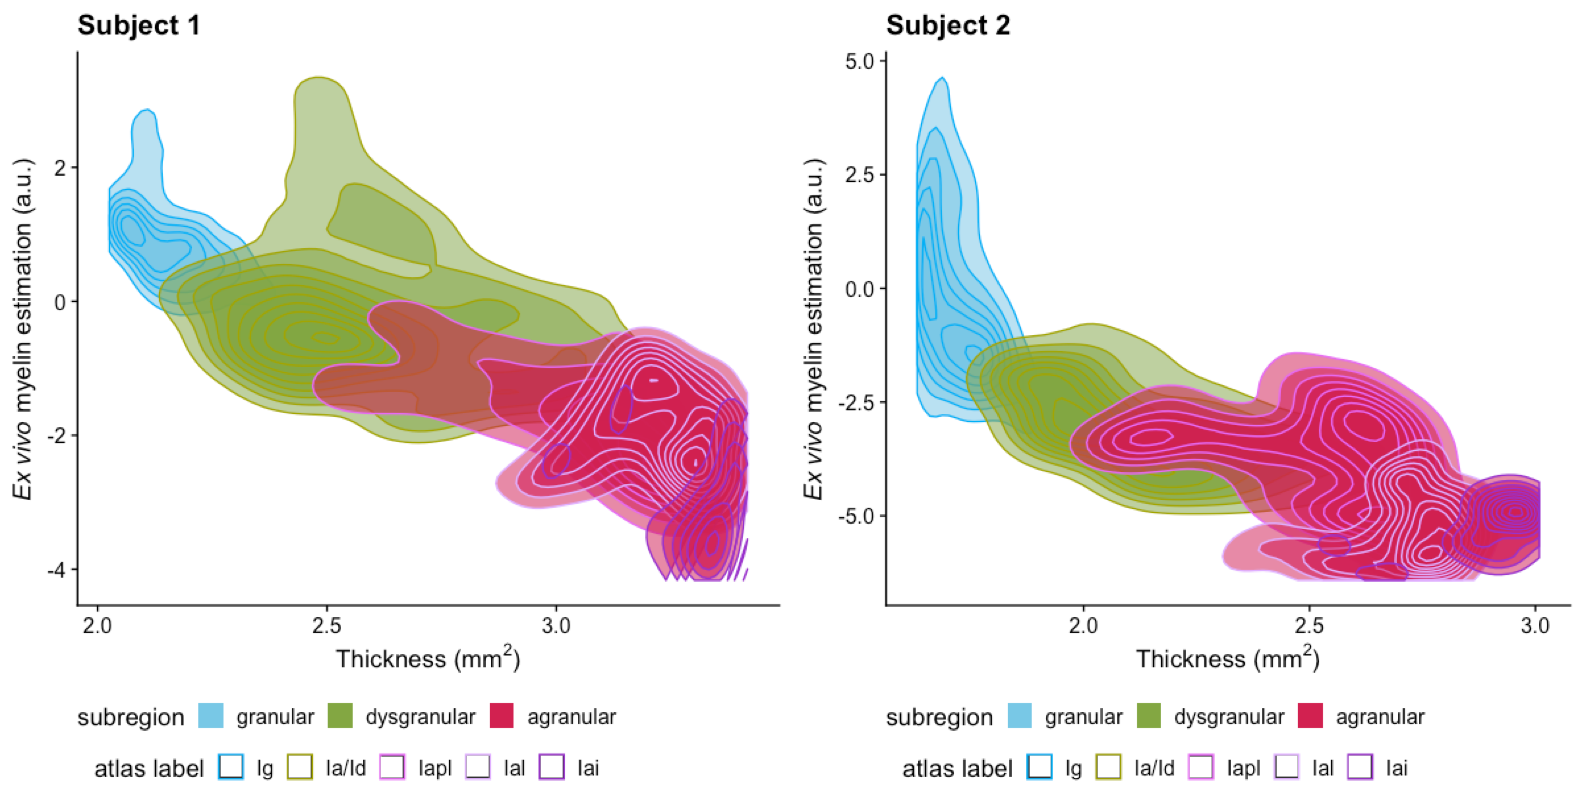
Figure 4: Myelin estimation versus cortical thickness. Density plots show correspondence of ex vivo myelin estimates and cortical thickness as defined by subregions. Contour lines are overlaid for regions as defined by CHARM Level 6 parcellation of the NMT Atlas. The first two correspond to granular (Ig), and dysgranular (Ia/Id) cortex, while agranular cortex is additionally defined as posterior lateral agranular (Iapl), lateral agranular (la), and intermediate agranular (Iai).
DOI: https://doi.org/10.58530/2022/4091