4089
In vivo pH Measurement by T2ex Relaxometry of Iodinated Contrast Agent and Comparison with CEST pH Imaging1Cancer Physiology, Moffitt Cancer Center, Tampa, FL, United States, 2Small Animal Imaging Laboratory, Moffitt Cancer Center, Tampa, FL, United States
Synopsis
This work is based on a well-known MRI property, the transverse relaxation changes of bulk water due to the presence of a solute with water-exchangeable protons. Many molecules can exhibit this ability to change water T2, such as glucose, urea, ammonium chloride, metals and paramagnetic complexes. Here we used the FDA-approved iodinated agent iopamidol (Isovue), widely used for CEST applications, as a T2ex agent to quantify pH in vitro and in vivo, since its –NH groups exhibit pH-dependent exchange rates with water protons. Computed tomography provided iopamidol concentrations to complement the MR relaxometry measurements, allowing determination of pH in vivo.
Introduction
Chemical exchange saturation transfer (CEST) is an established technique for measuring pH in vivo [1]. For contrast agents with –NH groups, the proton exchange rate with water is pH-dependent and can contribute to T2 relaxation. This exchange component of T2 relaxation, T2ex, has been characterized previously for glucose [2], glutamine [3], and FDA-approved iodinated agent iopamidol (Isovue, Bracco) [4]. However, it is necessary to know both the T2ex and in vivo concentration of the contrast agent to determine pH. As a dual-modality contrast agent [5], in vivo iopamidol concentration can be measured by X-ray computed tomography (CT). In this proof-of-concept study, we explored the feasibility of in vivo pH measurement using iopamidol T2ex relaxometry and compared its performance to conventional CEST in a mouse bladder model.Methods
MRI was performed using a Varian 7T horizontal-bore scanner with Bruker console. Calibration phantoms were prepared by diluting Isovue-370 (972 mM iopamidol) in 1X phosphate buffered saline to 0-500 mM and titrating to pH 6.0-7.4 with HCl and NaOH. T2 was measured at 37±2°C by fitting the signal intensity of centric-encoded fast spin echo images (TE 5-400 ms, TR 10 s, RARE 8) to a mono-exponential function. CT was performed with a Siemens Inveon PET/SPECT/CT (300 projections, 80 kVp, 500 mA) to obtain CT numbers (Hounsfield units) corresponding to each concentration. A standard water phantom was used for 0 HU reference.For in vivo experiments, two healthy C57BL/6 mice received via tail vein catheter a 200 μL bolus of Isovue-370 followed by continuous infusion at 400 μL/hr. Pre-contrast T2 measurements were performed using multi-slice spin echo MRI (10 coronal slices, 0.55 × 0.55 × 1 mm3 resolution, TE 10-150 ms, TR 10 s, RARE 8). CT of the bladder was performed pre-contrast and every 5 min post-contrast for 15 min. The animal was then transferred to the MRI for T2 measurements. As a proof-of-concept demonstration of pH change, a second set of T2 measurements were performed following intravenous administration of a 200 μL bolus of 400 mM sodium bicarbonate. CEST measurements were also performed immediately before and after bicarbonate injection. At the end of MRI, post-contrast CT was conducted to obtain the final iopamidol concentration. An anterior coronal slice of the bladder was quantified for T2 measurements. CEST pH imaging of the bladder was performed with a single-slice single-shot gradient echo readout preceded by 3 μT continuous wave saturation for 5 s at 46 frequency offsets ±10 ppm from the water resonance as previously described [6].
Results
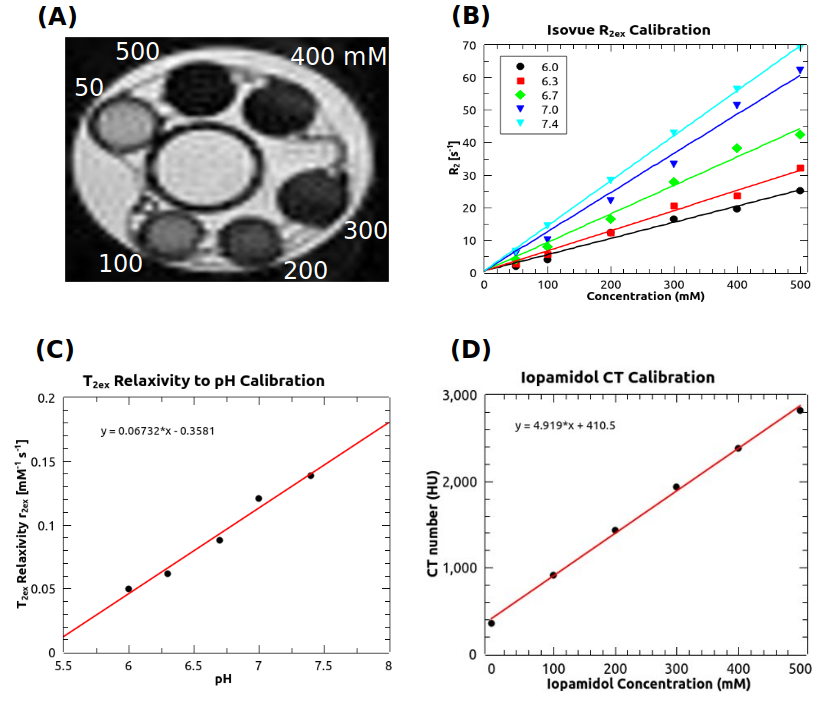
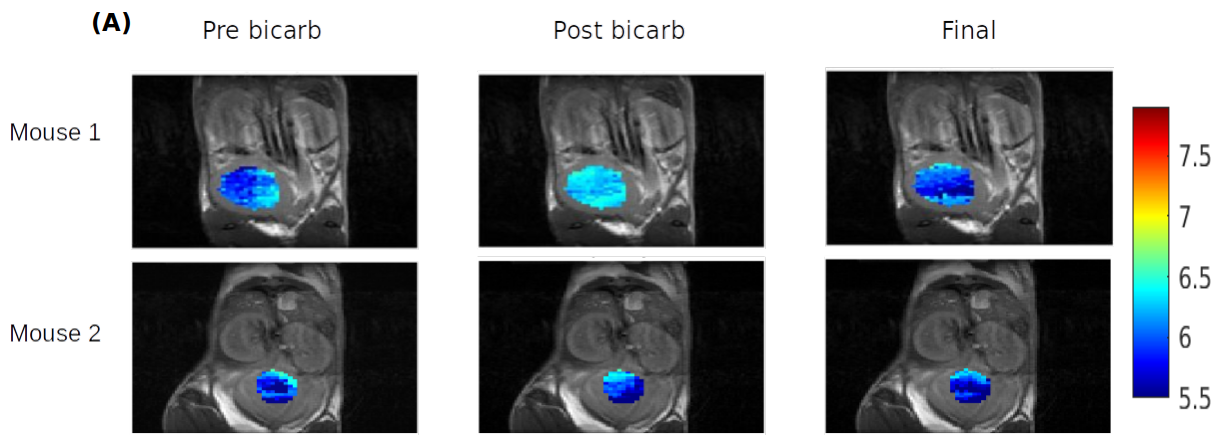
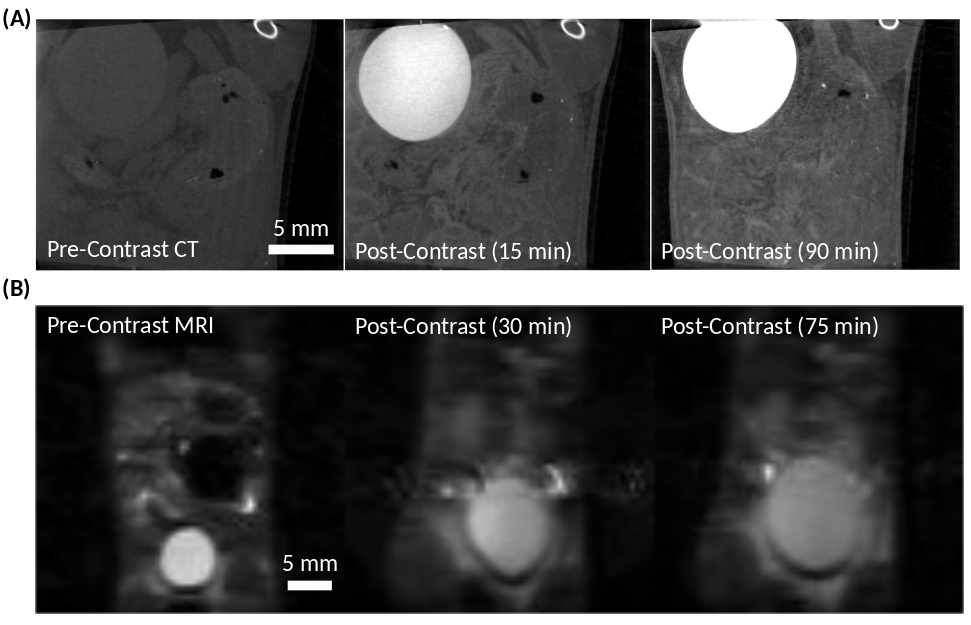
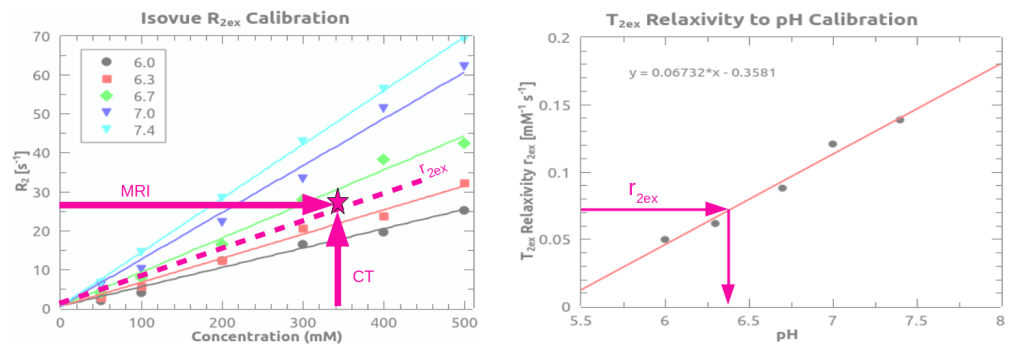
At the same pH, there was a visually discernible decrease in signal on T2-weighted images as iopamidol concentration increased, Figure 1A. The T2 relaxation rates, R2, varied linearly with iopamidol concentrations in the 0-500 mM range for pH 6.0-7.4, Figure 1B. The slope increased with pH, demonstrating the pH-dependent T2ex relaxivity (r2ex) of iopamidol. At 0 mM iopamidol, the T2 was identical to water across all pH values, approximately 2 s. T2ex relaxivity (r2ex) was found to vary linearly with pH in the 6.0-7.4 range, Figure 1C. CT calibration data to convert CT numbers (HU) to iopamidol concentration are shown in Figure 1D.CEST pH maps of the bladder are shown in Figure 2 with whole-bladder average pH values summarized in Table 1. Representative CT and spin-echo images (TE 40 ms) are shown in Figure 3.
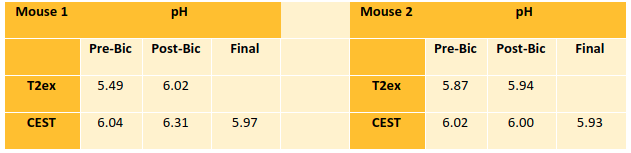
To determine in vivo pH, the pre-contrast R2 was subtracted from the post-contrast R2 to isolate the exchange component of the T2 relaxation rate, R2ex. The pre-contrast CT number was subtracted from the post-contrast CT number to determine the iopamidol concentration from the CT calibration curve (Figure 1D). The ratio of R2ex to iopamidol concentration, as determined from CT, represents the T2ex relaxivity (r2ex), the slope of the dotted line in Figure 4A. The pH was then found from the measured T2ex relaxivity (r2ex), Figure 4B, and reported in Table 1.
Discussion
There was generally good agreement between the whole-bladder pH obtained from CEST and T2ex relaxometry. Both techniques showed a pH increase following bicarbonate injection in mouse 1. There was no change in pH detected for mouse 2, suggesting failure of the intravenous catheter during bicarbonate administration. As T2ex relaxivity increases with iopamidol concentration, the sensitivity is limited by the steady-state iopamidol concentration in tissue. T2ex relaxometry would be most appropriate for applications where iopamidol concentrations above 100 mM can be achieved, such as bladder imaging. Because it is impractical to acquire the MR and CT simultaneously, there may be some uncertainty in the iopamidol concentration. Further work is underway to validate pH measurements from T2ex relaxometry and to generate spatially-localized pH maps by multi-modality co-registration of in vivo R2ex maps and iopamidol concentration maps as determined from CT.Conclusion
In this work, the feasibility of estimating in vivo pH by identifying the T2ex relaxivity associated with the pH-dependent exchange T2 relaxation mechanism, measured using MRI, and the iopamidol concentration, measured using CT, was demonstrated in the mouse bladder. Good pH agreement was found between CEST and T2ex relaxometry.Acknowledgements
This work has been supported by the SAIL Core Facility at the H. Lee Moffitt Cancer Center & Research Institute and NCI designated Comprehensive Cancer Center (P30-CA076292).References
[1] Ward KM, Balaban RS. Determination of pH using water protons and chemical exchange dependent saturation transfer (CEST). Magnetic Resonance in Medicine. 2000 Nov;44(5):799-802.
[2] Yadav NN, Xu J, Bar‐Shir A, Qin Q, Chan KW, Grgac K, Li W, McMahon MT, Van Zijl PC. Natural D‐glucose as a biodegradable MRI relaxation agent. Magnetic Resonance in Medicine. 2014 Sep;72(3):823-8.
[3] Joo CG, Yang SH, Choi Y, Son HY, Kim DH, Huh YM. L‐glutamine as a T2 exchange contrast agent. Magnetic Resonance in Medicine. 2020 Oct;84(4):2055-62.
[4] Aime S, Nano R, Grandi M. A new class of contrast agents for magnetic resonance imaging based on selective reduction of water-T2 by chemical exchange. Investigative Radiology. 1988 Sep;23 Suppl 1:S267-70.
[5] Aime S, Calabi L, Biondi L, De Miranda M, Ghelli S, Paleari L, Rebaudengo C, Terreno E. Iopamidol: Exploring the potential use of a well‐established x‐ray contrast agent for MRI. Magnetic Resonance in Medicine. 2005 Apr;53(4):830-4.
[6] Longo DL, Dastru W, Digilio G, Keupp J, Langereis S, Lanzardo S, Prestigio S, Steinbach O, Terreno E, Uggeri F, Aime S. Iopamidol as a responsive MRI‐chemical exchange saturation transfer contrast agent for pH mapping of kidneys: in vivo studies in mice at 7 T. Magnetic Resonance in Medicine. 2011 Jan;65(1):202-11.
Figures