4082
Importance of linear-combination modeling for quantification of GABA and glutathione levels using Hadamard-edited MRS1Russell H Morgan Department of Radiology and Radiological Science, The Johns Hopkins University School of Medicine, Baltimore, MD, United States, 2F.M. Kirby Center for Functional Brain Imaging, Kennedy Krieger Institute, Baltimore, MD, United States, 3Department of Psychiatry and Behavioral Sciences, Addiction Sciences Division, Center for Biomedical Imaging, Medical University of SC, Charleston, SC, United States
Synopsis
There are two main approaches for modeling edited spectra: simple Gaussian modeling, and linear-combination modeling based on simulated metabolite basis functions. The simple Gaussian modeling of GSH in Gannet was reported to be less reproducible for HERMES than for MEGA-PRESS. Recent consensus recommended linear-combination modeling for quantification of edited MRS. Here we compared the performance of simple Gaussian and linear-combination modeling on a test-retest dataset to display the improvement of the reproducibility of metabolite quantification with HERMES.
Introduction
J-difference-edited spectroscopy is a commonly used approach for quantification of low-concentration of metabolites in the human brain. Two main approaches are used for modeling edited spectra: simple Gaussian modeling to extract peak areas, and linear-combination modeling based on simulated metabolite basis functions. Recent consensus1 recommended linear-combination modeling for quantification of edited MRS.GABA and glutathione (GSH) can either be edited separately with Mescher-Garwood point-resolved spectroscopy (MEGA-PRESS), or in a combined Hadamard-edited (HERMES) acquisition. It was previously reported2 that simple Gaussian modeling of GSH in Gannet3 was less reproducible for HERMES than for MEGA-PRESS. The aim of this study is to compare the performance of simple Gaussian and linear-combination modeling on a test-retest dataset.
Methods
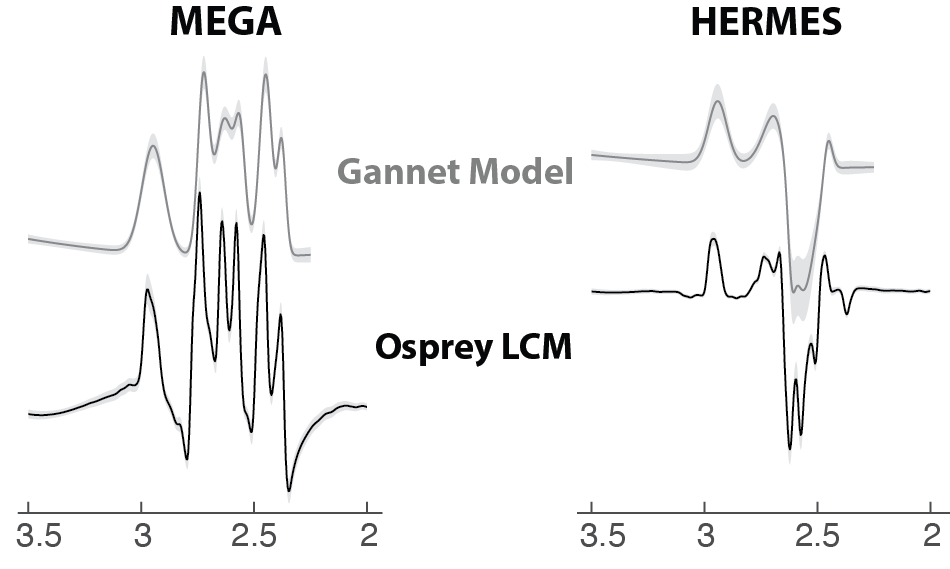
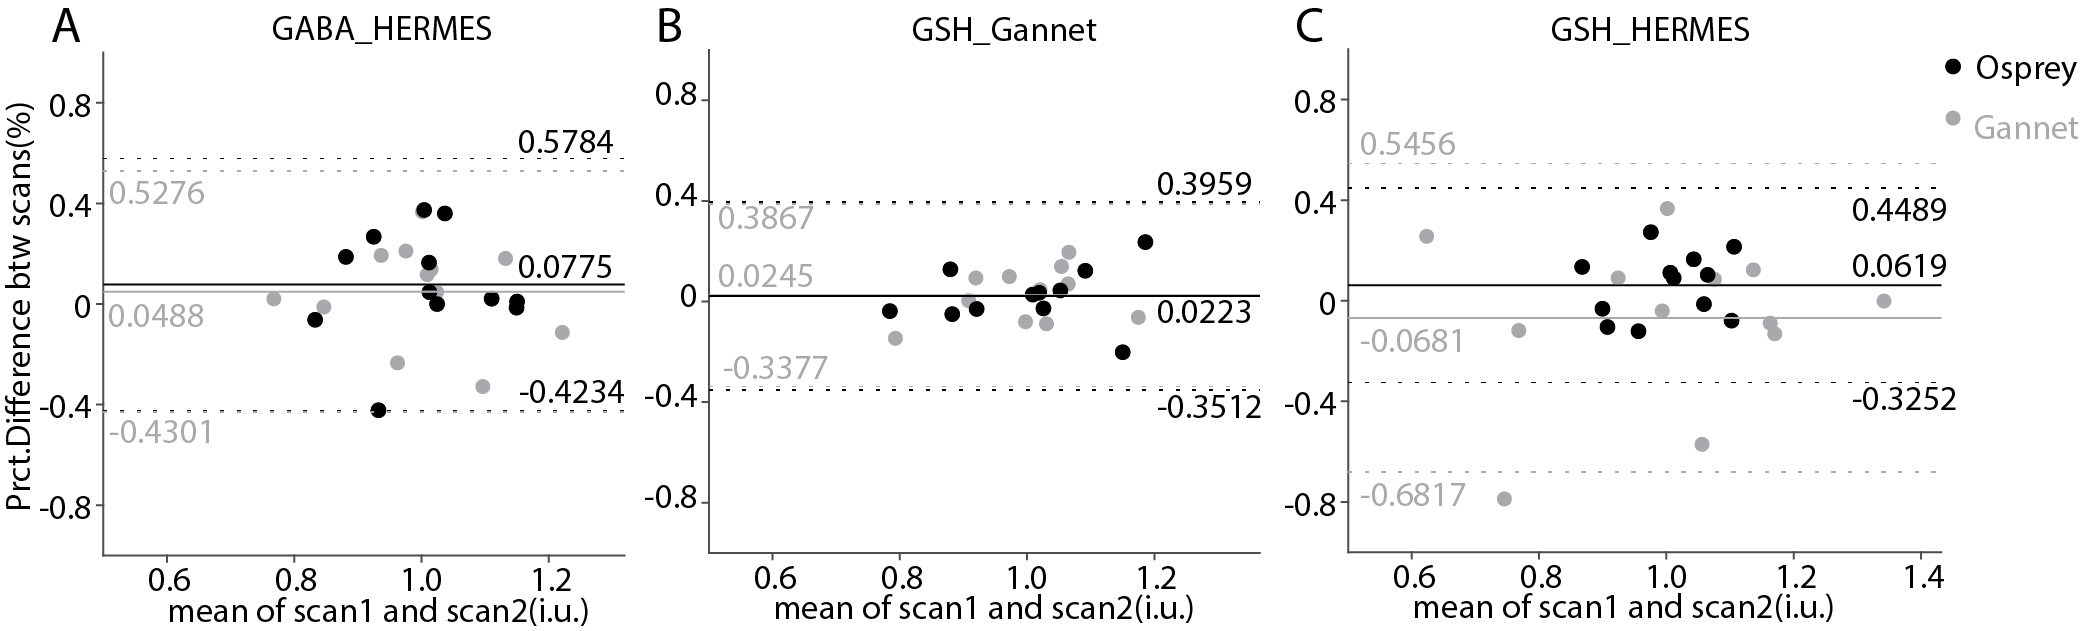
Test-retest HERMES and MEGA-PRESS data from the previous study2 were re-analyzed using Gannet (simple Gaussian model) and Osprey4 (linear-combination modeling with a simulated basis set). These data from twelve healthy volunteers measured in the dorsal anterior cingulate as shown in Figure 1 were acquired with TE = 80 ms for HERMES and TE = 120 ms for MEGA-PRESS of GSH. Within-subject coefficients of variation (CVs) were calculated to quantify between-scan reliability of each metabolite5. Bland-Altman plots6 were created to evaluate the agreement between metabolites levels from two consecutive scans.Results
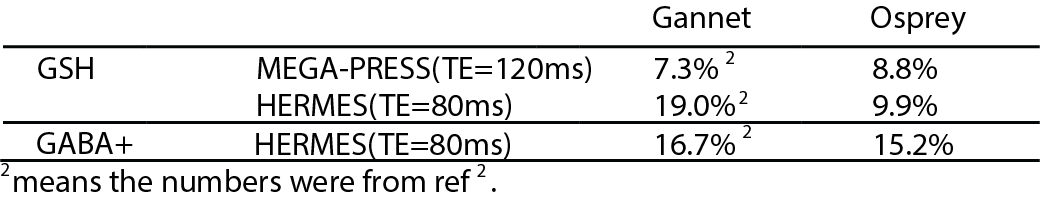
Gannet and Osprey models are shown in Figure 2 (mean ± standard deviation). Within-subject CVs are shown in Table 1; Osprey modeling of GSH data showed similar levels of reproducibility for MEGA-PRESS and HERMES data, with CVs of 8.8% and 9.9% respectively. Modeling of HERMES GSH spectra was much more reproducible using Osprey than with the simple Gaussian models of Gannet (CVs 9.9% and 19.0% respectively). Bland-Altman plots of these data are shown in Figure 3.Discussion
Linear-combination modeling with simulated basis functions substantially improves the reproducibility of GSH quantification with HERMES, compared to simpler Gaussian modeling. With this improved modeling, the reproducibility of HERMES and MEGA-PRESS become similar, suggesting that HERMES is an appropriate choice for GSH quantification with the added benefit of performing GABA editing within the same experiment.These findings suggest that Gannet’s simple modeling is only appropriate for well-resolved edited signals without adjacent mixed-phase signals, which is typically the case for GABA editing and GSH editing at TE = 120 ms. At TE = 80 ms, the GSH-adjacent aspartyl signals have a complex mixed-phase lineshape that makes reliable baseline modeling more challenging.Conclusion
Both GABA and GSH results showed the good reproducibility between HERMES (TE=80ms) and MEGA-PRESS (TE=120ms) data using linear combination modeling. In other words, Osprey showed a significant advantage (stability) in measuring the level of GABA and GSH in varied TE values. It is anticipated that HERMES is applicable to simultaneously measure in vivo levels of two metabolites for which edited detection is required. The advantage of linear combination modeling in Osprey is more applicable to the reliable quantification of multiple metabolites at the same time.Acknowledgements
This work has been supported by NIH grants P41EB015909, R01EB016089, R01EB023963, R21AG060245, and R00AG062230.References
1. Choi IY, Andronesi OC, Barker P, et al. Spectral editing in (1) H magnetic resonance spectroscopy: Experts’ consensus recommendations. NMR Biomed. 2021;34(5):e4411. doi:10.1002/nbm.4411
2. Prisciandaro JJ, Mikkelsen M, Saleh MG, Edden RAE. An evaluation of the reproducibility of 1H-MRS GABA and GSH levels acquired in healthy volunteers with J-difference editing sequences at varying echo times. Magn Reson Imaging. 2020;65:109-113. doi:10.1016/j.mri.2019.10.004
3. Edden RA, Puts NA, Harris AD, Barker PB, Evans CJ. Gannet: A batch-processing tool for the quantitative analysis of gamma-aminobutyric acid-edited MR spectroscopy spectra. J Magn Reson Imaging. 2014;40(6):1445-1452. doi:10.1002/jmri.24478
4.Oeltzschner G, Zöllner HJ, Hui SCN, et al. Osprey: Open-source processing, reconstruction & estimation of magnetic resonance spectroscopy data. J Neurosci Methods. 2020;343:108827. doi:10.1016/j.jneumeth.2020.108827
5.Synek V. Evaluation of the standard deviation from duplicate results. Accreditation Qual Assur. 2008;13:335-337. doi:10.1007/s00769-008-0390-x
6.Bland JM, Altman DG. Statistical methods for assessing agreement between two methods of clinical measurement. Lancet Lond Engl. 1986;1(8476):307-310.
Figures