4080
Group-level adaptive-analysis of task fMRI data1Lou Ruvo Center for Brain Health, Cleveland Clinic, Las Vegas, NV, United States, 2Interdisciplinary neuroscience PhD program, University of Nevada, Las Vegas, Las Vegas, NV, United States, 3University of Colorado Boulder, Boulder, CO, United States, 4University of North Texas Health Science Center at Fort Worth, Fort Worth, TX, United States, 5Cleveland Clinic, Cleveland, OH, United States
Synopsis
A task-fMRI group-level analysis method is proposed to incorporate spatial covariance structures in fMRI data using the subject-level steerable filter smoothing with various full-wide-half-maximums followed by a group-level one-step optimization. Subject-level smoothed time series are further orthogonalized to guarantee non-overlapped contributions to group-level activations. Using the proposed method, we are able to detect more accurate activations in both simulated data and during a real-fMRI episodic memory task.
Introduction
Popular task-fMRI group-level analysis method is based on the multi-level univariate general linear models (GLM), which is known to suffer from the low sensitivity for a given specificity since the spatial covariance structure at each voxel is not taken into account entirely1,2. To adaptively model shapes of activation patterns, local canonical correlation analysis (CCA) has been proposed by incorporating neighboring voxels with optimum weights3,4. However, in local CCA, a fixed neighborhood size is pre-selected and proper constraints on the weights of neighboring voxels are required to limit false positives, which are difficult to determine for group-level analysis. In this study, we introduce a new method that utilizes subject-level adaptive steerable filter smoothing with multiple full-width-half-maximums (FWHM) to comprehensively model the spatial covariance, followed by a one-step group-level optimization that determines the contribution of each basis function. Therefore, the shape of group-level activation pattern is automatically adapted, and the sensitivity of activation detection is boosted.Methods
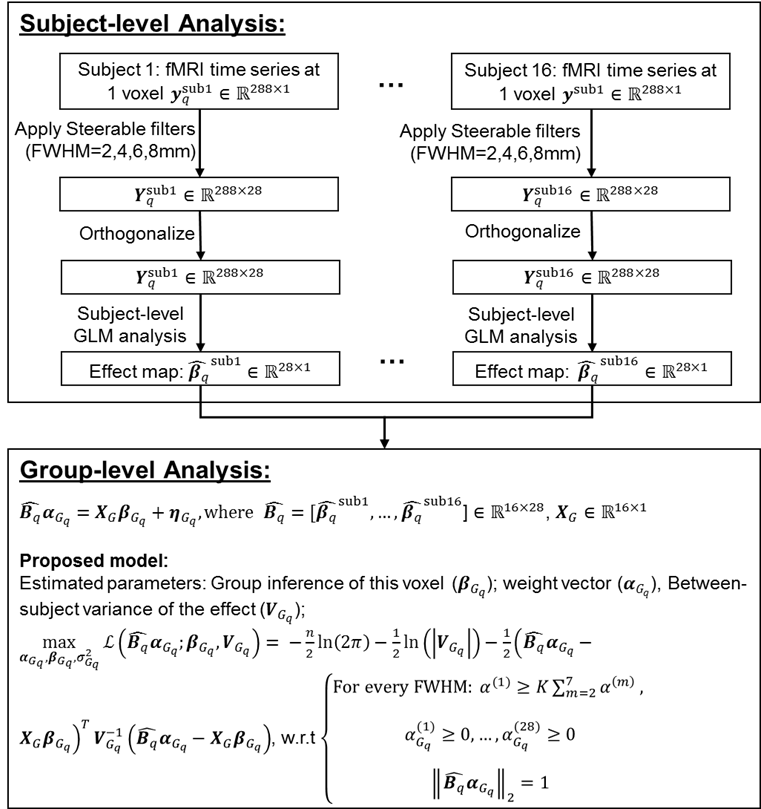
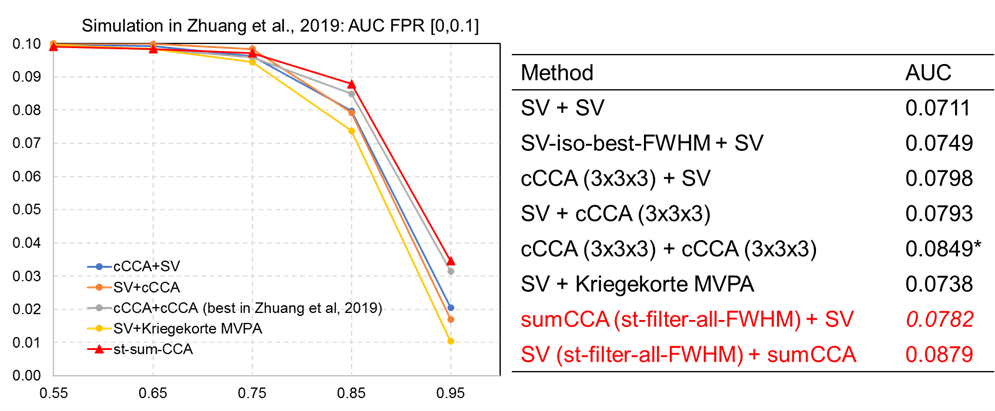
Imaging. fMRI data of an episodic memory task from 16 subjects were acquired on a 3T GE scanner (TR/TE/resolution=2s/30ms/1.7x1.7x5mm3, 25 slices, 288 time frames). The memory task involved viewing faces paired with occupations and contained instruction, encoding, recognition and control periods. Subject-level analysis. For each subject, fMRI data were slice-timing corrected, realigned, registered to the subject’s anatomical space, and normalized to the MNI152-2mm template. Instead of a standard 3D Gaussian filter, 4 sets of 3D steerable filters with FWHM=2mm,4mm,6mm and 8mm were used to smooth the time-series of every subject, with each FWHM steerable filters consisting of 7 directional basis functions (Fig. 1). After this smoothing step, for a given voxel q, 28 time series (Ysub-q: dimension [288,28]) representing 4 different FWHM levels each with 7 different smoothing directions were obtained and further orthogonalized to represent non-overlapped contributions of different smoothness along different directions. For simplicity, let X (dimension: [288,1]) represent a function used to model the BOLD response for contrast encoding v/s control in this case. A voxel-wise effect map (βisub-wholebrain, dimension [#voxel,1]), for this contrast was then computed from a GLM model for each of the 28 time series (Yisub-wholebrain=Xβisub-wholebrain + εisubwholebrain, i=1,2,...,28), resulting in 28 effect maps for every subject that would input to the group-level analysis. Group-level analysis. For each voxel q, the group-level analysis was modeled as: BqαGq = XGβGq + ηGq, where XG (dimension: [Nsub,1]) was the group-level design matrix, Bq (dimension: [Nsub, 28] were the effect maps of 28 basis functions for this voxel from all subjects, and αGq (dimension: [28,1]) was the to-be-estimated weight vector of each filter. BqαGq then followed a multivariate Gaussian distribution with mean XGβGq and covariance structure VG. We estimated the group inference βGq, weight vector αGq, and the variance term in VG by maximizing the log-likelihood of the probability density function of the multivariate Gaussian distribution3,5, as detailed in Fig. 1. Task fMRI data were analyzed using the proposed method, univariate multilevel GLM with various levels of Gaussian smoothness, and previously published multivariate techniques. Validation using simulated data. Simulation in our previous publication on fMRI group-analysis using local CCA approach was reused here3. Briefly, 500 5x5 neighborhoods with active center voxels and 500 neighborhoods with inactive center voxels for 16 subjects were simulated mimicking the real fMRI data for contrast encoding vs. control. The proposed method was applied to the simulated data and compared with previously published results of other univariate and multivariate group analysis methods using receiver operating characteristic (ROC) technique.Results
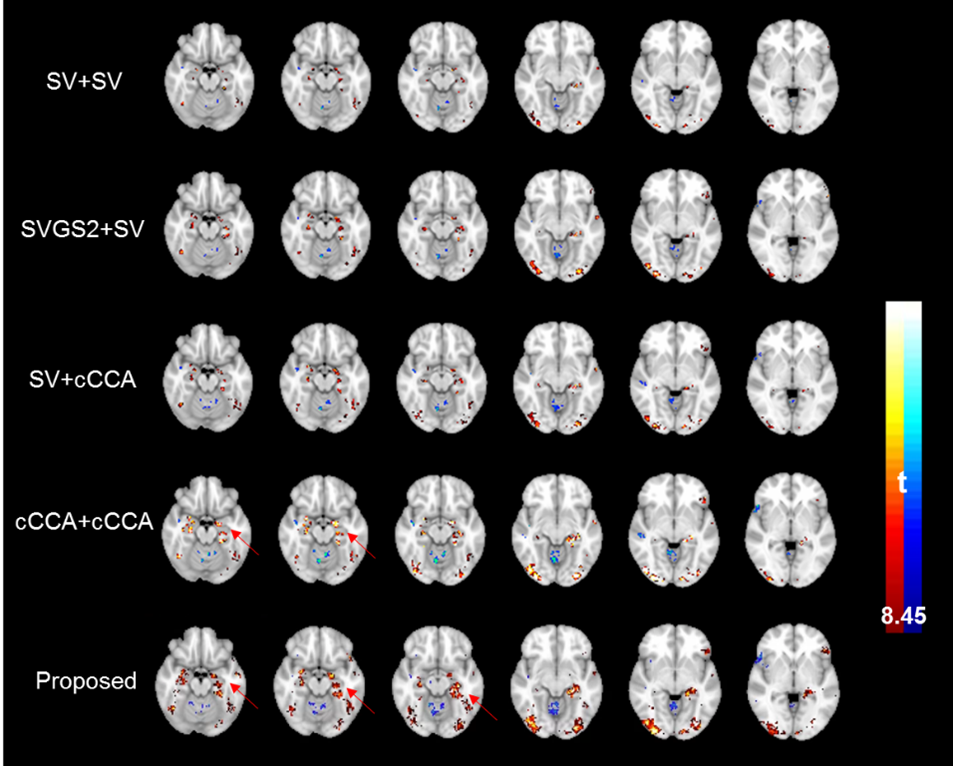
Fig.1 details the proposed method starting from subject-level smoothing to group-level optimization. Fig. 2 plots the area under the ROC curve, integrated over false positive rate from 0 to 0.1, for simulated data with noise fractions from 0.55 to 0.95 analyzed using different methods. At noise levels greater than 0.75, the proposed method (we named it st-sum-CCA) outperforms previous best methods (cCCA+cCCA). Fig. 3 shows group-level activation maps for contrast encoding vs. control obtained from different analysis methods and thresholded at a parametric FWE corrected p<0.05 level (|t|>8.45). At this threshold, larger activations in the fusiform gyrus, para-hippocampal areas that follow the grey matter boundaries were detected with the proposed method.Discussion and Conclusion
We introduce a group-level fMRI analysis method that incorporates univariately analyzed subject-level effect maps from time series smoothed using spatially adaptive steerable filters with various FWHMs. The smoothed time series have been further orthogonalized before input to subject-level GLM analysis. Therefore, the obtained effect map from each time series will represent subject-level non-overlapping activation effects. By optimizing the contribution of each directional effect at the group-level, we are able to obtain more accurate activation maps in both simulated data and real fMRI episodic memory data. Future analysis will be focused on determining the statistical inferences more accurately using non-parametric approaches.Acknowledgements
This study is supported by the National Institutes of Health (grant 1RF1AG071566, P20GM109025 and P20AG068053), a private grant from the Peter and Angela Dal Pezzo funds, a private grant from Lynn and William Weidner, a private grant from Stacie and Chuck Matthewson, and the young scientist award at Cleveland Clinic Lou Ruvo Center for Brain Health (Keep Memory Alive Foundation).References
1. Woolrich MW, Behrens TEJ, Beckmann CF, Jenkinson M, Smith SM. Multilevel linear modelling for FMRI group analysis using Bayesian inference. Neuroimage [online serial]. 2004;21:1732–1747. Accessed at: http://www.ncbi.nlm.nih.gov/pubmed/15050594. Accessed December 28, 2017.
2. Beckmann CF, Jenkinson M, Smith SM. General multilevel linear modeling for group analysis in FMRI. Neuroimage [online serial]. 2003;20:1052–1063. Accessed at: http://www.ncbi.nlm.nih.gov/pubmed/14568475. Accessed December 28, 2017.
3. Zhuang X, Yang Z, Sreenivasan KR, et al. Multivariate group-level analysis for task fMRI data with canonical correlation analysis. Neuroimage. United States: Elsevier Ltd; 2019;194:25–41.
4. Correa NM, Adali T, Li Y, Calhoun VD. Canonical Correlation Analysis for Data Fusion and Group Inferences. IEEE Signal Process Mag. 2010;27:39–50.
5. Li X, Coyle D, Maguire L, McGinnity TM. Maximum likelihood estimation for second level fMRI data analysis with expectation trust region algorithm. Magn Reson Imaging [online serial]. Elsevier Inc.; 2014;32:132–149. Accessed at: http://dx.doi.org/10.1016/j.mri.2013.10.007.
Figures