4079
The frequency dependence of the resting-state fMRI signal on macrovascular volume and orientation1Rotman Research Institute, Baycrest Health Sciences, Toronto, ON, Canada, 2Department of Medical Biophysics, University of Toronto, Toronto, ON, Canada
Synopsis
Frequency analysis of the BOLD fMRI signal is increasingly finding application, including in evaluating denoising procedures and biological brain changes. In resting-state fMRI (rs-fMRI), the signal frequency can be biased by contributions from large vessels, but this phenomenon is uninvestigated. In this work, we show that the rs-fMRI frequency content varies with both vascular volume fraction and orientation. Moreover, arteries and veins contribute differently to these variations.
Introduction
The blood-oxygenation level-dependent (BOLD) resting-state fMRI has widely been used in studies of neural connectivity1, health2, and aging3, however, the BOLD signal could be a mixture of neural and physiological factors (including blood pressure4, head motion5, vasomotion6, and fluctuations in arterial carbon dioxide7). Moreover, the BOLD signal is fundamentally driven by large blood vessels8, and the macrovascular signal has been used to derive clinically useful parameters such as blood-transit time9. One of the most common ways for fMRI denoising is bandpass filtering5, but the filter design could be inaccurate without a better interpretation of the frequency domain of the BOLD signal. Although most rs-fMRI studies focus on signal-amplitude variability and correlation/synchrony-based metrics, the fMRI signal frequency is beginning to show value as a unique marker for neural aging10 and for mapping functional connectivity11. The frequency content of the BOLD signal could furthermore be linked to its dynamic vascular response12, useful to studying the vascular physiology underlying the BOLD signal. Nonetheless, the influence of macrovascular physiology and morphometry on BOLD signal frequency remains unclear. In this study, we used simulations of different vascular oscillations and volume to demonstrate that the frequency content of the BOLD signal can vary simply with vascular voxel occupancy and orientation relative to the main magnetic field (B0).Method
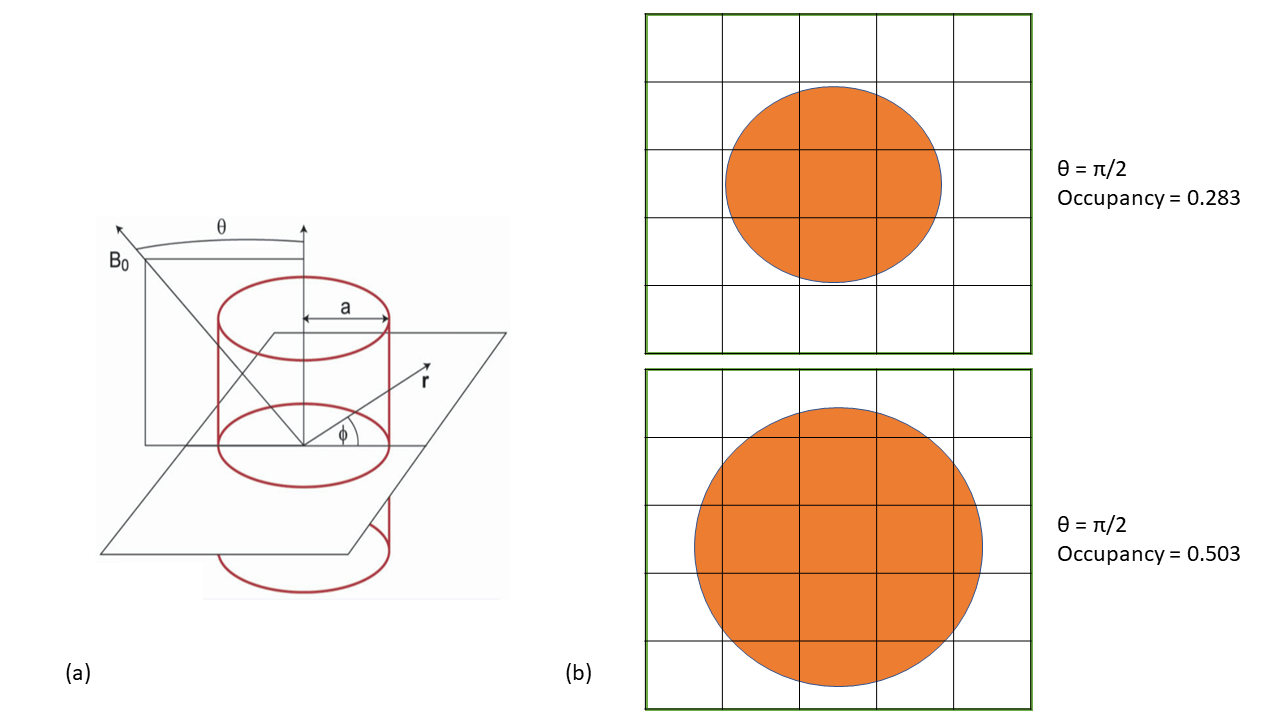
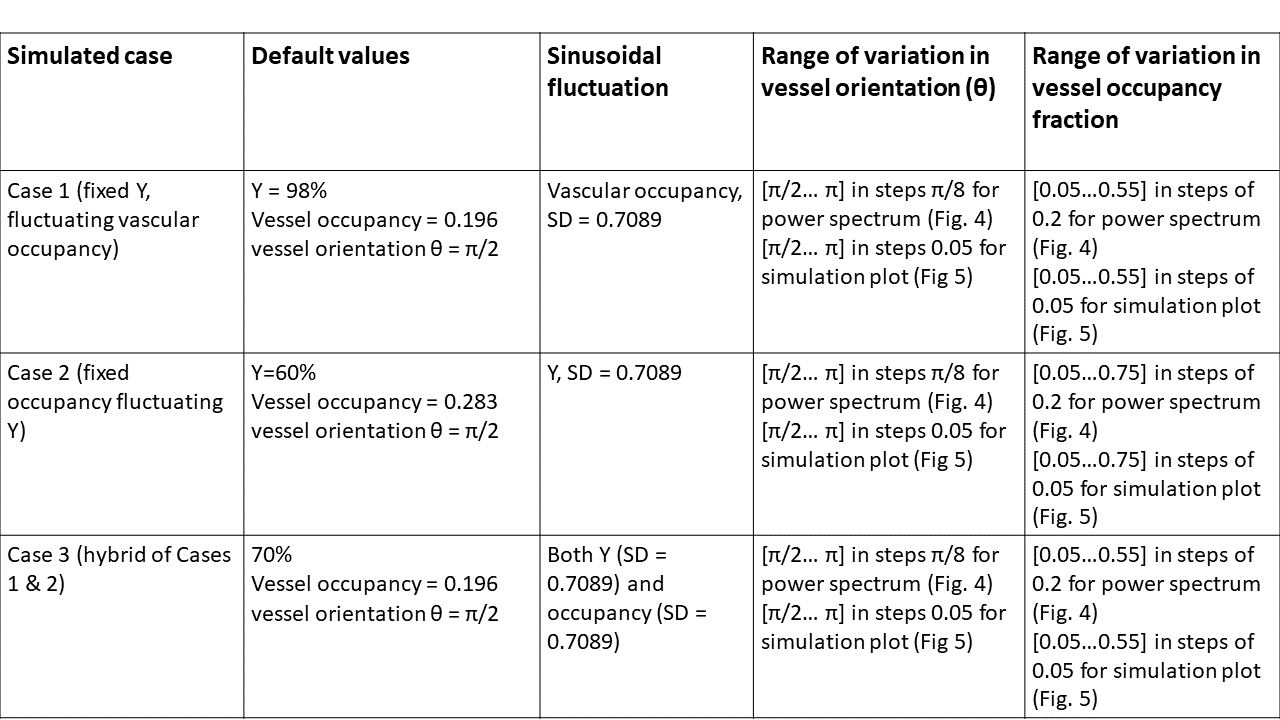
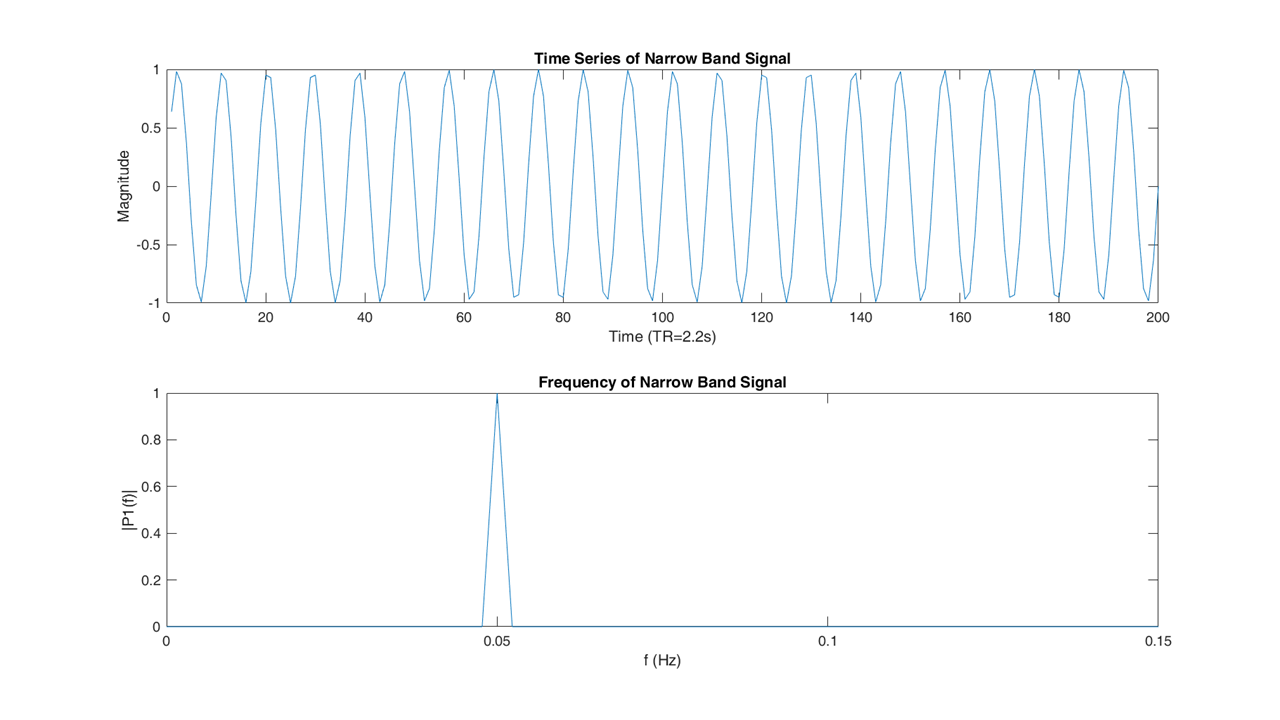
The simulation was based on the infinite-cylinder model13 (Eq. 1 and Eq.2). We assume a 2D square voxel of 4mm, composed of 16,000,000 1 um square sub-voxels, B0=3T, TR=2200ms, TE=27ms, and flip angle(α)=90o. Large vessels are placed in the middle of the voxel (Fig. 1), diffusion and inflow effects were ignored. Blood T1 is set to 1649ms14 and tissue T1 to 1465ms15. The T2 for tissue and blood were calculated according to previous studies16. Tissue oxygenation is set to 85%. fCBV is computed as the area of the 2D vessel cross-section as a fraction of the 2D voxel area. To simulate orientation variations, we kept vascular occupancy (fCBV) fixed and varied θ. To simulate fCBV effects, we kept θ fixed. Three vascular scenarios were created(Fig. 2). Case 1 simulates an artery, whereby blood oxygenation (Y) remains constant with time while vascular fraction varies sinusoidally at a frequency of 0.05 Hz to represent the frequency of a typical rs-fMRI signal (Fig. 3). Case 2 simulates a vein, whereby vascular fraction does not vary but Y does. Case 3 is a hybrid of 1 and 2, representing a more realistic vessel. $$ \text { Extravascular Magnetic Field Offset: } \omega_{B}=2 \pi \Delta \chi(1-Y) \omega_{0} \sin ^{2}(\theta)(a / r)^{2} \cos (2 \phi) \;\;(1) $$$$ \text { Intravascular Magnetic Field Offset: } \omega_{B}=2 \pi \Delta \chi(1-Y) \omega_{0}\left(3 \cos ^{2}(\theta)-1\right) / 3 \;\;(2) $$$$ \text { Signal: } S=\sin (\alpha)(1-\exp (-T R / T 1)) /\left(1-\cos (\alpha) \exp (-T R / T 1) \exp \left(-T E / T 2^{*}\right)\right.\;\;(3) $$The frequency content of the simulated BOLD signal is represented as the frequency corresponding to the centre of mass of the demeaned BOLD power spectrum (Eq. 4, where Pi is the power at frequency fi, over m frequencies).$$ \text { Central Frequency }=\frac{\sum_{i=0}^{m} P_{i} f_{i}}{\sum_{i=0}^{m} P_{i}}\;\;(4) $$Results
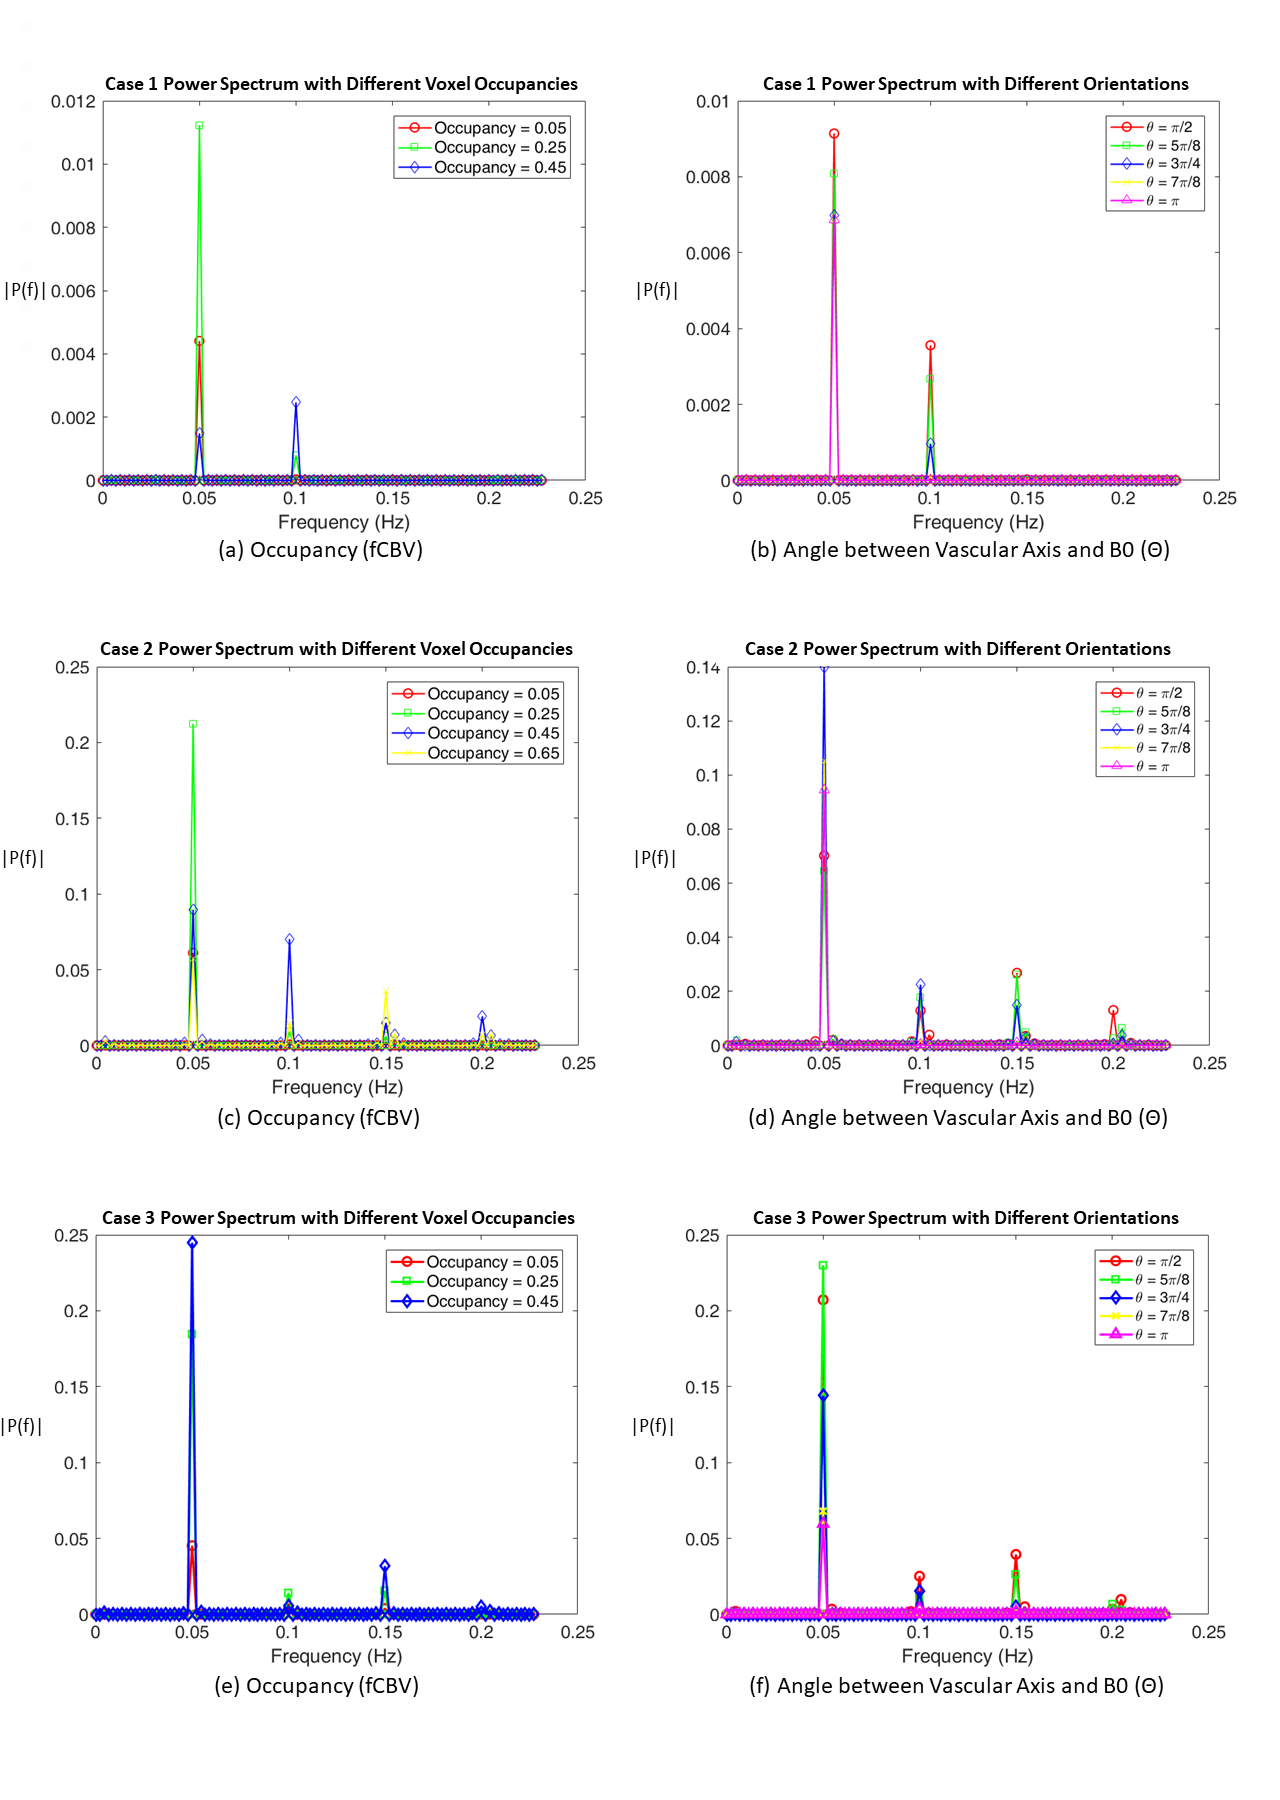
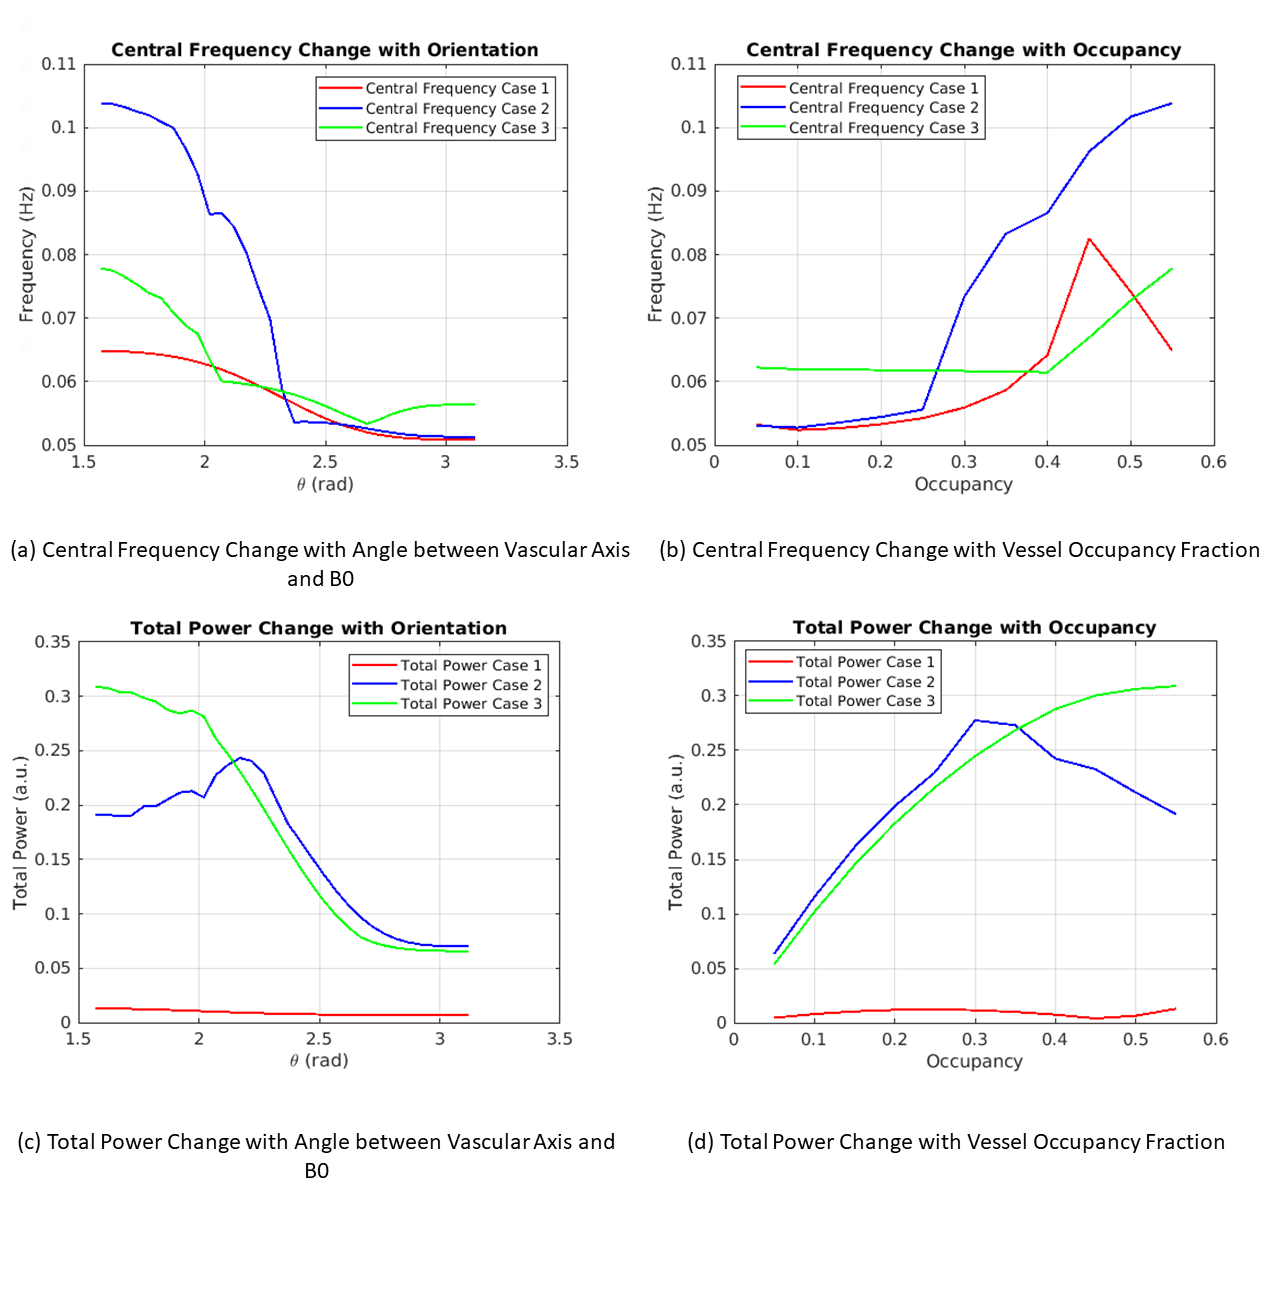
In all three cases, besides peaks located at input peak frequency of 0.05 Hz, multiple harmonic peaks appear in the spectrum of the BOLD signal (Fig. 4). The power ratios among peaks change with both fCBV and θ. The different cases also evolve differently with increasing θ. For both Cases 1 and 2, the central frequency first increases with fCBV then decreases, peaking at fCBV = 0.45 and 0.65, respectively. The central BOLD frequency of Case 3 decreases slightly and then increases dramatically after a fCBV of about 0.4. For orientation variation, both Cases 1 and 2 show central frequency reductions with increasing θ while in Case 3 the central frequency drops before slightly rising with rising θ. The total BOLD signal power is also shown as the reference for each case.Discussion
We show that the central frequency of the BOLD signal for large blood vessels varies with vessel type, fraction and orientation. The exponential transform of sinusoids results in the production of multiple harmonic peaks. While this effect is easier to visualize using a sinusoidal model, it will also apply to other signal forms. Variations in the central frequency with fCBV could be caused by varying mixtures of blood and tissue T1 and T2 decay, whereas the variations with vessel orientation arise from the field offset dependence on θ (Eq. 1 & 2). These factors also lead to variations in the BOLD signal power, which have no clear link with BOLD frequency changes. Moreover, different patterns of fluctuations in Y and fCBV could lead to entirely different central frequency variations for these 3 cases, and describing the behaviour of the BOLD frequency using an analytical expression has proven challenging.Conclusion
In this work, we show that variations in BOLD signal frequency content of large blood vessels may be heavily influenced by vessel geometry. Our future work will also involve experimental demonstration of these effects. These simulation results could help us better understand the origins of the rs-fMRI BOLD signals.Acknowledgements
The authors acknowledge funding support from the Canadian Institutes of Health Research (CIHR) and the Natural Sciences and Engineering Research Council of Canada (NSERC).References
1. Premi E, Cauda F, Gasparotti R, et al. Multimodal FMRI resting-state functional connectivity in granulin mutations: the case of fronto-parietal dementia. PLoS One. 2014;9(9):e106500.
2. Mascali D, DiNuzzo M, Gili T, et al. Intrinsic patterns of coupling between correlation and amplitude of low-frequency fMRI fluctuations are disrupted in degenerative dementia mainly due to functional disconnection. PLoS One. 2015;10(4):e0120988.
3. Kumral D, Şansal F, Cesnaite E, et al. BOLD and EEG signal variability at rest differently relate to aging in the human brain. Neuroimage. 2020;207:116373.
4. Julien C. An update on the enigma of Mayer waves. Cardiovasc Res. 2020;116(14):e210-e211.
5. Gratton C, Dworetsky A, Coalson RS, et al. Removal of high frequency contamination from motion estimates in single-band fMRI saves data without biasing functional connectivity. Neuroimage. 2020;217(116866):116866.
6. Obrig H, Neufang M, Wenzel R, et al. Spontaneous low frequency oscillations of cerebral hemodynamics and metabolism in human adults. Neuroimage. 2000;12(6):623-639.
7. Wise RG, Ide K, Poulin MJ, Tracey I. Resting fluctuations in arterial carbon dioxide induce significant low frequency variations in BOLD signal. Neuroimage. 2004;21(4):1652-1664.
8. Tong Y, Hocke LM, Frederick BB. Low Frequency Systemic Hemodynamic “Noise” in Resting State BOLD fMRI: Characteristics, Causes, Implications, Mitigation Strategies, and Applications. Front Neurosci. 2019;13:787. doi:10.3389/fnins.2019.00787
9. Tong Y, Yao JF, Chen JJ, Frederick BD. The resting-state fMRI arterial signal predicts differential blood transit time through the brain. J Cereb Blood Flow Metab. 2019;39(6):1148-1160.
10 Yang AC, Tsai S-J, Lin C-P, Peng C-K, Huang NE. Frequency and amplitude modulation of resting-state fMRI signals and their functional relevance in normal aging. Neurobiol Aging. 2018;70:59-69.
11. Yaesoubi M, Silva RF, Iraji A, Calhoun VD. Frequency-aware summarization of resting-state fMRI data. Front Syst Neurosci. 2020;14:16.
12. Magnuson M, Majeed W, Keilholz SD. Functional connectivity in blood oxygenation level-dependent and cerebral blood volume-weighted resting state functional magnetic resonance imaging in the rat brain. J Magn Reson Imaging. 2010;32(3):584-592.
13. Ogawa S, Menon RS, Tank DW, et al. Functional brain mapping by blood oxygenation level-dependent contrast magnetic resonance imaging. A comparison of signal characteristics with a biophysical model. Biophys J. 1993;64(3):803-812.
14. Zhang X, Petersen ET, Ghariq E, et al. In vivo blood T(1) measurements at 1.5 T, 3 T, and 7 T. Magn Reson Med. 2013;70(4):1082-1086.
15. Wright PJ, Mougin OE, Totman JJ, et al. Water proton T1 measurements in brain tissue at 7, 3, and 1.5 T using IR-EPI, IR-TSE, and MPRAGE: results and optimization. MAGMA. 2008;21(1-2):121-130.
16. UIudag K, Müller-Bierl B, Ugurbil K. An integrative model for neuronal activity-induced signal changes for gradient and spin echo functional imaging. Neuroimage. 2009;47:S56.
Figures