4077
Deep-learning based rectal tumor localization and segmentation on multi-parametric MRI1Department of Radiation Oncology, Rutgers-Cancer Institute of New Jersey, Rutgers-Robert Wood Johnson Medical School, New Brunswick, NJ, United States, 2Department of Radiological Sciences, University of California, Irvine, CA, United States, 3Department of Radiation Oncology, Sir Run Run Shaw Hospital, Zhejiang University School of Medicine, Hangzhou, China
Synopsis
Two deep learning methods using the convolutional neural network (CNN) was implemented to segment the rectal cancer in 197 LARC patients, with tumor ROI outlined by a radiologist. For each patient, six frames, including T2, 2 DWI sequences and 3 LAVA sequences, were used for training and validation. The Dice similarity coefficient (DSC) value were used to compare the results of the proposed algorithm and the ROI outlined by reader. The mean DSC was 0.67 and 0.78 from each these 2 method respectively. The proposed algorithms especially the combined serials of U-Net showed improved performance compared to prior published work with individual sequence only. Our work showed the deep-learning with combined image sequence can provide as a promising tool for fully automatic tumor localization and segmentation for rectal cancer.
Introduction
Multiparametric Magnetic Resonance Imaging (MRI) has been considered as the first choice for rectal cancer examination. Many studies have shown that radiomics from anatomical and functional MRI extracted from rectal tumor can provide early prediction of the response to chemotherapy and further provide guidance for personalized treatment option selection [1-4]. However, the major limitation of these region-of-interest (ROI) based radiomics extraction method is the manual delineation. The process is time-consuming and user-dependent, thus less likely to be adopted for routine clinic use. Therefore, an automatic tumor localization and segmentation is of great importance for prediction model construction.Recent years, deep learning models have stimulated great interest for tackling challenging tasks in medical imaging such as pulmonary node detection and segmentation. However, due to considerable individual differences in the location and shape, as well as its movable surrounding tissue, localization and segmentation of rectal tumor is more complicated. Here we hypothesize that using all imaging frame information, with combined DWI, T2-weighted imaging, and dynamic contrast enhanced (DCE) imaging, as input to deep-learning algorithm may improve the performance of rectal tumor localization and segmentation. We further validated the performance of deep learning algorithm by comparing with the ground-truth as manual segmentation from an expert radiologist.Methods
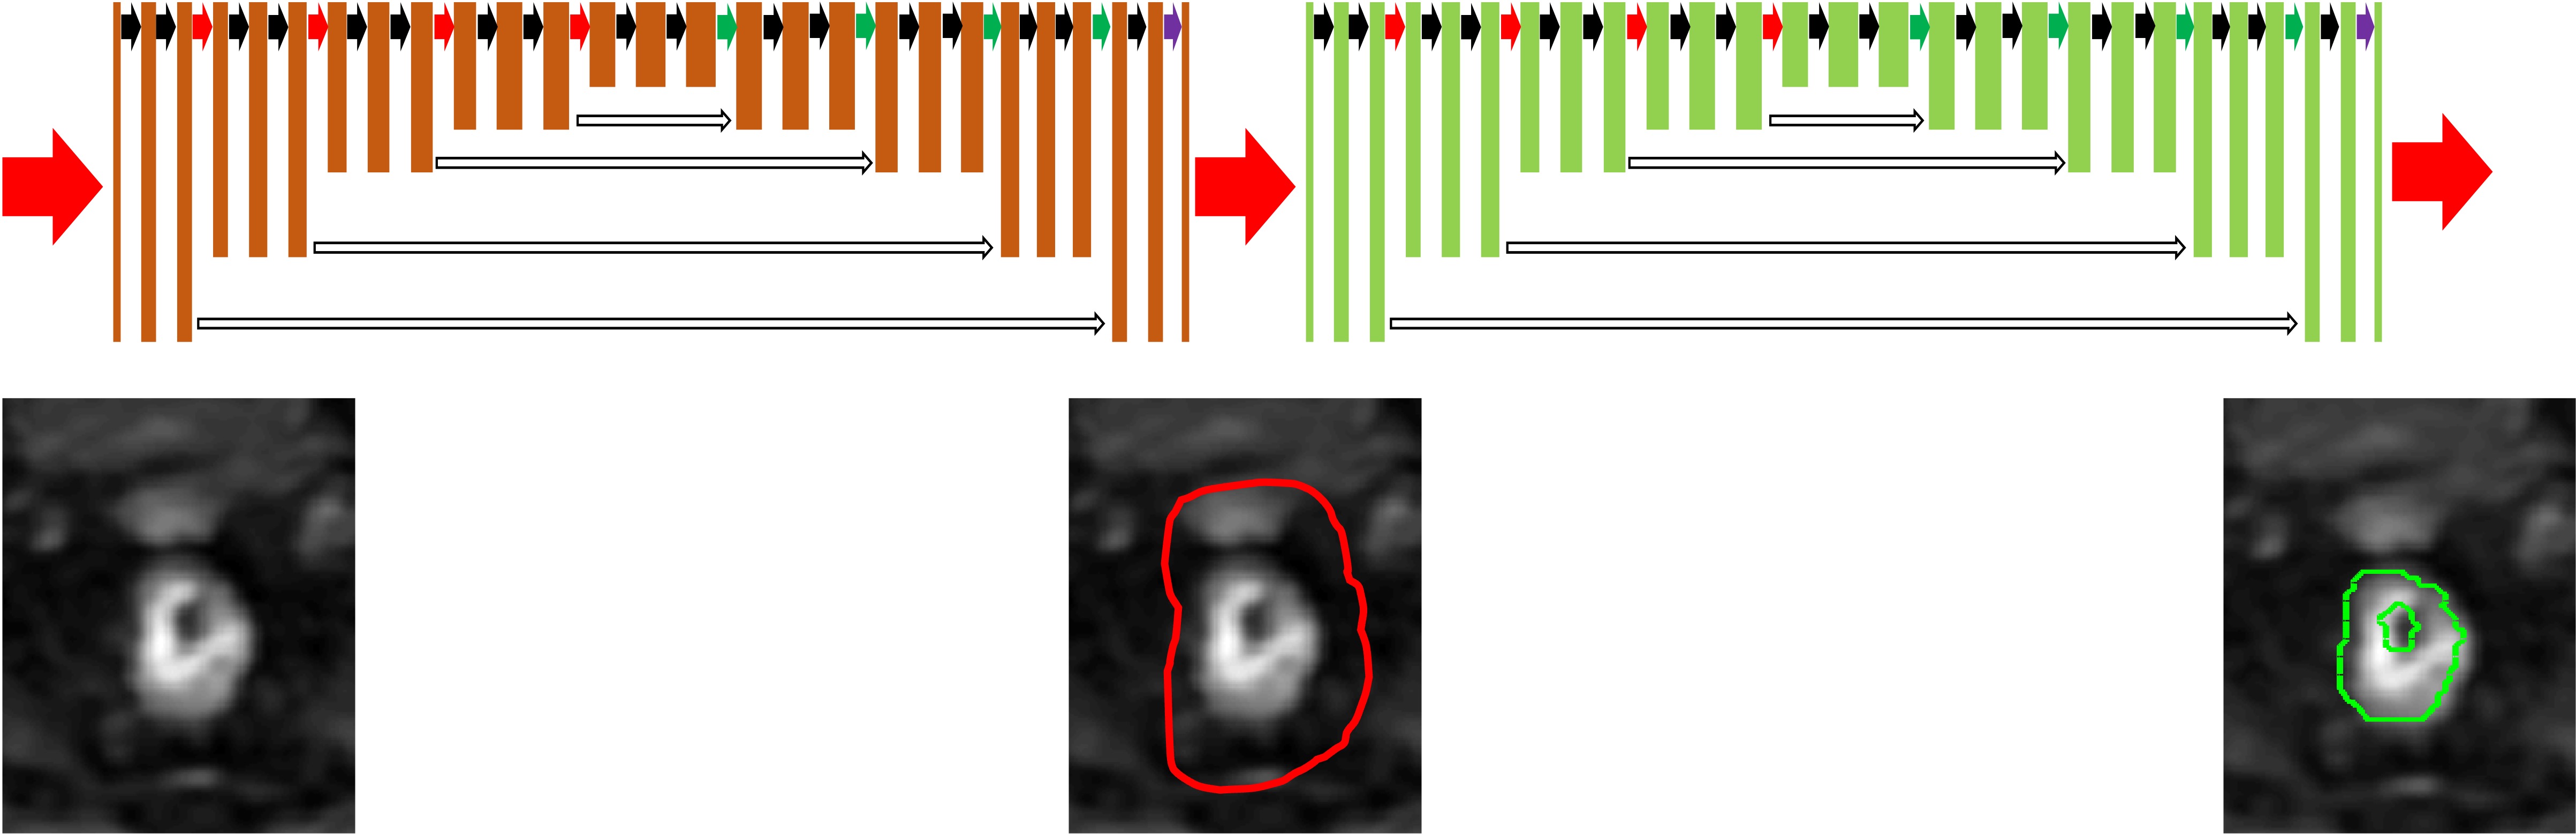
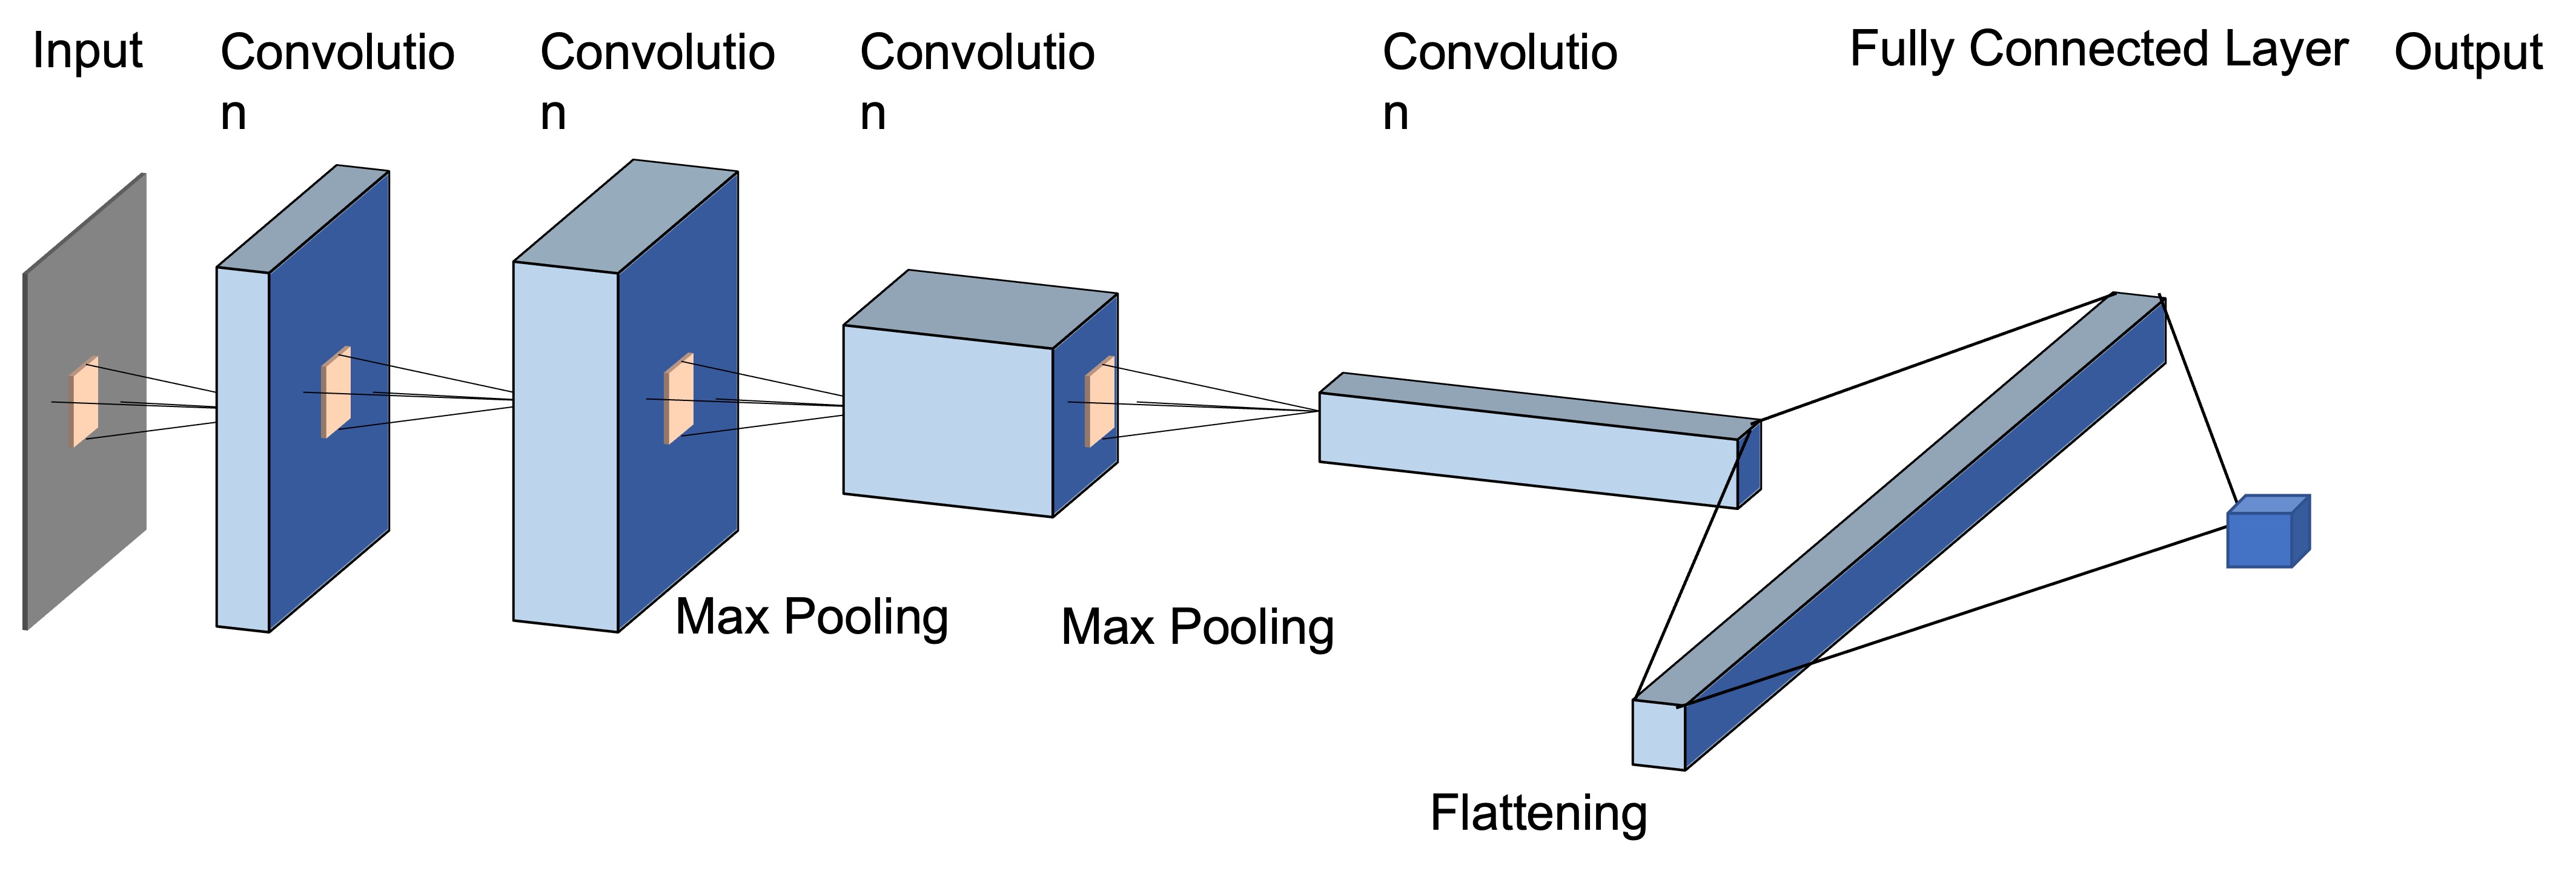
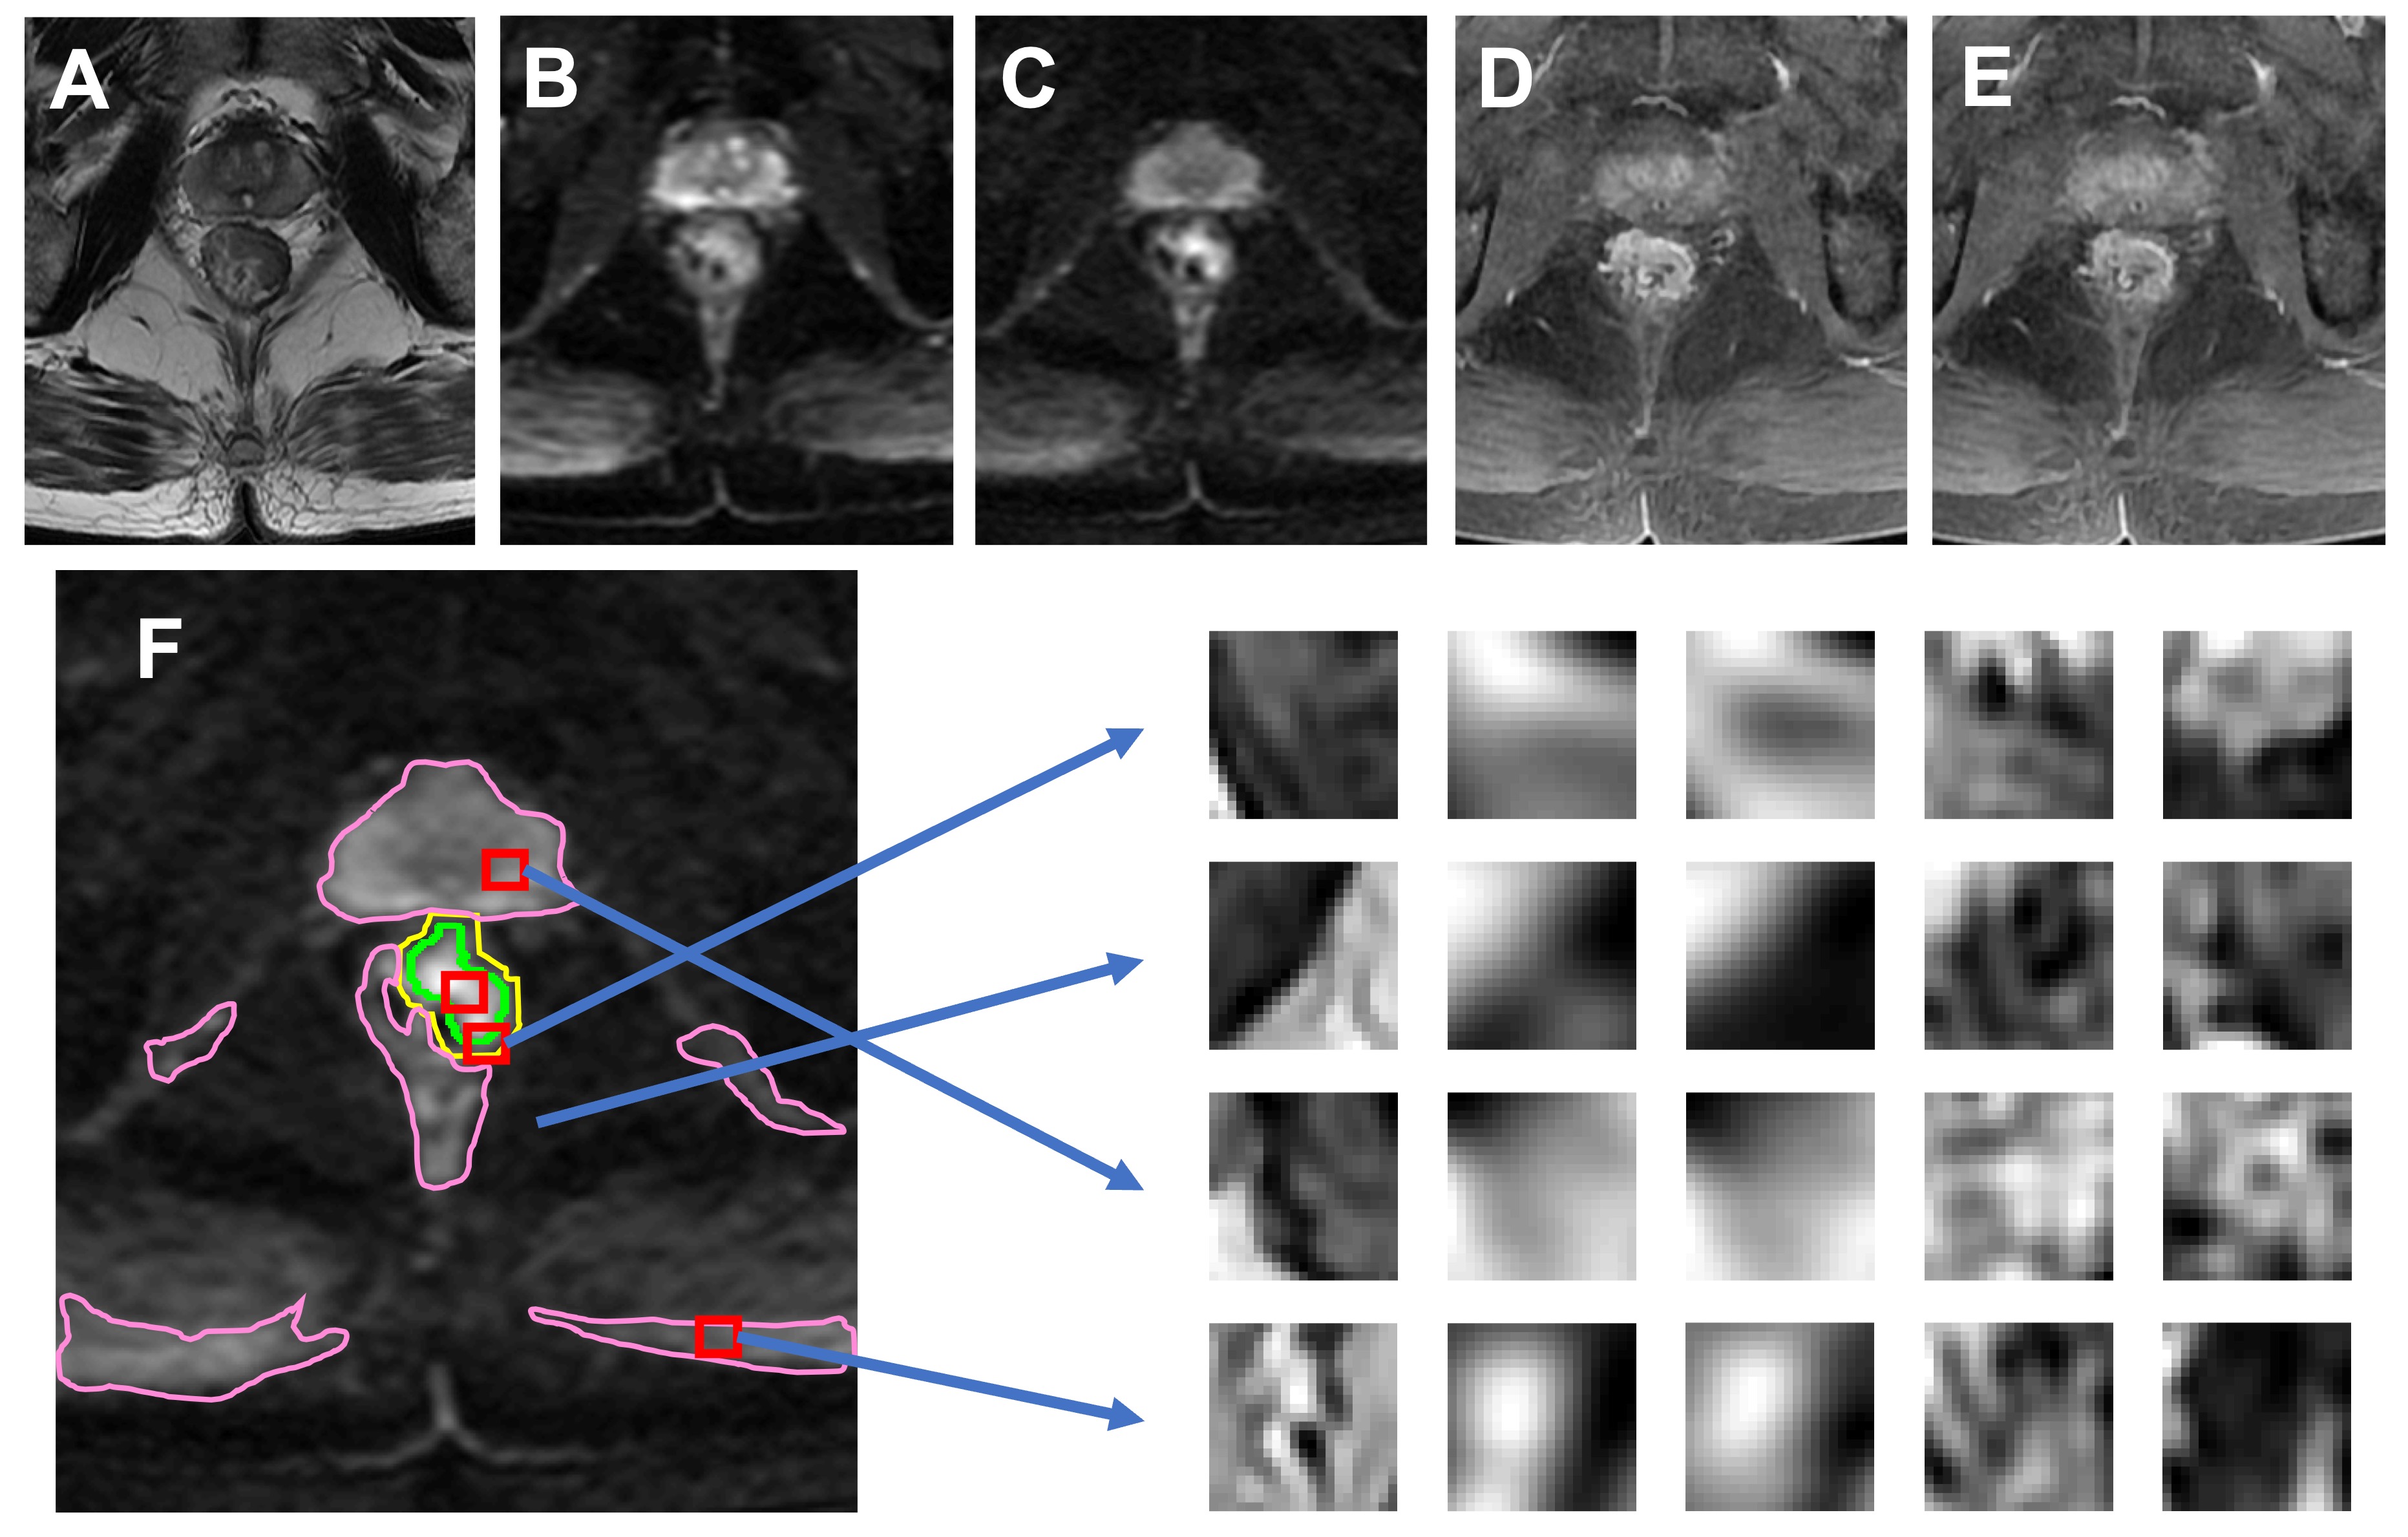
Multi-parametric MRI from 197 patients with locally advanced rectal adenocarcinoma were collected and used in this study. All scans were done on a 3.0 Tesla scanner (GE Signa HDxt) using a phased-array body coil. The imaging protocol included T1w, T2w, DCE-MRI acquired using a spoiled gradient echo sequence (LAVA), and DWI. All images were reviewed by an experienced rectal MRI radiologist. The ground-truth was outlined as a region of interest (ROI), excluding the intestinal lumen, on the third-phase gadolinium-enhanced images (60 seconds after the injection of contrast agent) while using all other image sequences as references.Intensity standardization was firstly applied to all images with the intensity distribution set to have mean zero and standard deviation of one. Image patches with size of 21x21 pixels at the same position across all six frames were used as the input, including (1) T2-weighted image, (2) the diffusion-weighted image with b = 0, (3) the diffusion weighted image with b=800, (4) pre-contrast image (LAVA1), (5) 30 seconds after contrast injection image (LAVA2), (6) 60 seconds after contrast injection image (LAVA3).Two CNNs based deep-learning methods as pixel based identification and combined serials of U-nets were proposed and compared. For the first algorithm with pixel based identification, the architecture of the network is shown in Fig 1.It is composed by 4 convolution layers with a kernel of 3x3, two max pooling layers (down-sampling), xxx transpose layer. The final layer is a fully connected layer to produce a probability map. Since rectal tumor was located at the central region, the searching was focused on the central portion. Three regions were identified in searching area: (1) the hyper-intense area on the DWI defined by thresholding on the DWI at μ + 2σ, (2) the area surrounding the tumor, and (3) the remaining area. The patch extraction process is shown on Fig. 2. A total of N patches were extracted from the searching area , N/2 voxels from the second region, and N/4 voxels from the first and third regions respectively. To balance the data, there were N patches extracted inside the tumor ROI. The output of the network is the probability map of the central pixel belonging to a tumor.The second method is a network with two combined serials of U-nets with architecture shown in Fig 3. The two U-net was trained differently. Each U-net contains 12 convolutional layers in descending part and 12 convolutional layers in ascending part. The convex hull of each lesion ROI was generated and enlarged by 1.5 times. These generated labels were utilized to train the first U-net. The results of this U-net were sent to the next U-net which was trained by original tumor ROI and applied to predict the boundary of lesions. The first U-net worked a localizer which roughly indicate the rectal positions. The U-net was used to convert each image into probability map with the same size.Results
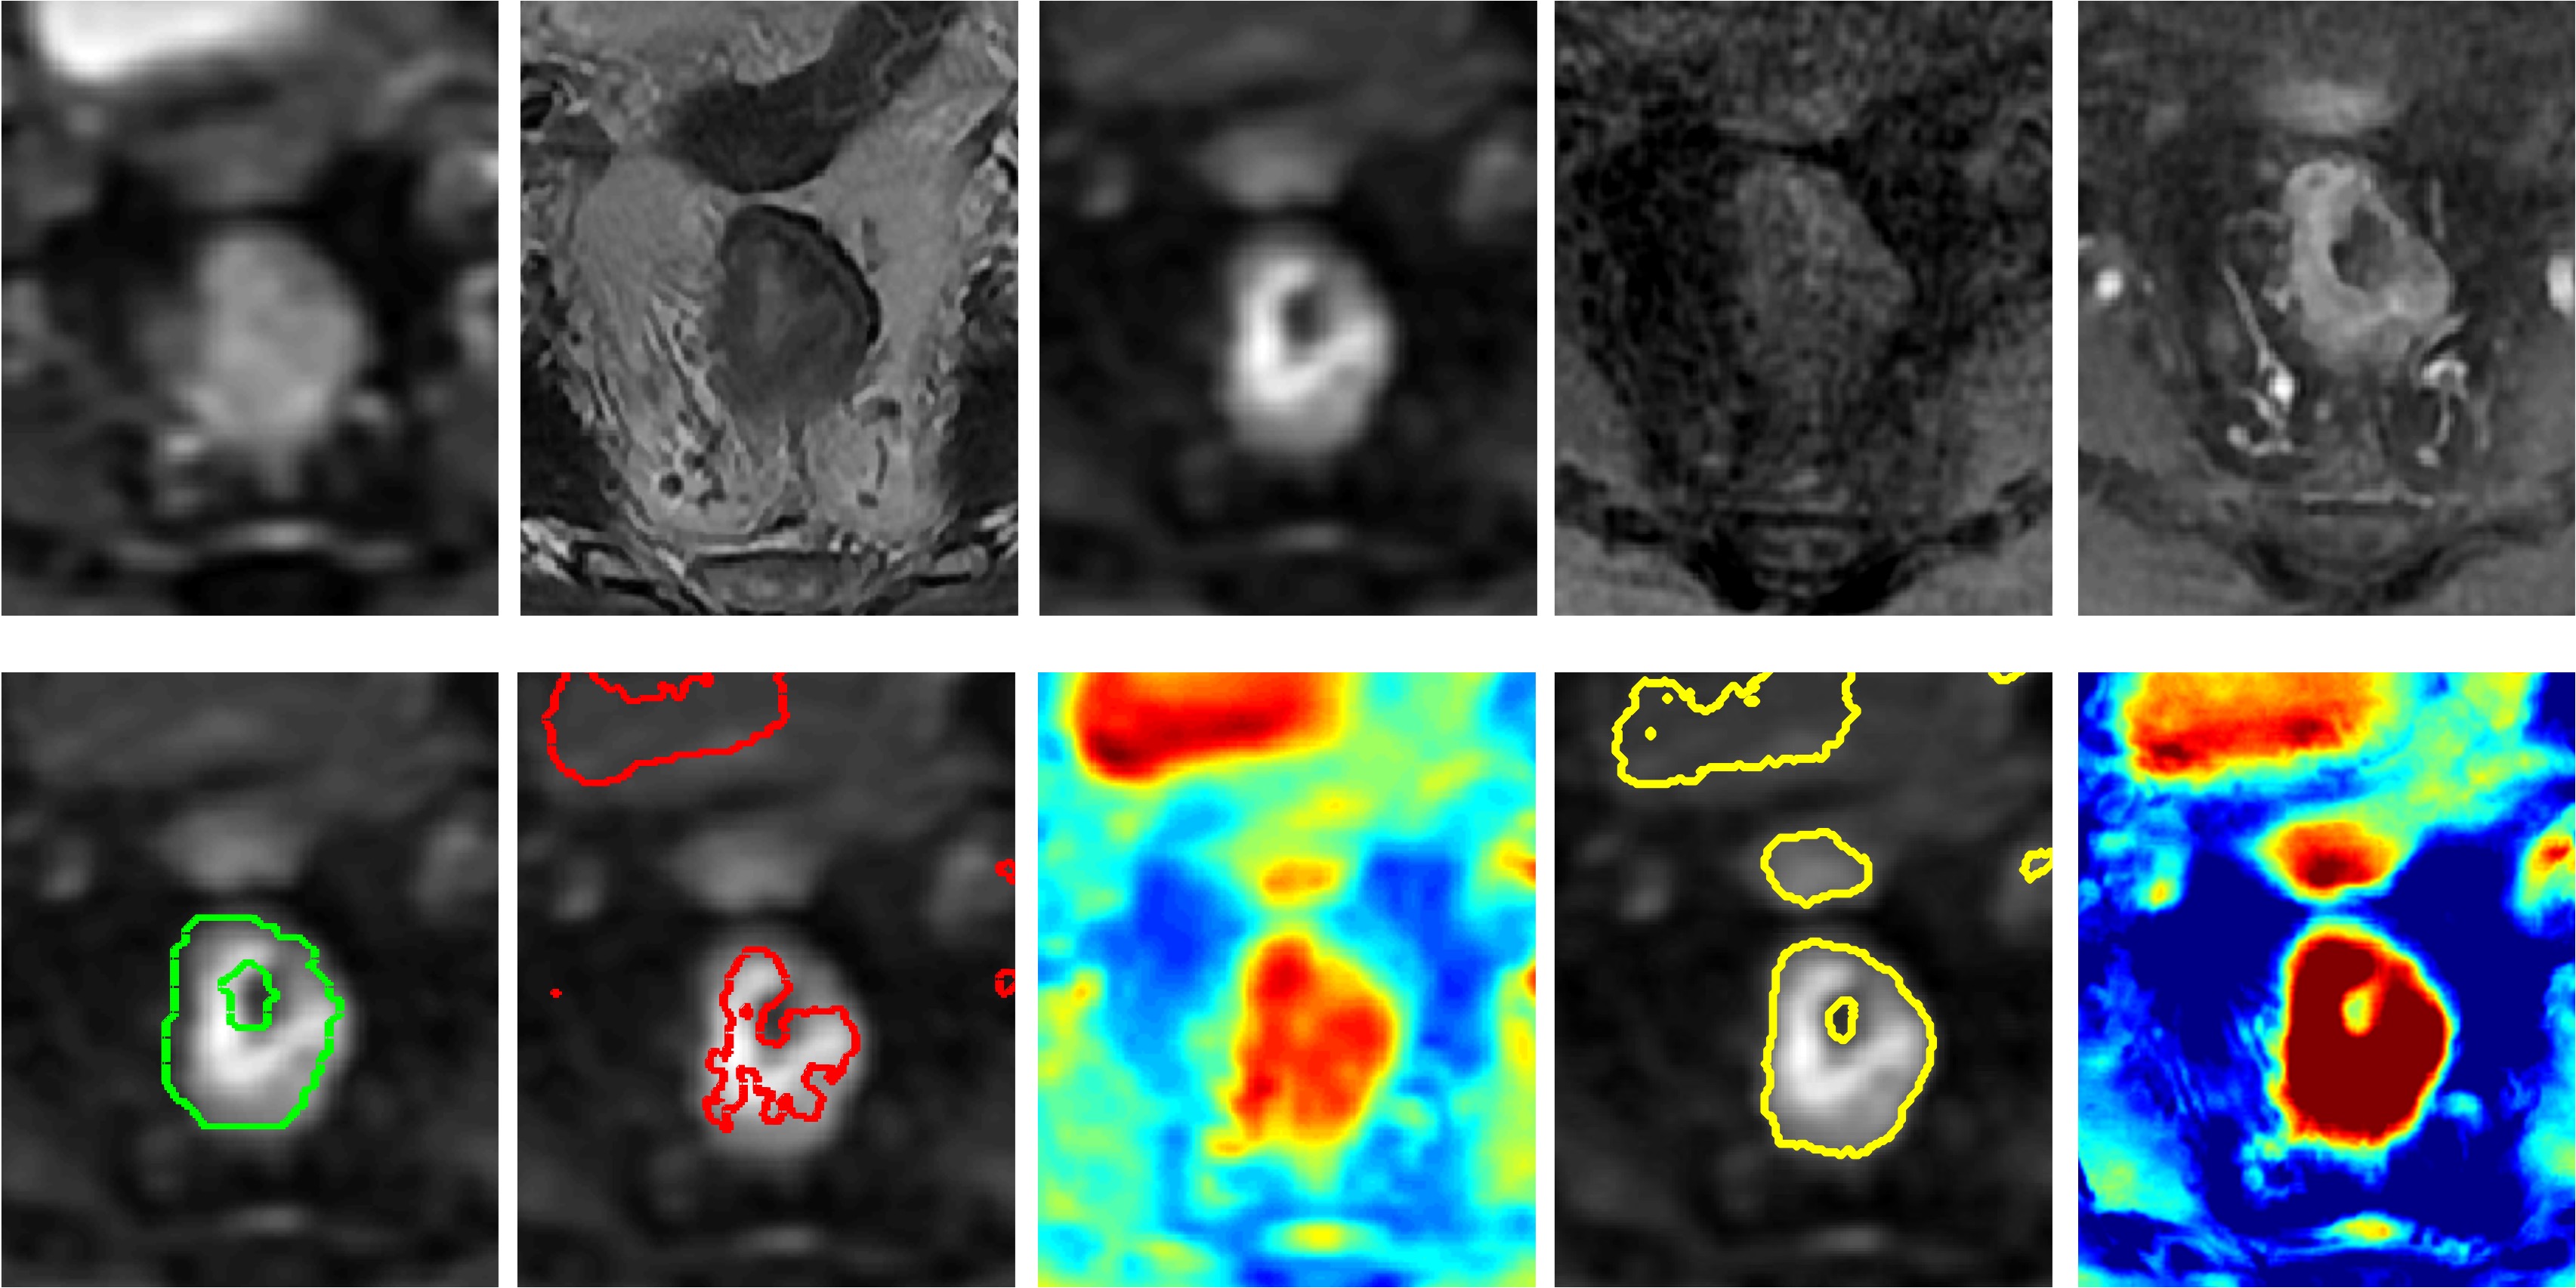
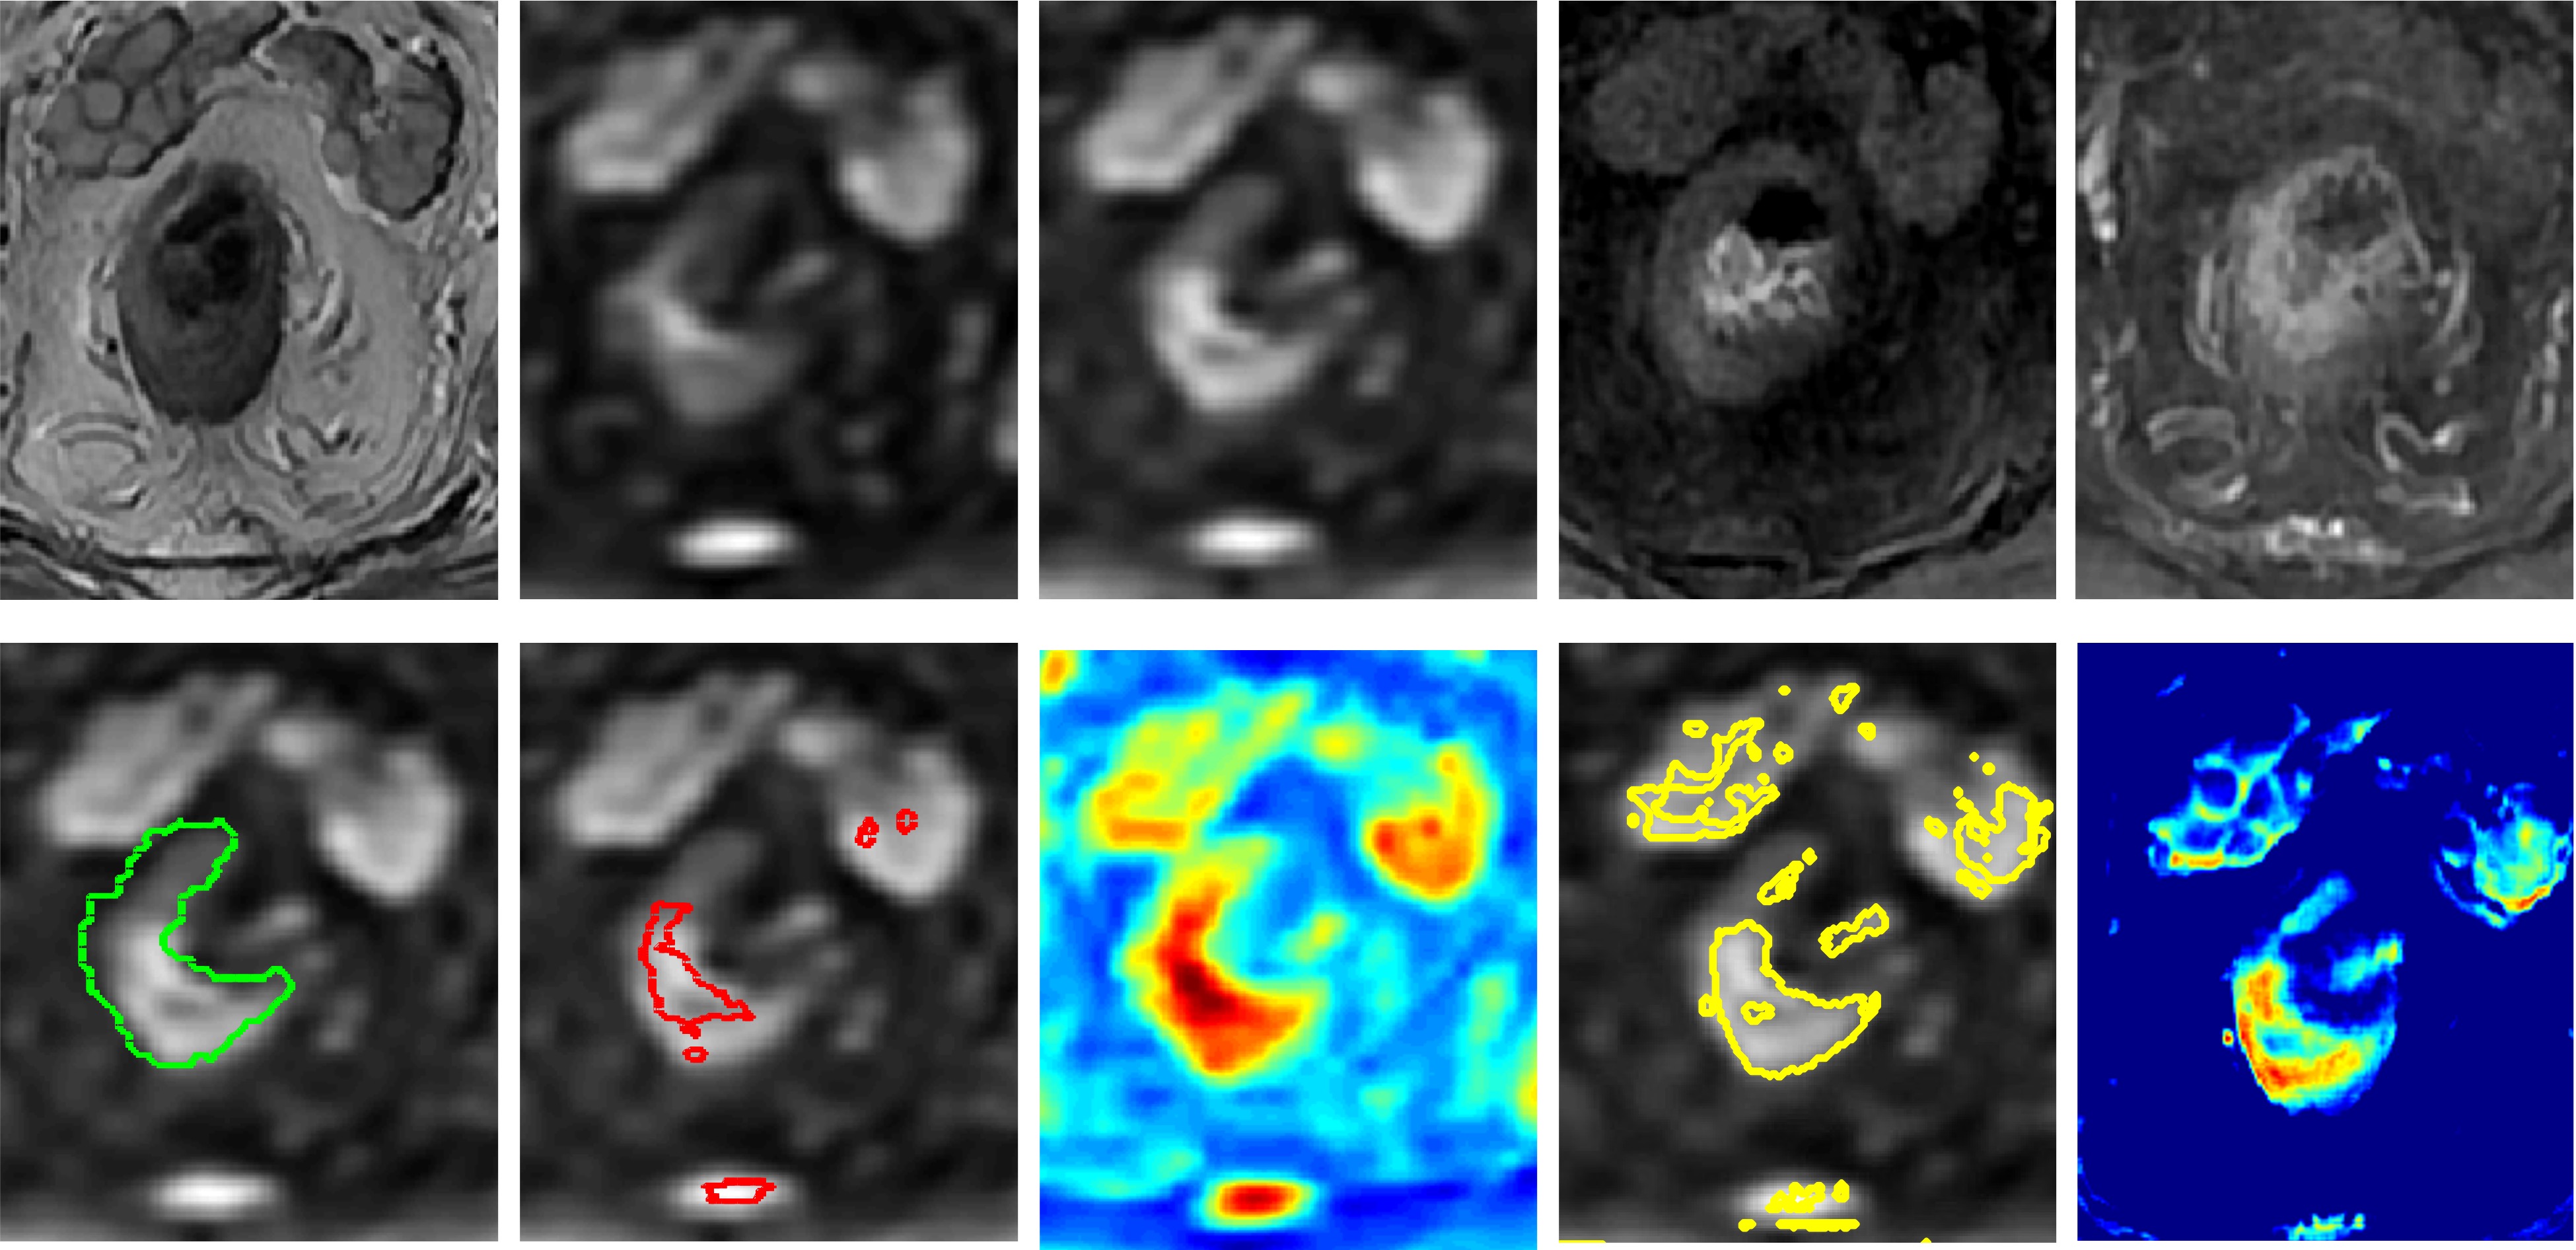
Ten-fold cross-validation was used to evaluate the performance of the two classifiers. The validation group was used to optimize the hyperparameters such as learning rate, decay rate, and epochs by maximizing the object function. Two examples are shown on Figs. 4-5. To evaluate the performance of the segmentation, the Dice Similarity Coefficient (DSC) was used to compare the results of the proposed algorithm and the ROI outlined by reader. Among all 197 patients, for pixel based method, the mean of DSC is 0.67. For U-net, the mean of DSC is 0.78.Discussion
Developing an efficient and reliable tumor segmentation method may provide a fundamental step to quantitatively extract imaging information and further to assess patient risk or benefit in getting personalized treatment. T2W and DWI are the most useful MRI protocols for the diagnosis of rectal tumors. Several deep learning models have been established based on T2W images or DWI alone [x-x], but segmentation result is barely acceptable with DSC between 0.55 to 0.64. In this study, we tested two convolutional neural networks with combined multi-parametric imaging sequences. The results showed that deep-learning algorithm especially the combined serial U-Net model is promising to perform fully automatic and accurate segmentation of rectal tumor. This can provide fundamental step to reliably and efficiently extract morphological and functional information of the tumor to further assist optimal treatment strategy design for those patientsAcknowledgements
This study is supported in part by NIH R01 CA127927 and Rutgers-RBHS precision medicine pilot grant, The Rutgers-Cancer Institute of New Jersey P30 CA072720.References
[1] Kim YH, Kim DY, Kim TH, Jung KH, Chang HJ, Jeong SY, Sohn DK, Choi HS, Ahn JB, Kim DH, Lim SB. Usefulness of magnetic resonance volumetric evaluation in predicting response to preoperative concurrent chemoradiotherapy in patients with resectable rectal cancer. International Journal of Radiation Oncology* Biology* Physics. 2005 Jul 1;62(3):761-8.[2] Seierstad T, Hole KH, Grøholt KK, Dueland S, Ree AH, Flatmark K, Redalen KR. MRI volumetry for prediction of tumour response to neoadjuvant chemotherapy followed by chemoradiotherapy in locally advanced rectal cancer. The British journal of radiology. 2015 May 28;88(1051):20150097.[3] Nie K, Shi L, Chen Q, Hu X, Jabbour SK, Yue N, Niu T, Sun X. Rectal Cancer: Assessment of Neoadjuvant Chemoradiation Outcome based on Radiomics of Multiparametric MRI. Clin Cancer Res. 2016 Nov 1;22(21):5256-5264.[4] Liu Z, Zhang XY, Shi YJ, Wang L, Zhu HT, Tang ZC, Wang S, Li XT, Tian J, Sun YS. Radiomics Analysis for Evaluation of Pathological Complete Response to Neoadjuvant Chemoradiotherapy in Locally Advanced Rectal Cancer. Clin Cancer Res. 2017 Sep 22. [Epub ahead of print][5] Trebeschi S, van Griethuysen JJ, Lambregts DM, Lahaye MJ, Parmer C, Bakers FC, Peters NH, Beets- Tan RG, Aerts HJ. Deep Learning for Fully-Automated Localization and Segmentation of Rectal Cancer on Multiparametric MR. Scientific Reports. 2017 Jul 13;7(1):5301.[6] Kingma D, Ba J. Adam: A method for stochastic optimization. arXiv preprint arXiv:1412.6980. 2014 Dec 22.Figures