4075
The dependence of the resting-state macrovascular fMRI signal power on vascular volume and orientation: A simulation study1Rotman Research Institute, Baycrest Health Sciences, Toronto, ON, Canada, 2Department of Medical Biophysics, University of Toronto, Toronto, ON, Canada
Synopsis
The resting-state fMRI (rs-fMRI) signal fluctuation amplitude is widely used as the resting-state fMRI marker, but it could be biased by the contribution of macrovessels. We demonstrate the dependence of the macrovascular contribution on blood oxygenation, vascular occupancy and orientation. This work paves the way for more appropriate interpretation of rs-fMRI signal amplitude given different vascular morphology across brain regions and populations.
Introduction
Low-frequency signal-fluctuation amplitude (or signal variability) of resting-state fMRI (rs-fMRI) is finding broad applications as a potential marker for brain health1,2. However, previous research indicates that the rs-fMRI signal fluctuation can be affected by vascular physiology, including blood pressure3, vasomotion4, and fluctuations in arterial carbon dioxide5. These effects can be most pronounced in the presence of major cerebral vessels (superior sagittal sinus and the Circle of Willis), and are most likely to be unrelated to neuron activity. The finding of cortical-orientation dependence of the rs-fMRI signal6 highlights the wide extent of large-vessel effects7. To better understand the mechanisms of this effect, we use simulations to characterize how the standard deviation (SD) of typical resting-state macrovascular signals varies with vascular occupancy fraction (fCBV) and orientation relative to the main magnetic field (B0) direction.Method
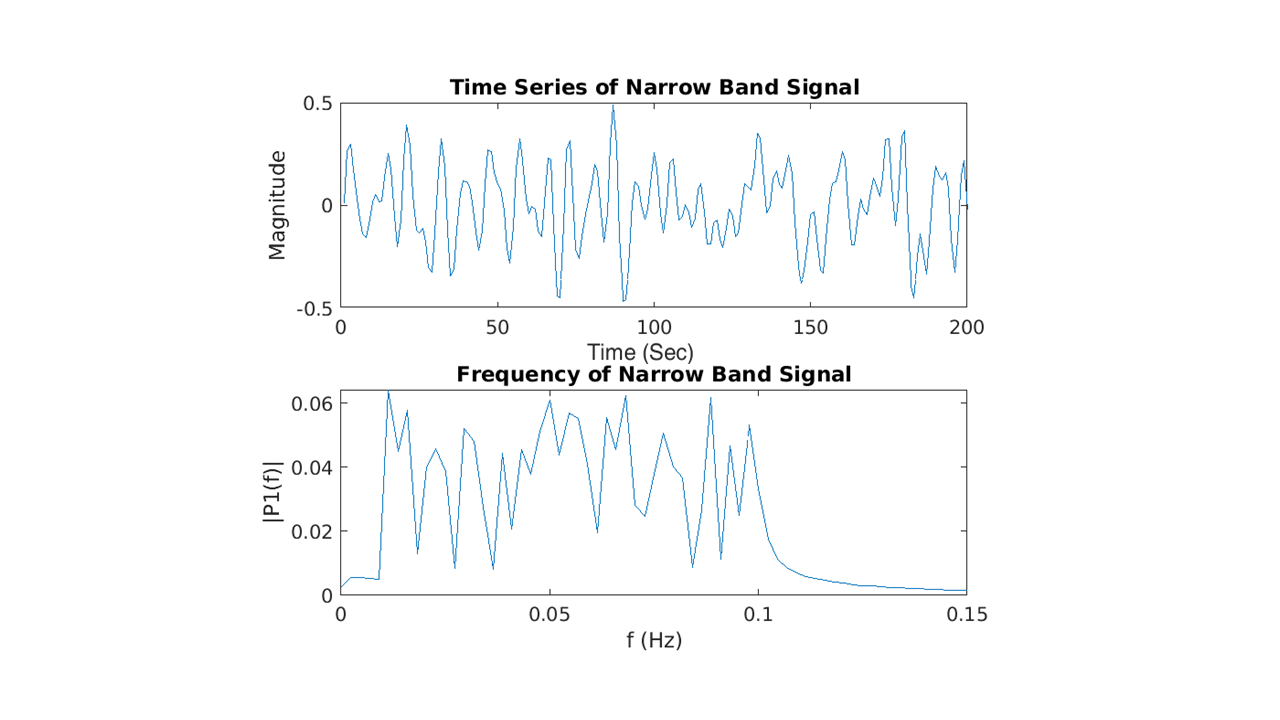
The simulation was based on the infinite-cylinder model proposed by Ogawa et al8 (Eq. 1 and Eq.2). We assume a 2D voxel size of 4mm isotropic, composed of 16,000,000 1-um isotropic sub-voxels, B0=3T, TR=2200ms, TE=27ms, and flip angle(α)=90o. fCBV is computed as the area of the 2D vessel cross-section as a fraction of the 2D voxel area. Large vessels are placed in the middle of the 2D voxel; diffusion and inflow effects are ignored. The blood and tissue T1s are set to 1649ms9 and 1465ms10, respectively The T2 of tissue and blood were calculated according to previous relaxometry studies11. Tissue oxygenation is set to 85%. To simulate orientation variations, we kept vascular occupancy (fCBV) fixed and varied θ.Conversely, to simulate fCBV effects, we kept θ fixed. Two different vascular scenarios were created as shown in Fig. 2. Case 1 represents artery-like vessels, whereby blood oxygenation (Y) remains constant with time while vascular fraction varies with input filtered random signal (Fig. 3). Case 2 simulates vein-like vessels, whereby vascular fraction does not vary but Y does. Intravascular and extravascular signals were calculated (Eq. 3) and weighted with fractional vascular occupancy. ΔΦ, representing average dephase, was also calculated during simulation.$$ \text { Extravascular Magnetic Field Offset: } \omega_{B}=2 \pi \Delta \chi(1-Y) \omega_{0} \sin ^{2}(\theta)(a / r)^{2} \cos (2 \phi) \;\;(1) $$
$$ \text { Intravascular Magnetic Field Offset: } \omega_{B}=2 \pi \Delta \chi(1-Y) \omega_{0}\left(3 \cos ^{2}(\theta)-1\right) / 3\;\; (2) $$
$$ \text { Signal: } S=\sin (\alpha)(1-\exp (-T R / T 1)) /\left(1-\cos (\alpha) \exp (-T R / T 1) \exp \left(-T E / T 2^{*}\right)\right. \;\; (3) $$
Results
Figure 3 illustrates how the SD of the macrovascular rs-fMRI signal varies with θ. Arteries and veins have anti-correlated phases, and veins are associated with much larger signal fluctuation envelopes. For both, the signal SD is maximized at θ=π/2, driven by the extravascular (EV) component. The IV and EV components are out of phase, resulting in a lower total arterial signal SD. The fractional BOLD signal SD is orders of magnitude larger for veins than for arteries. Figure 4 shows the influence of fCBV on the BOLD signal SD. Venous BOLD signal SD increases with fCBV but only until fCBV~0.3. Arterial signal standard deviation peaks at ~0.45 fCBV before declining. The interacting effects of fCBV and θ are shown in Fig. 5, showing that the BOLD signal SD is maximized when the vessel is perpendicular to B0 and occupying less than half of the voxel. This is unaffected by whether SD is normalized by the mean.Discussion
As expected, the presence of large blood vessels in the rs-fMRI signal biases the fMRI signal fluctuation amplitude, which could cause biased interpolation of signal variability, especially with vessels perpendicular to the B0 axis. The extent of bias depends on both vascular occupancy and orientation. Notably, the largest signal amplitude does not stem from the largest blood vessels. Moreover, the use of filtered random signals is novel, and more realistic. The findings are nonetheless similar to our simulation results with sinusoidal signals12. One limitation of our model is that blood vessels are not always at the centre of the voxel.Conclusion
In this study, we show that the resting-state BOLD signal power can be biased by large blood vessels in a manner that depends on the vessel’s voxel occupancy and orientation. Medium-sized vessels contribute more bias than small or large vessels. This work leads us to better understand the orientation dependence of fMRI signals6.Acknowledgements
The authors acknowledge funding support from the Canadian Institutes of Health Research (CIHR) and the Natural Sciences and Engineering Research Council of Canada (NSERC).References
1. Premi E, Cauda F, Gasparotti R, et al. Multimodal FMRI resting-state functional connectivity in granulin mutations: the case of fronto-parietal dementia. PLoS One. 2014;9(9):e106500.
2. Mascali D, DiNuzzo M, Gili T, et al. Intrinsic patterns of coupling between correlation and amplitude of low-frequency fMRI fluctuations are disrupted in degenerative dementia mainly due to functional disconnection. PLoS One. 2015;10(4):e0120988.
3. Julien C. An update on the enigma of Mayer waves. Cardiovasc Res. 2020;116(14):e210-e211.
4. Obrig H, Neufang M, Wenzel R, et al. Spontaneous low frequency oscillations of cerebral hemodynamics and metabolism in human adults. Neuroimage. 2000;12(6):623-639.
5. Wise RG, Ide K, Poulin MJ, Tracey I. Resting fluctuations in arterial carbon dioxide induce significant low frequency variations in BOLD signal. Neuroimage. 2004;21(4):1652-1664.
6. Viessmann O, Scheffler K, Bianciardi M, Wald LL, Polimeni JR. Dependence of resting-state fMRI fluctuation amplitudes on cerebral cortical orientation relative to the direction of B0 and anatomical axes. Neuroimage. 2019;196:337-350.
7. Bernier M, Bilgic B, Bollmann S, Fultz NE, Polimeni JR. Multimodal quantitative arterial-venous segmentation of the human brain at 7T: structure, susceptibility and flow. ISMRM 2021, page 158.
8. Ogawa S, Menon RS, Tank DW, et al. Functional brain mapping by blood oxygenation level-dependent contrast magnetic resonance imaging. A comparison of signal characteristics with a biophysical model. Biophys J. 1993;64(3):803-812.
9. Zhang X, Petersen ET, Ghariq E, et al. In vivo blood T(1) measurements at 1.5 T, 3 T, and 7 T. Magn Reson Med. 2013;70(4):1082-1086.
10. Wright PJ, Mougin OE, Totman JJ, et al. Water proton T1 measurements in brain tissue at 7, 3, and 1.5 T using IR-EPI, IR-TSE, and MPRAGE: results and optimization. MAGMA. 2008;21(1-2):121-130.
11. UIudag K, Müller-Bierl B, Ugurbil K. An integrative model for neuronal activity-induced signal changes for gradient and spin echo functional imaging. Neuroimage. 2009;47:S56.
12. Zhong X, Chen J.J. The frequency dependence of the resting-state fMRI signal on macrovascular volume and orientation. ISMRM 2022. (Submitted)
Figures