4074
Biophysical modeling of abnormal BOLD responses in Cerebral Amyloid Angiopathy due to reduced arteriolar reactivity1Massachusetts General Hospital, Boston, MA, United States
Synopsis
A consistently slower and weaker blood-oxygenation-level-dependent (BOLD) fMRI response is consistently seen in patients with cerebral amyloid angiopathy (CAA).However, our mechanistic understanding of why this occurs in CAA is lacking. To improve our mechanistic understanding, we propose a hypothesis testing framework for simulating the relationship between of impaired microvascular function and the associated abnormal fMRI response. We use BOLD biophysical modeling to link microvascular dynamics with fMRI signals. Here we test whether reduced arteriolar reactivity predicts abnormal BOLD response in early- and late-stage CAA.
Introduction
BOLD fMRI measures neuronal activity indirectly by tracking the associated changes in blood flow and oxygenation1. We can thus investigate abnormal microvascular anatomy and physiology in disease by measuring impaired BOLD response to simple stimuli. This approach has been adopted to study cerebral amyloid angiopathy (CAA) where patients show reduced vascular reactivity in the visual cortex in response to a visual task2. Despite the sensitivity of fMRI to detect reduced vascular reactivity in CAA, our mechanistic understanding of the pathophysiology of CAA and other vascular diseases is currently limited by our inability to interpret the in vivo data.However, thanks to optical imaging-based measurements of the microvascular anatomy and dynamics3, realistic biophysical models have been developed that can predict fMRI response4. These models can link the microvascular response to measured fMRI responses. Motivated by this, we extend these computational models and apply them towards testing microvascular disease hypotheses to understand how abnormal fMRI responses observed in patients relate to the underlying microvascular dysfunction.
As a first step, we evaluate the effects of arteriolar dilation impairment on the BOLD signal. We attempt to simulate the abnormal BOLD responses in CAA; CAA is thought to affect microvascular reactivity but not baseline physiology or neuronal function or metabolism. We thus test whether delays in the coordination of the arteriolar response or a reduction in arteriolar elasticity manifests similar to abnormal CAA BOLD responses.
Methods
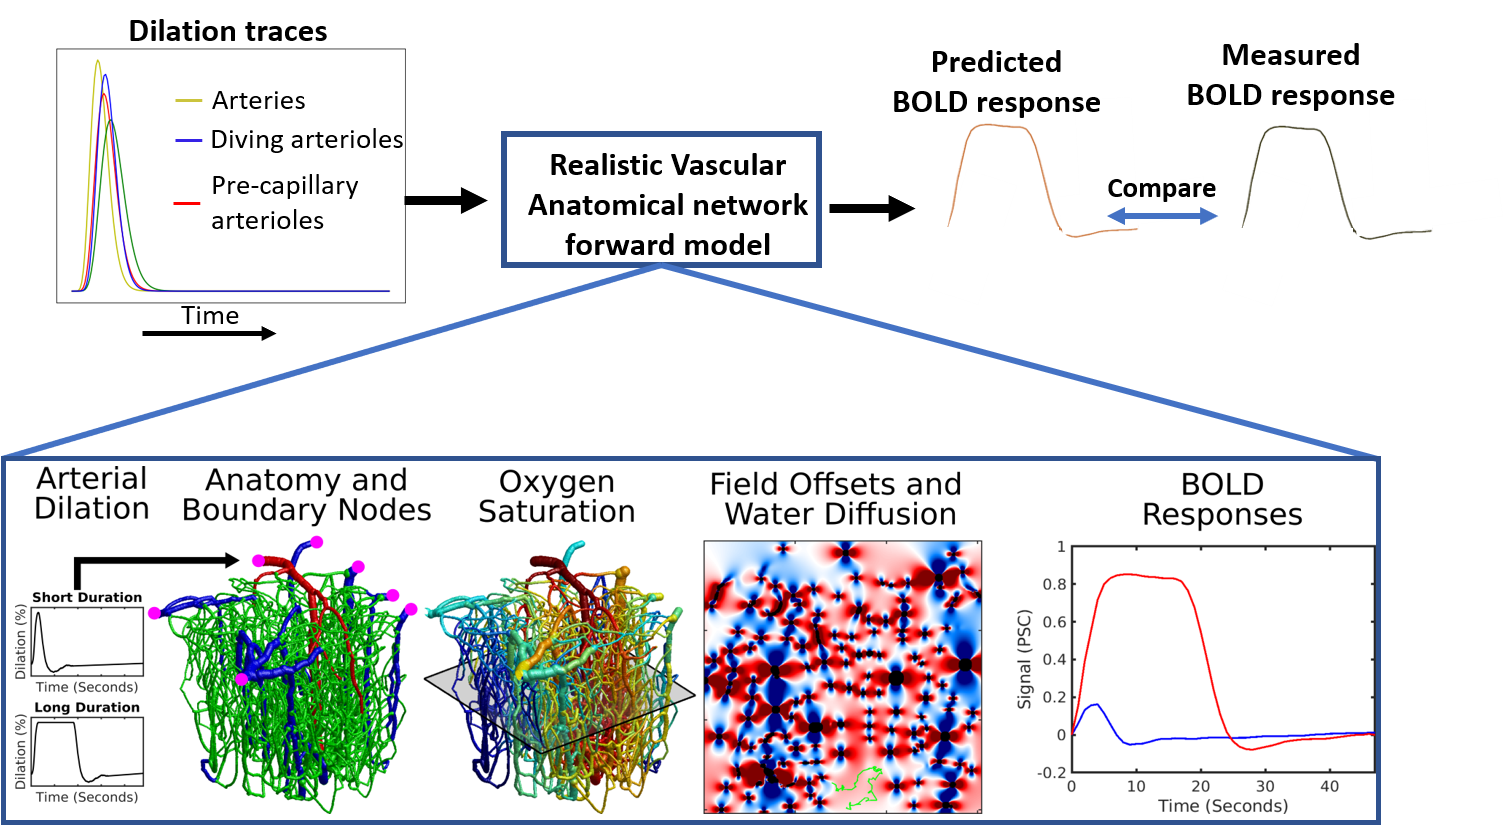
Figure 1 summarizes the proposed hypothesis testing framework. The vascular anatomical network (VAN) consists of a biophysical model for computing the dynamics of blood flow, volume, and oxygenation in a realistic microvascular network to predict the output BOLD response4. The model inputs consist of the dynamics of the arterial diameters that change alongside neural activity plus the boundary and initial conditions for the blood flow, pressure, oxygenation, and vessel diameters. The VAN model captures realistic BOLD dynamics using single-vessel arterial dilation traces recorded from mouse somatosensory cortex during activation.Extending the VAN model to vascular disease: Here we test whether the hypothesized reduced arteriolar reactivity in CAA predicts the observed abnormal BOLD responses. We tested to predict late-stage CAA BOLD, in which the BOLD response has been measured extensively, as well as early-stage CAA where it is believed that a subset of the arterioles may be impacted.
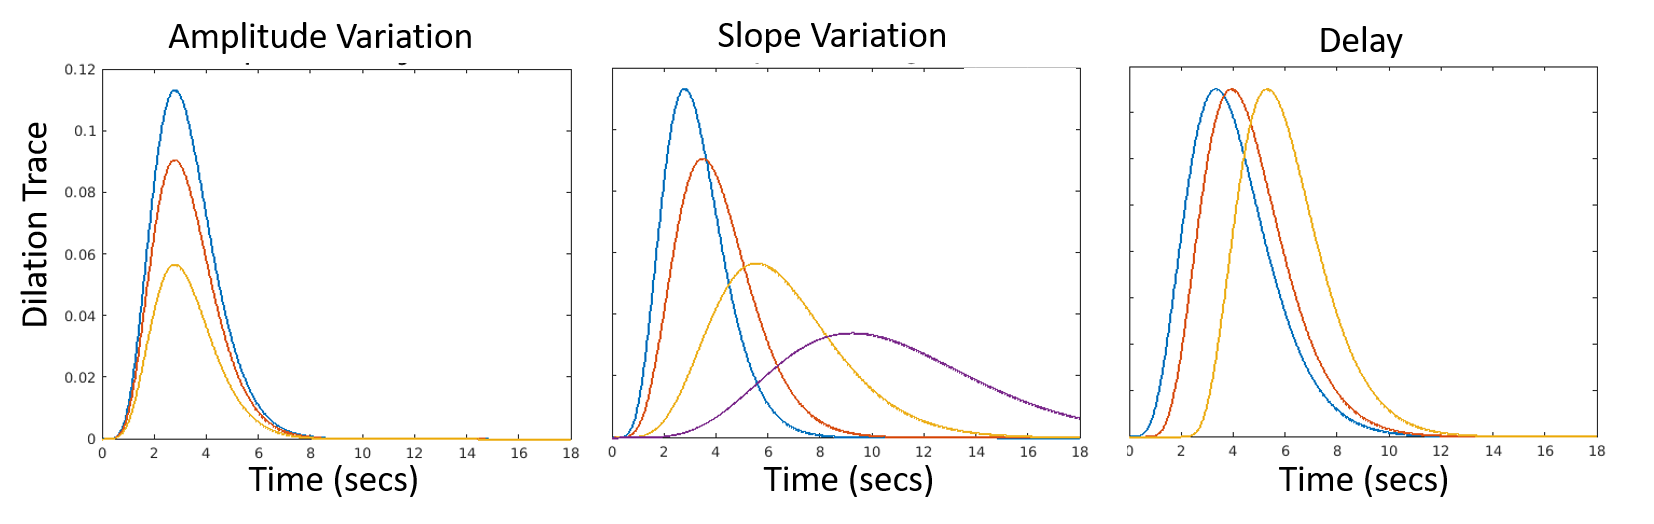
Arteriolar reactivity is varied by changing the amplitude and timing (i.e. slope and delay in onset of dilation) of the arteriolar dilation curves, as shown in Fig 2. These three parameters model the vascular elasticity, the vascular viscosity and the upstream vascular signaling along the endothelial cells.
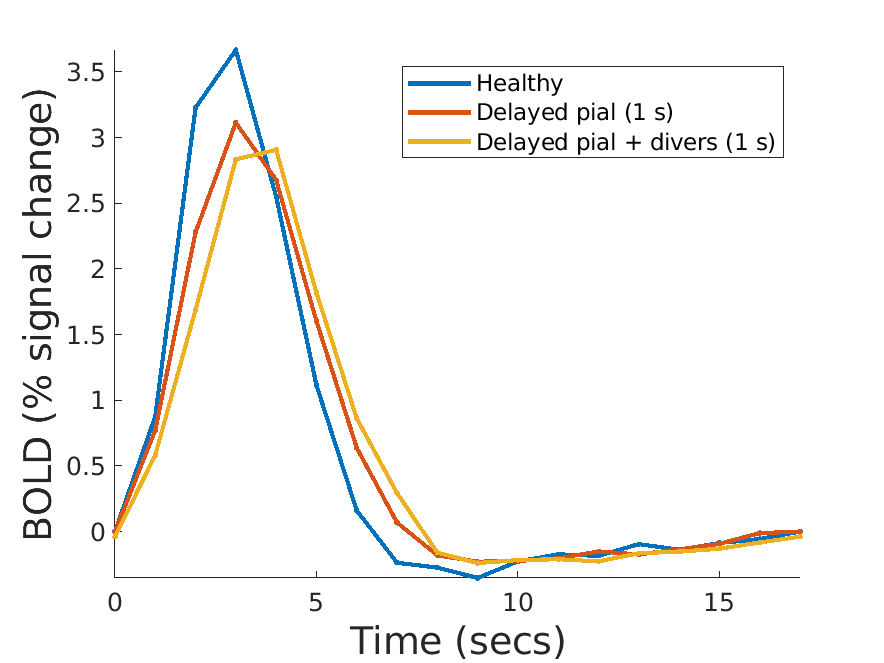
In late-stage CAA, we hypothesize that the model will predict slower and weaker BOLD responses. For early-stage, we simulated disease progression experiments by reducing the dilation amplitude and increasing the delay in vessels hierarchically. We affected the pial artery first, then the pial artery and the divers, and finally all vessels. We hypothesize that the amplitude and delay of the BOLD response will discriminate between the three progression levels.
We assumed a short 2 sec stimulus because of the availability of similarly stimulated CAA BOLD fMRI data and because then the BOLD may closely reflect the arterial response to neural activity5.
Results
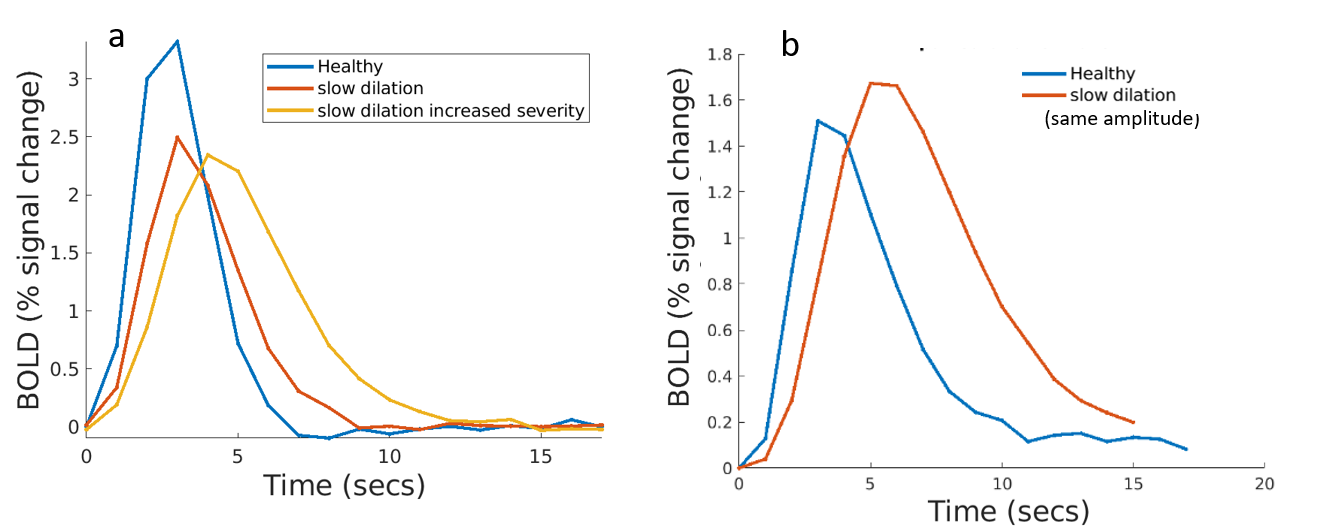
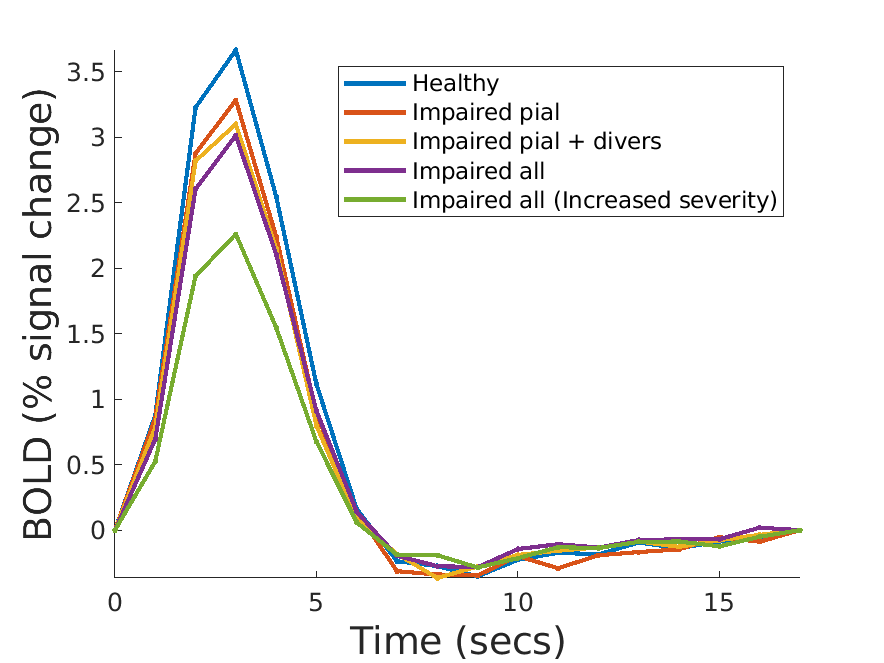
Fig 3a. shows the BOLD response when the dilation of all input arterioles was slowed. As expected, the BOLD response becomes slower and weaker. However, if we force the slow dilation to match that of healthy controls (Fig 3b.), the BOLD response exhibits a higher amplitude than the control case. This occurs because the volume of blood delivered is proportional to area under the dilation curve, and thus more blood is delivered compared to the control case. Since this example is unrealistic, we expect any slowness in dilation will likely be accompanied by a decreased dilation amplitude, and both aspects will show up in the BOLD response.Fig. 4a. shows how the amplitude of the BOLD response decreases with reduced dilation amplitude and worsens with increasing severity. The pial artery decreases the amplitude by 10%, an additional 5% with divers, and an additional 2% with precapillaries.
Fig. 5a. shows the BOLD responses analyzing vascular signaling delay. However, when a subset of vessels is delayed then there is a mismatch in timing between the different levels of the arterial hierarchy (i.e., feeding pial arteries, diving and precapillary arterioles), resulting in less effective blood flow leading to a reduced BOLD response amplitude.
Note that the red and blue cases in Figs. 4a and 2a are not discriminable because both signaling delays and slower dilation result in slower and weaker BOLD responses. However, considering that the time required for the coordinated vascular response and upstream propagation of dilation is on the order of hundreds of milliseconds, whether impaired vascular signaling can be responsible for such large changes in the BOLD response dynamics is not clear.
Discussion
The proposed framework extends the use of VANs to study vascular disease. We demonstrated that increased viscosity results in a slow and weak BOLD response observed in CAA. This analysis indicates that viscosity could be a potential biomarker for CAA and needs more exploration. Future applications include probing other similar vascular diseases.Acknowledgements
This work was supported in part by the NIH NIBIB (grants P41-EB030006 and R01-EB019437), by the BRAIN Initiative (NIH NIMH grant R01-MH111419 and NINDS U19-NS123717), and by the MGH/HST Athinoula A. Martinos Center for Biomedical Imaging. We gratefully acknowledge Drs. David Boas and Louis Gagnon for providing us with the VAN modeling framework.References
[1] Dynamic magnetic resonance imaging of human brain activity during primary sensory stimulation. K K Kwong, J W Belliveau, D A Chesler, I E Goldberg, R M Weisskoff, B P Poncelet, D N Kennedy, B E Hoppel, M S Cohen, R Turner, Proceedings of the National Academy of Sciences Jun 1992, 89 (12) 5675-5679; DOI: 10.1073/pnas.89.12.5675
[2] Dumas A, Dierksen GA, Gurol ME, Halpin A, Martinez-Ramirez S, Schwab K, Rosand J, Viswanathan A, Salat DH, Polimeni JR, Greenberg SM. Functional magnetic resonance imaging detection of vascular reactivity in cerebral amyloid angiopathy. Ann Neurol. 2012 Jul;72(1):76-81. doi: 10.1002/ana.23566. PMID: 22829269; PMCID: PMC3408630.
[3] Hillman, E. M. C., Devor, A., Bouchard, M. B., Dunn, A. K., Krauss, G. W., Skoch, J., Bacskai, B. J., Dale, A. M. & Boas, D. A. Depth-resolved optical imaging and microscopy of vascular compartment dynamics during somatosensory stimulation. Neuroimage 35, 89–104 (2007).
[4] Gagnon, L., Sakadžić, S., Lesage, F., Musacchia, J. J., Lefebvre, X., Fang, Q., Yücel, M. A., Evans, K. C., Mandeville, E. T., Cohen-Adad, J., Polimeni, J. R., Yaseen, M. A., Lo, E. H., Greve, D. N., Buxton, R. B., Dale, A. M., Devor, A. & Boas, D. A. Quantifying the microvascular origin of BOLD-fMRI from first principles with two-photon microscopy and an oxygen-sensitive nanoprobe. J. Neurosci. 35, 8, 3663–3675 (2015).
[5] Polimeni JR, Lewis LD. Imaging faster neural dynamics with fast fMRI: a need for updated models of the hemodynamic response. Prog Neurobiol. 2021
Figures