4073
Comparison of Single- and Dual-R2* Relaxivity and Estimation of Fat Fraction Using Steatosis Modeling and Monte Carlo Simulations1Biomedical Engineering, The University of Memphis, Memphis, TN, United States, 2Department of Medicine, North Shore University Hospital/Northwell Health, Manhasset, NY, United States, 3College of Medicine, University of Tennessee Health Science Center, Memphis, TN, United States, 4St. Jude Children’s Research Hospital, Memphis, TN, United States
Synopsis
MRI multi-spectral fat-water models assuming single or independent R2* for fat (R2*F) and water (R2*F) are non-invasive fat fraction (FF) quantification techniques, but there is no consensus on which is more accurate. Monte Carlo simulations allowed correlation of single R2*, R2*F, and R2*W with FF and assessment of the R2* models. MRI signal was synthesized by creating a virtual hepatic steatosis model from extracted characteristics of fat droplets (FD) obtained using histology. R2*W and single R2* were within the confidence bound of the in-vivo calibration and both R2* models predicted FF with high accuracy which confirms the suitability of Monte-Carlo model to mimic steatosis condition.
Introduction
There has been debate whether multi-spectral fat-water models that assume independent fat (R2*F) and water (R2*W) relaxivity(dual-R2*) better quantify FF compared to single R2* where fat and water relaxivity are assumed same. Most of the studies use single R2* for simplicity1,2 whereas other studies suggest dual-R2* is more accurate.3 However, assessing both models on a patient population would not be feasible. Previous work presented Monte Carlo simulation as a feasible alternative to compare the fat fraction (FF) and R2* quantification accuracy of single and dual R2* model.3 The purpose of this study is to extend the previous study to cover the entire clinical range of FF and implement fully what used to be a proof-of-concept study, which involved morphologically characterizing hepatic histology data and estimating single R2*, R2*W, and R2*F to account for its confounding effect and predict FF.Methods
Fat morphology was characterized from a cohort of 68 human subjects’ biopsy one year post liver transplantation.4 Fat droplets (FDs) were automatically segmented with a morphological discrimination and a marker-controlled watershed algorithm. Characteristics comprised of FD radius, nearest neighbor (NN) distance and regional anisotropy. Gamma distribution function (GDF) was selected to statistically represent the relationship between FF and the properties of FDs. To find the association between the parameters of GDF and FF, regression analysis was used. These relationships were used to create a 240X240X120 µm3 virtual liver volume mimicking steatosis with different FFs. Monte Carlo simulations synthesized MRI signal in the generated volume, similar to the one described in a previous study.3 MRI signals were synthesized for different FFs ranging from 0% to 50% with echo times (TE): 1, 1.5, 2, …, 14.5ms and ΔTE=0.5ms at 1.5T and 3T. Single R2* and dual R2* was estimated using fat water toolbox (FWT)5 and autoregressive moving average (ARMA)6 respectively along with FF. The relationship between R2*W from ARMA and single R2* from FWT was compared with in-vivo calibration.7 ANOVA analysis was used to compare the slope of these relationships, and linear regression was used to compare the estimated FF with true FF.Results & Discussion
In our study cohort, the FF measured ranged from 0.04% to 71.9%. Figure 1 shows a generated liver volume with 25% FF along with its corresponding 2D 5 µm thick slice and compares it with a true histological image. 2D simulation FD placement and size was consistent with histological slides at 20X magnification, per visual inspection of a representative case with a 25% FF estimated by the segmentation-characterization algorithm. R2* and R2*W related to FF are presented in Figure 2. Both single R2* and R2*W increased linearly with increasing FF, and the slope of both the R2* models were not statistically different from the in-vivo calibration (p=0.320 for 1.5T, p=0.705 for 3T, α=0.05) as shown in Figure 2. R2*F at 1.5T and 3T show moderate correlation with FF with R2=0.54 and R2=0.57, respectively (Figure 3) which is in agreement with previous published result.3 Figure 4 demonstrates the comparison between model predicted FF and true FF showing high accuracy of both the R2* models with slopes close to unity and intercepts close to zero.Most results were in agreement with a previous study validating the feasibility of the framework based on histology derived morphological and statistical descriptors and Monte-Carlo simulation.3 Even for higher FF, there was no clear difference between the R2* models for estimating R2* and FF which might be because the in-vivo calibration was based on single R2*. Also, we used ARMA model to predict dual R2*. However, FWT can be modified to estimate both the single and dual R2* which will allow us to compare the performance of single and dual R2* directly from the same model, removing the bias of different models.Conclusion
The study demonstrated the practicality of generating virtual models by extracting morphological descriptors from histology images and synthesizing MRI signal that produces expected signal decays in the condition of steatosis. Our results show that both the single and dual R2* models can be used to quantify R2* and FF with acceptable accuracy at both field strengths for steatosis. Future work would address the above mentioned limitations by modeling dual R2* with a modification of FWT and also incorporating the in-vivo dual R2* values.Acknowledgements
Research funded by National Institute of Health grant # 1R21EB031298.
References
1. Meisamy S, Hines CDG, Hamilton G, et al. Quantification of Hepatic Steatosis with T1-independent, T2*-corrected MR Imaging with Spectral Modeling of Fat: Blinded Comparison with MR Spectroscopy. Radiology. 2011;258(3):767-775. doi:10.1148/radiol.10100708
2. Yu H, McKenzie CA, Shimakawa A, et al. Multiecho reconstruction for simultaneous water-fat decomposition and T2* estimation. J Magn Reson Imaging. 2007;26(4):1153-1161. doi:10.1002/jmri.21090
3. Shrestha U, van der Merwe M, Kumar N, et al. Morphological characterization of hepatic steatosis and Monte Carlo modeling of MRI signal for accurate quantification of fat fraction and relaxivity. NMR Biomed. 2021;34(6):e4489. doi:10.1002/nbm.4489
4. Satapathy SK, Tran QT, Kovalic AJ, et al. Clinical and Genetic Risk Factors of Recurrent Nonalcoholic Fatty Liver Disease After Liver Transplantation. Clin. Transl. Gastroenterol. 2021;12(2):e00302. doi:10.14309/ctg.0000000000000302
5. Hamilton G, Yokoo T, Bydder M, et al. In vivo characterization of the liver fat 1H MR spectrum. NMR in Biomed. 2011;24(7):784-790. doi:10.1002/nbm.1622
6. Tipirneni-Sajja A, Krafft AJ, Loeffler RB, et al. Autoregressive moving average modeling for hepatic iron quantification in the presence of fat. J Magn Reson Imaging. 2019;50(5):1620-1632. doi:10.1002/jmri.26682
7. Bashir MR, Wolfson T, Gamst AC, et al. Hepatic R2* is more strongly associated with proton density fat fraction than histologic liver iron scores in patients with nonalcoholic fatty liver disease. J Magn Reson Imaging. 2019;49(5):1456-1466. doi:10.1002/jmri.26312
Figures
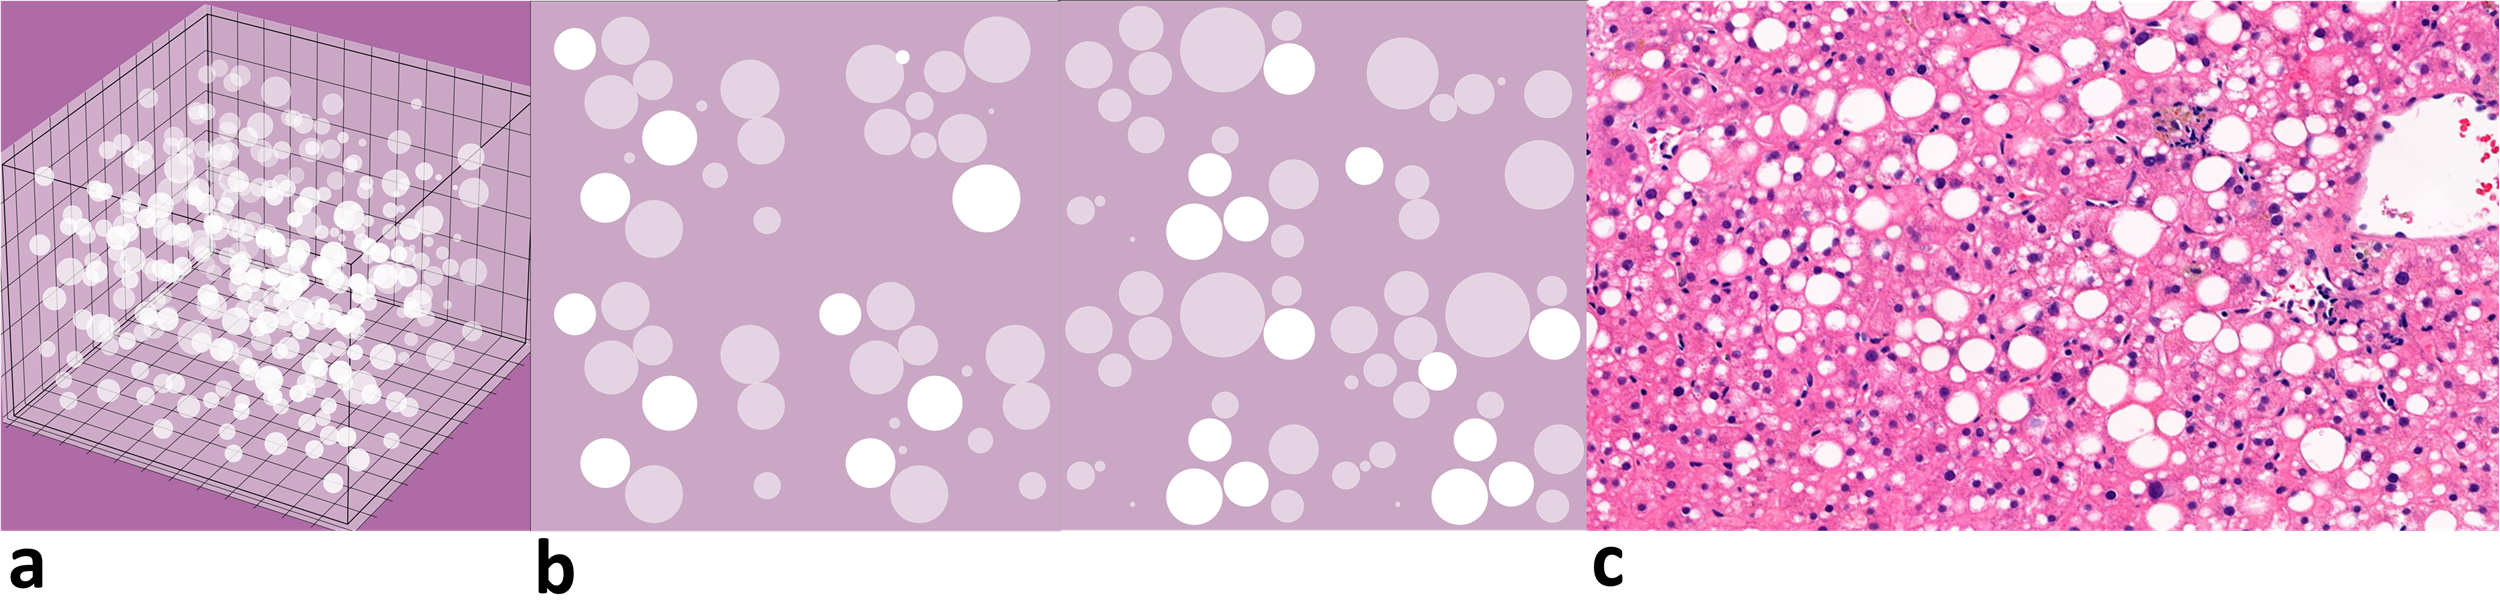
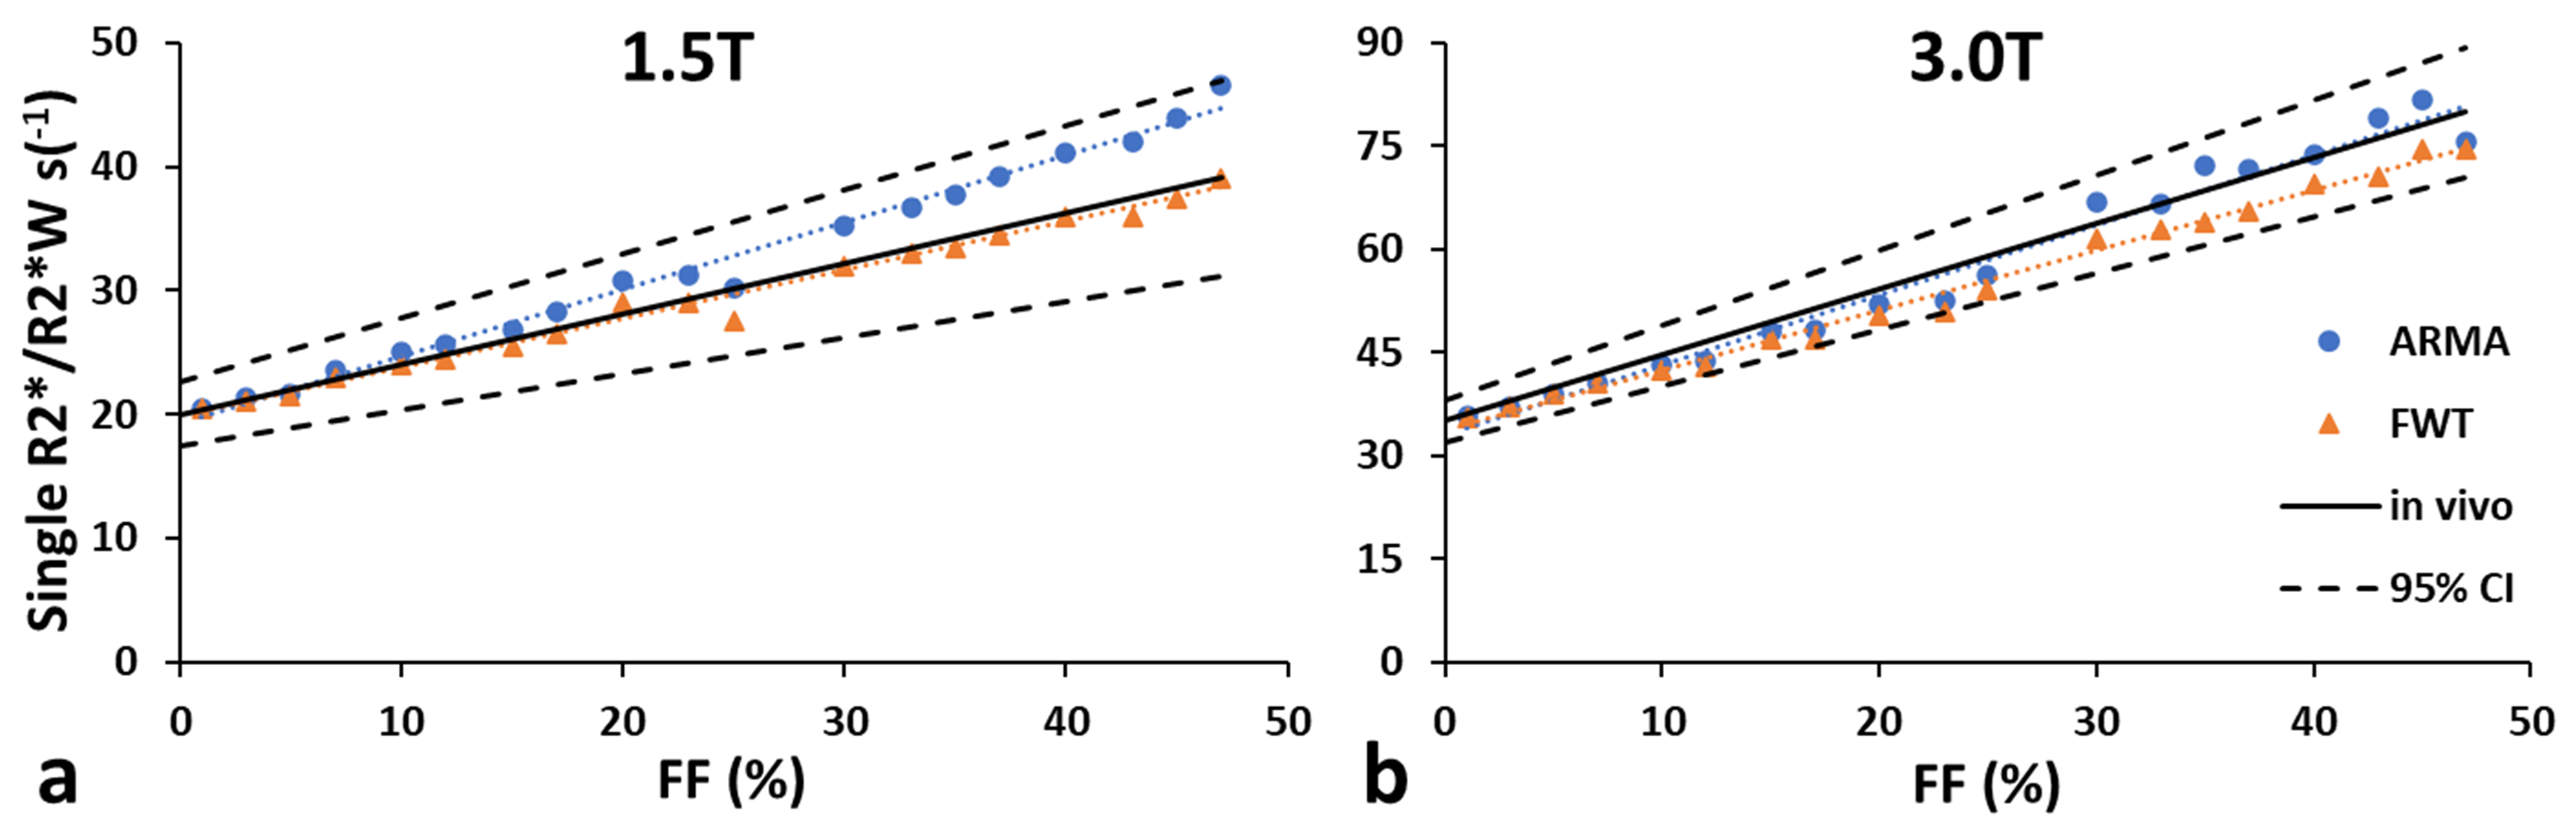
Figure 2. Comparison of model predicted single R2*- or water R2*(R2*W)-FF relationship with in vivo calibration at 1.5T (a) and 3T (b) for FF ranging from 0% to 50%. The solid black lines represent in-vivo R2*-FF calibration and the dotted black line represents its confidence bounds.
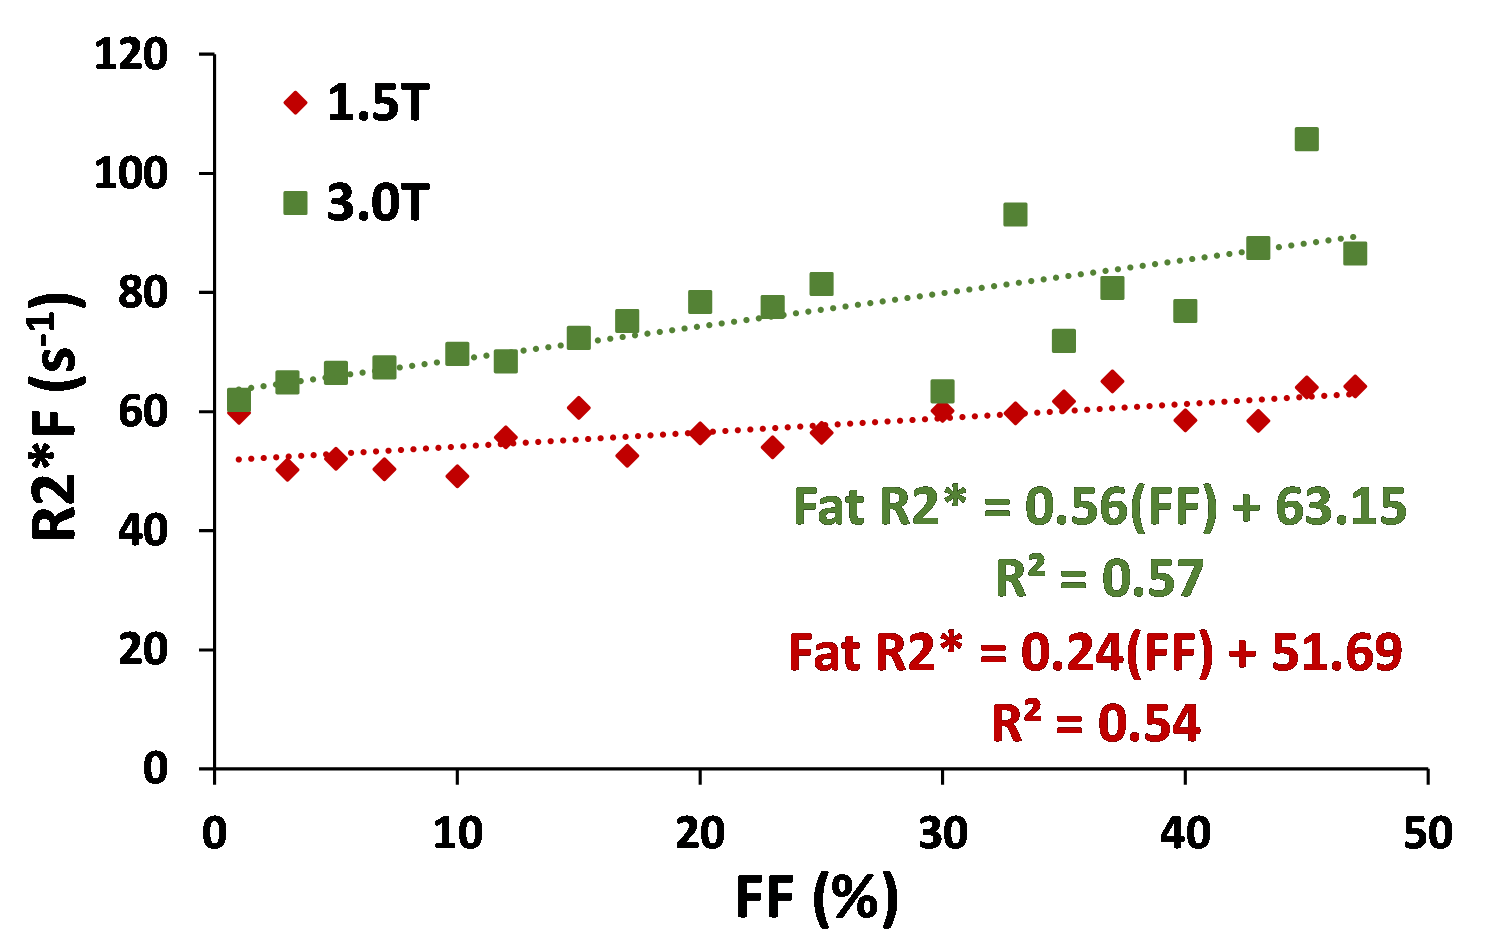
Figure 3. Fat relaxivity from dual-R2* model related to FF at 1.5T and 3T. The R2*F showed moderate correlation with FF.
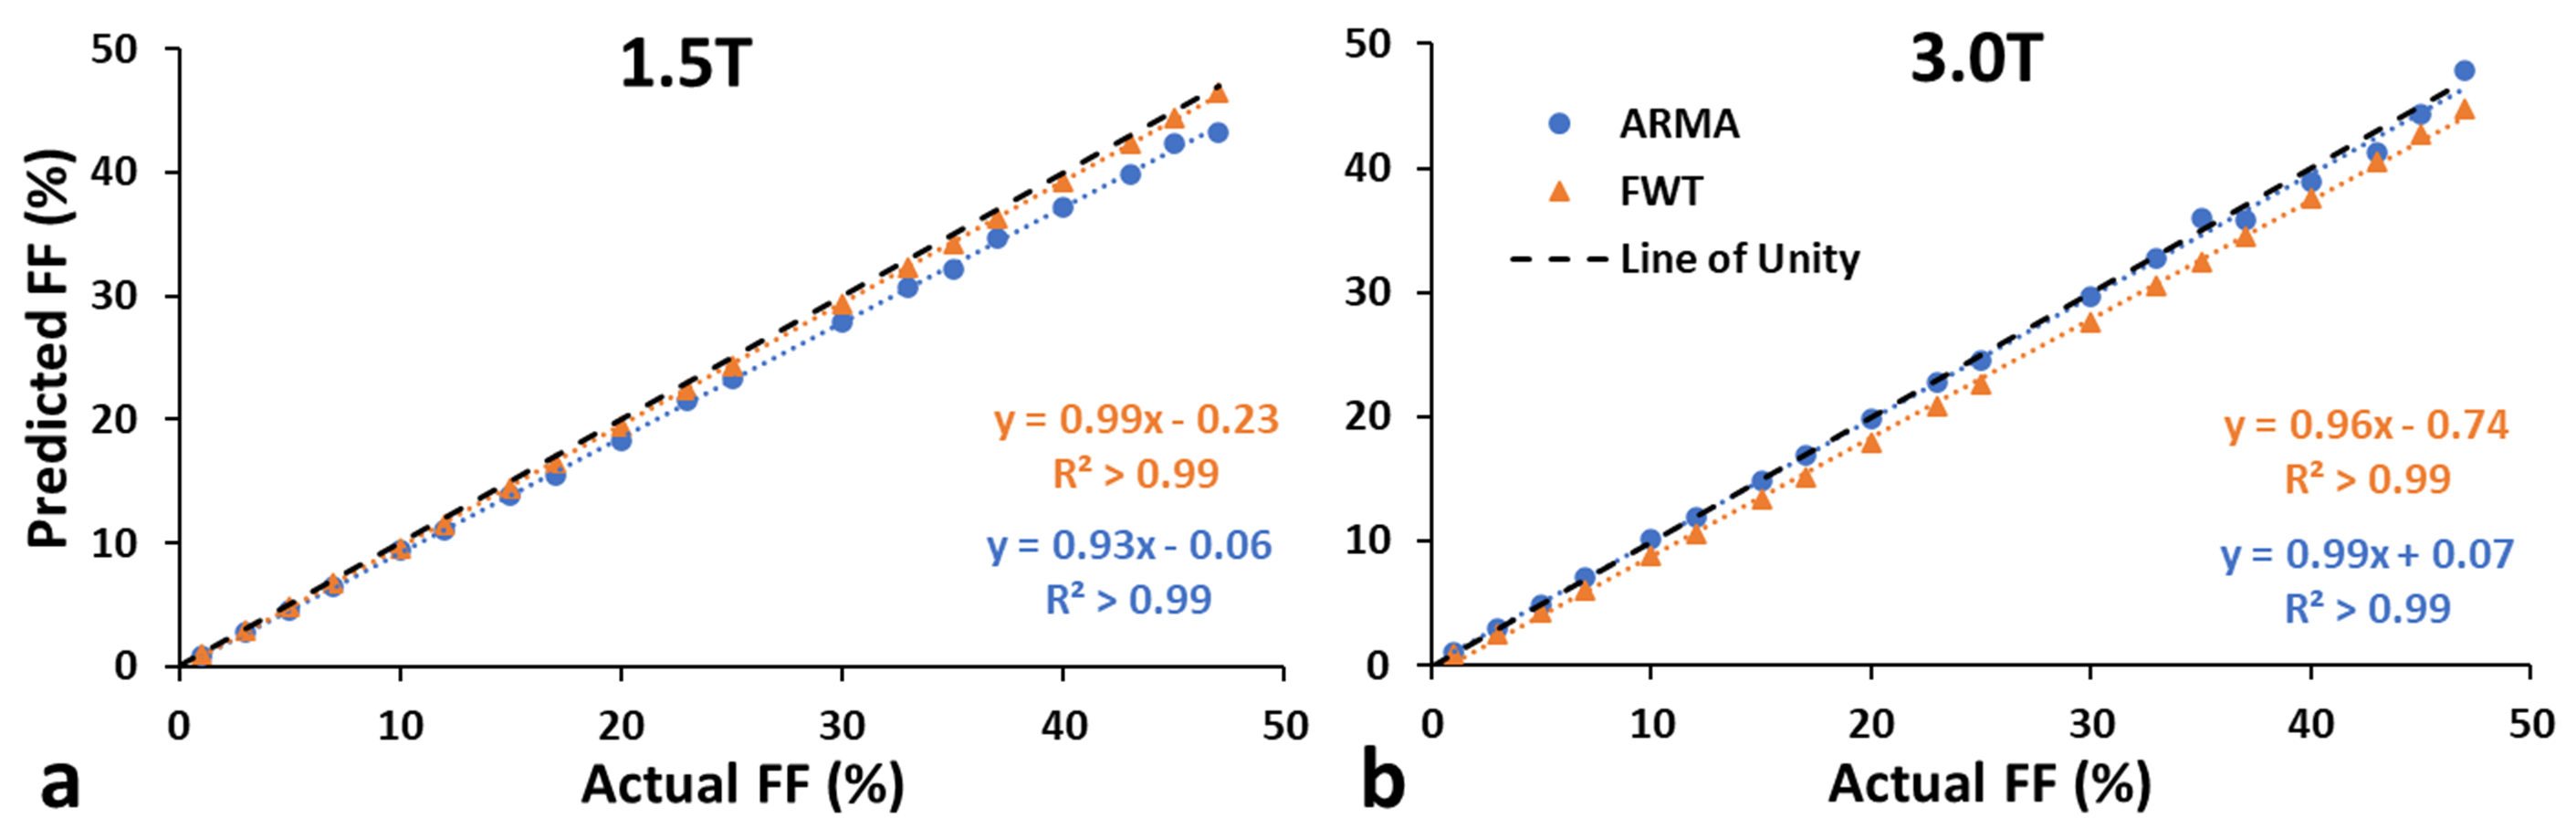
Figure 4. Predicted FF from single R2* and dual R2* at 1.5T (a) and 3T (b) compared to simulated FF. The dotted line indicates the line of unity. The predicted FF values were close to the line of unity with slope ~ 1and intercept ~ 0.