4071
Forecasting glioblastoma response to anti-angiogenic therapy via image-driven mathematical models1Aerospace Engineering, The University of Texas at Austin, Austin, TX, United States, 2Oden Institute for Computational Engineering and Sciences, The University of Texas at Austin, Austin, TX, United States, 3Livestrong Cancer Institutes, The University of Texas at Austin, Austin, TX, United States, 4Biomedical Engineering, The University of Texas at Austin, Austin, TX, United States, 5Diagnostic Medicine, The University of Texas at Austin, Austin, TX, United States, 6Oncology, The University of Texas at Austin, Austin, TX, United States, 7Imaging Physics, MD Anderson Cancer Center, Houston, TX, United States
Synopsis
A fundamental challenge in the care of patients with recurrent high-grade gliomas is the selection of appropriate salvage therapies to control further disease progression. To address this challenge, we have developed a biology-based mathematical model of tumor growth and response initialized and calibrated from patient-specific MRI data to predict which patients will respond to anti-angiogenic therapy. We evaluated the predictive accuracy of this image-driven modeling framework in an initial cohort of four patients. The model accurately predicted future total tumor cell number with an average error of 15%.
Introduction
Glioblastoma is a highly invasive and aggressive form of cancer occurring in the brain and spinal cord that is treated with a three-fold approach consisting of surgical resection followed by combined chemo- and radiotherapy. Even with this multi-treatment approach, disease progression often occurs within 10-12 months and requires additional treatment to improve patient prognosis and quality of life. A fundamental challenge in the care of patients with recurrent high-grade gliomas is the selection of appropriate salvage therapies to control further disease progression. Anti-angiogenic treatments are typically prescribed to patients with recurrent glioblastoma and can improve outcomes in a subpopulation of patients. Thus, an outstanding challenge is the identification of patients that may be responsive and benefit from anti-angiogenic treatments. Standard radiographic measurements of tumor morphology are insufficient in identifying patients that may respond to anti-angiogenic treatments. Recently, quantitative imaging data that report on intratumor cell density and vascularity has shown promise for identifying patients that may benefit from anti-angiogenic treatments [1]. Combining these quantitative imaging data with a biology-based mathematical model [2] of tumor growth and response could enable patient-specific prediction of response to anti-angiogenic therapies and the selection of appropriate treatment regimens for individual patients. Towards this end, we developed and investigated the predictive accuracy of an image-driven model of tumor growth and response that is personalized for each individual patient to predict response to bevacizumab.Methods
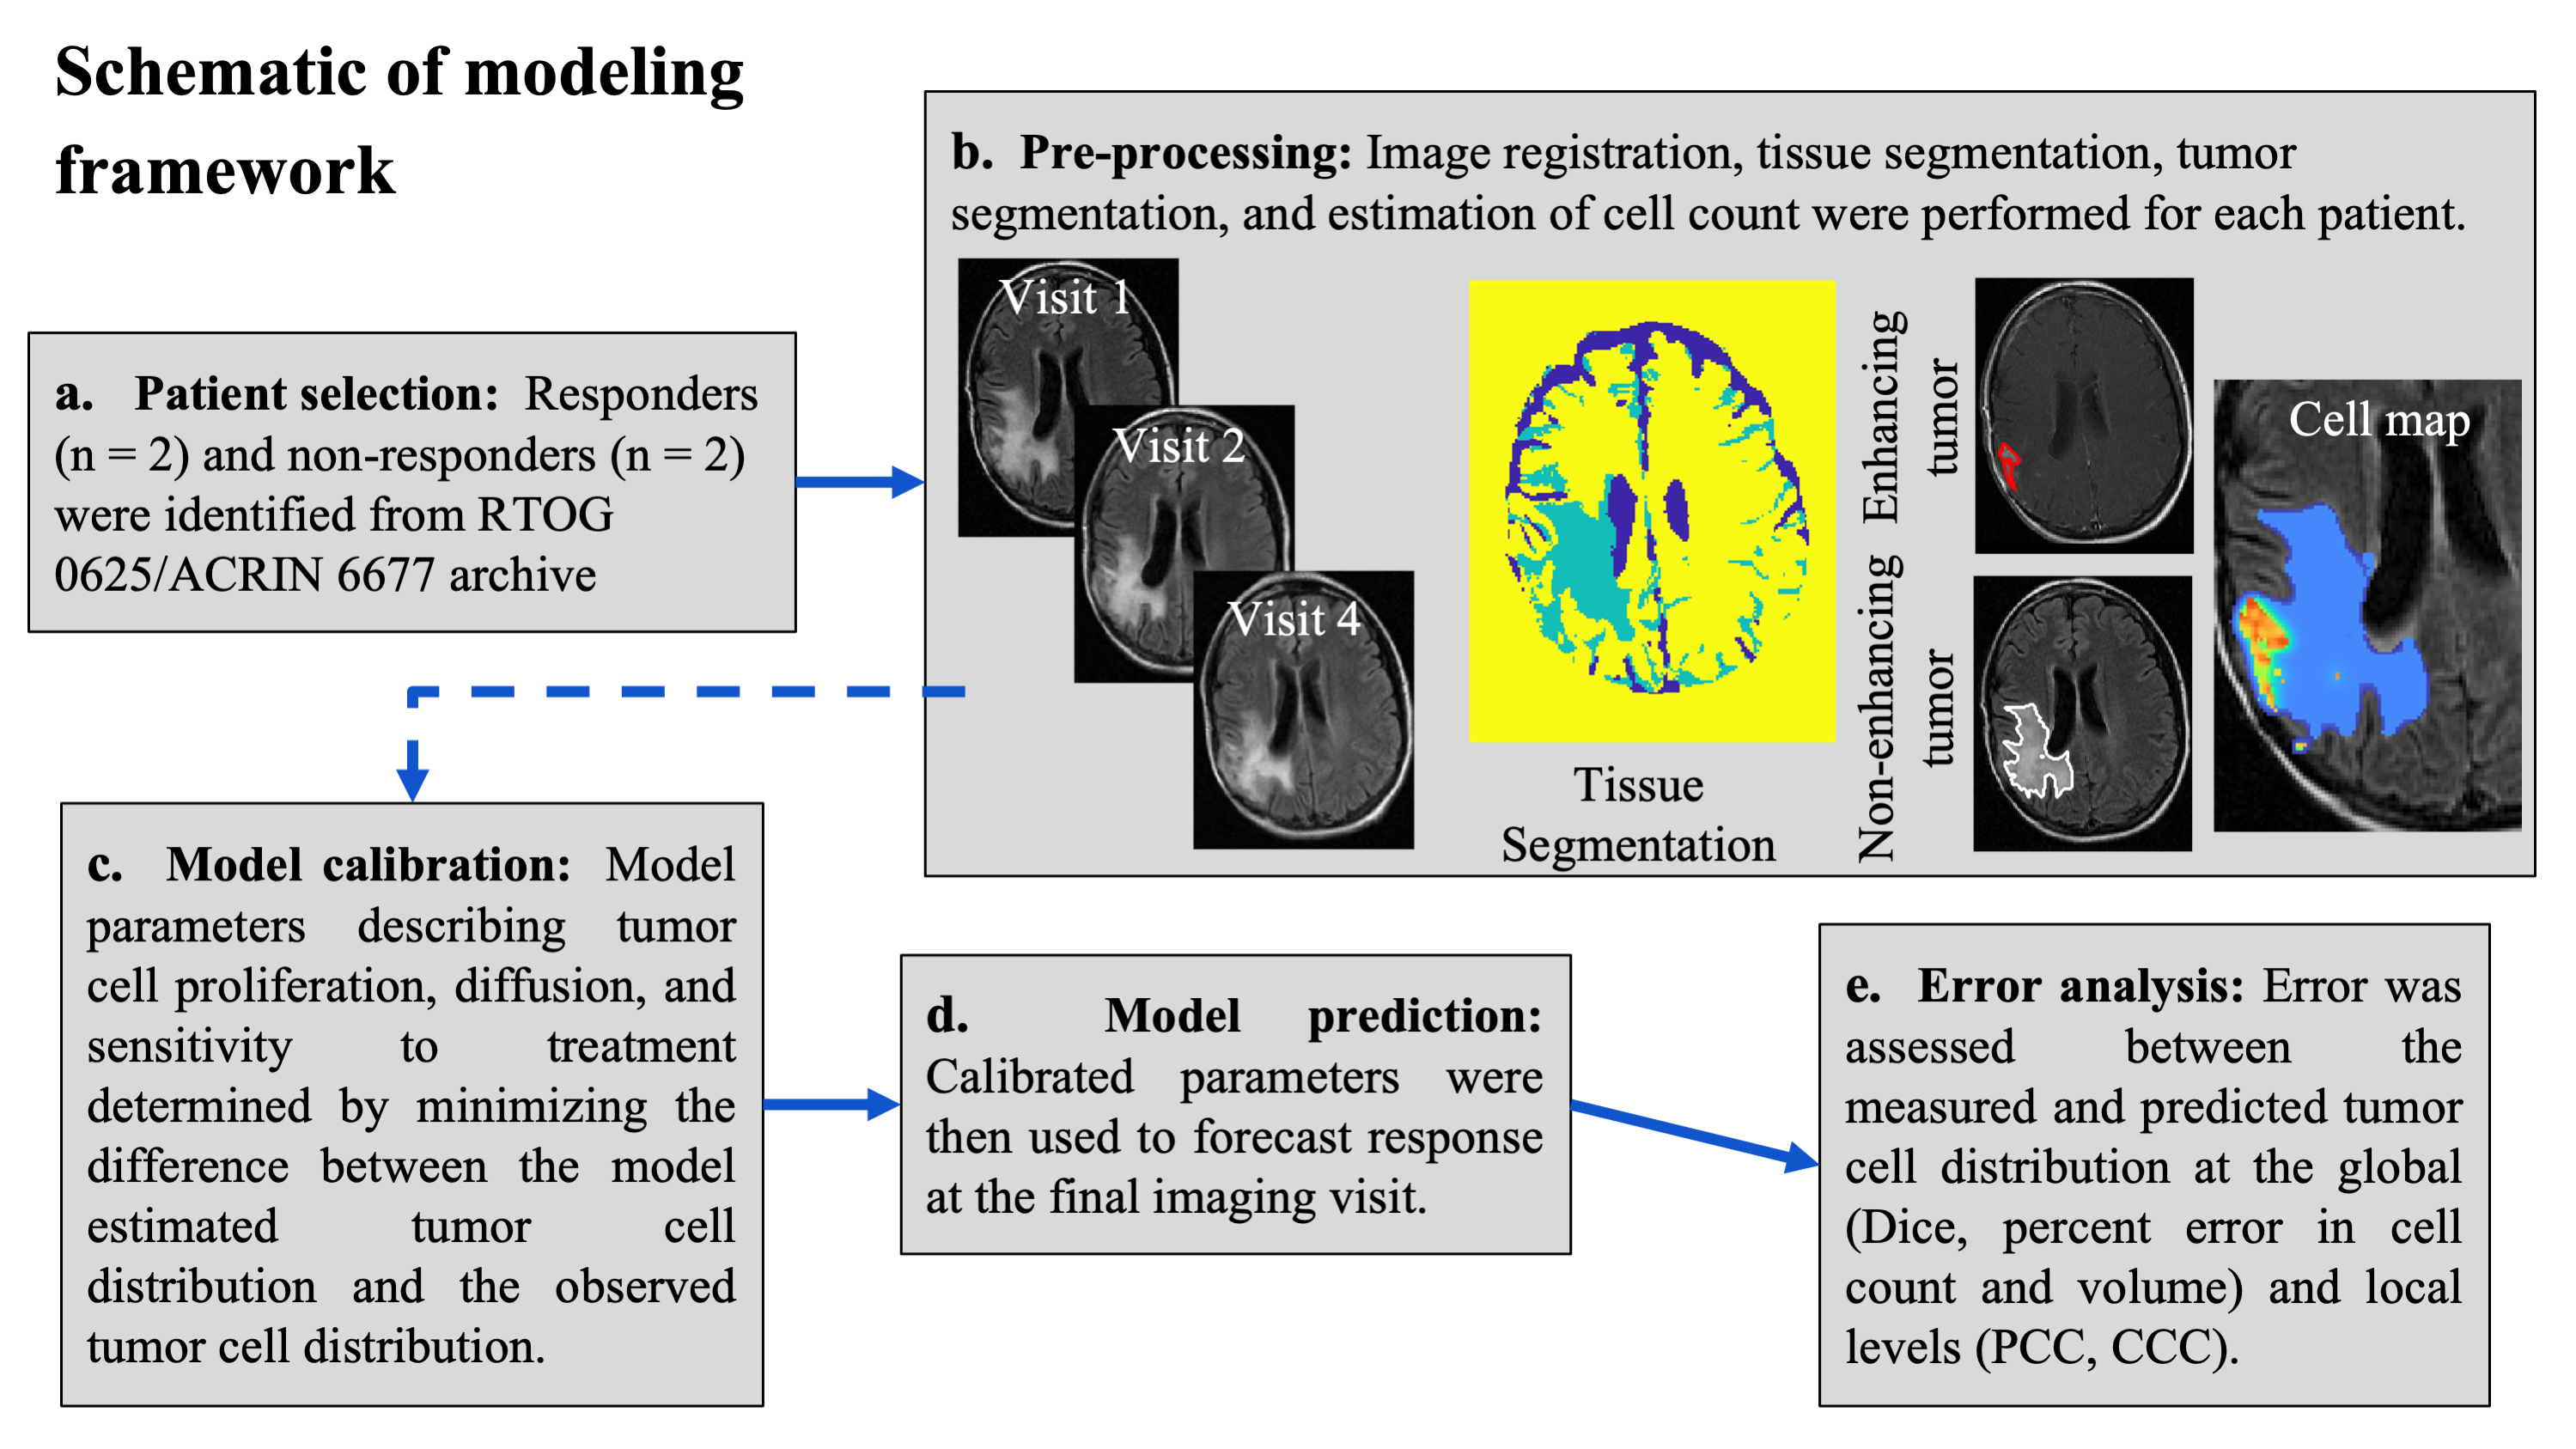
Quantitative imaging data from four patients with recurring high-grade gliomas was acquired from RTOG 0625/ACRIN 6677 via the Cancer Imaging Archive [3]. Our initial cohort consisted of two non-responders and two responders to anti-angiogenic treatment (Figure 1a). Patients were imaged up to 12 times during a two-year period with post-contrast T1-weighted magnetic resonance imaging (MRI), T2-fluid attenuated inversion recovery (FLAIR) MRI and diffusion weighted (DW-) MRI. All images were registered to the baseline imaging visit and white and gray matter was segmented from the T2-FLAIR image (Figure 1b). The enhancing and non-enhancing tumor burden were segmented at each imaging visit using the post-contrast T1 and T2-FLAIR images, respectively, via a semi-automated approach (Figure 1b). At each imaging visit, DW-MRI was employed to estimate tumor cell count within the enhancing tumor region. We used the longitudinal patient-specific tumor cell maps to initialize and calibrate (or personalize) a two-species model of tumor growth and response to bevacizumab (Figure 1c). The two-species model [2] describes the spatial-temporal evolution of the enhancing and the non-enhancing tumor due to tumor cell diffusion, proliferation, competition between species, and the surviving fraction of cells to a single dose of bevacizumab. The delivery of bevacizumab was assumed to be proportional to the contrast enhancement ratio while the half-life in brain was assigned from literature estimates. We investigated two-variations of the model: one where tumor cell proliferation was assumed to be a property of the entire tumor (i.e., a global proliferation rate), and another where the proliferation rate was assigned region-wise withing the tumor (i.e., a local proliferation rate). Model parameters were calibrated using data collected up to the fourth imaging visit using the Levenberg-Marquardt method in MATLAB to minimize the error between the model and the measured tumor cell count. The calibrated model parameters were then used to predict future tumor cell distribution at the remaining imaging visits (Figure 1d). The error between the model prediction and the experimental measurement was assessed at the global level (percent error in tumor cell count, percent error in tumor volume, Dice correlation coefficient) and local level (Pearson correlation coefficient or PCC, and concordance correlation coefficient or CCC) (Figure 1e).Results
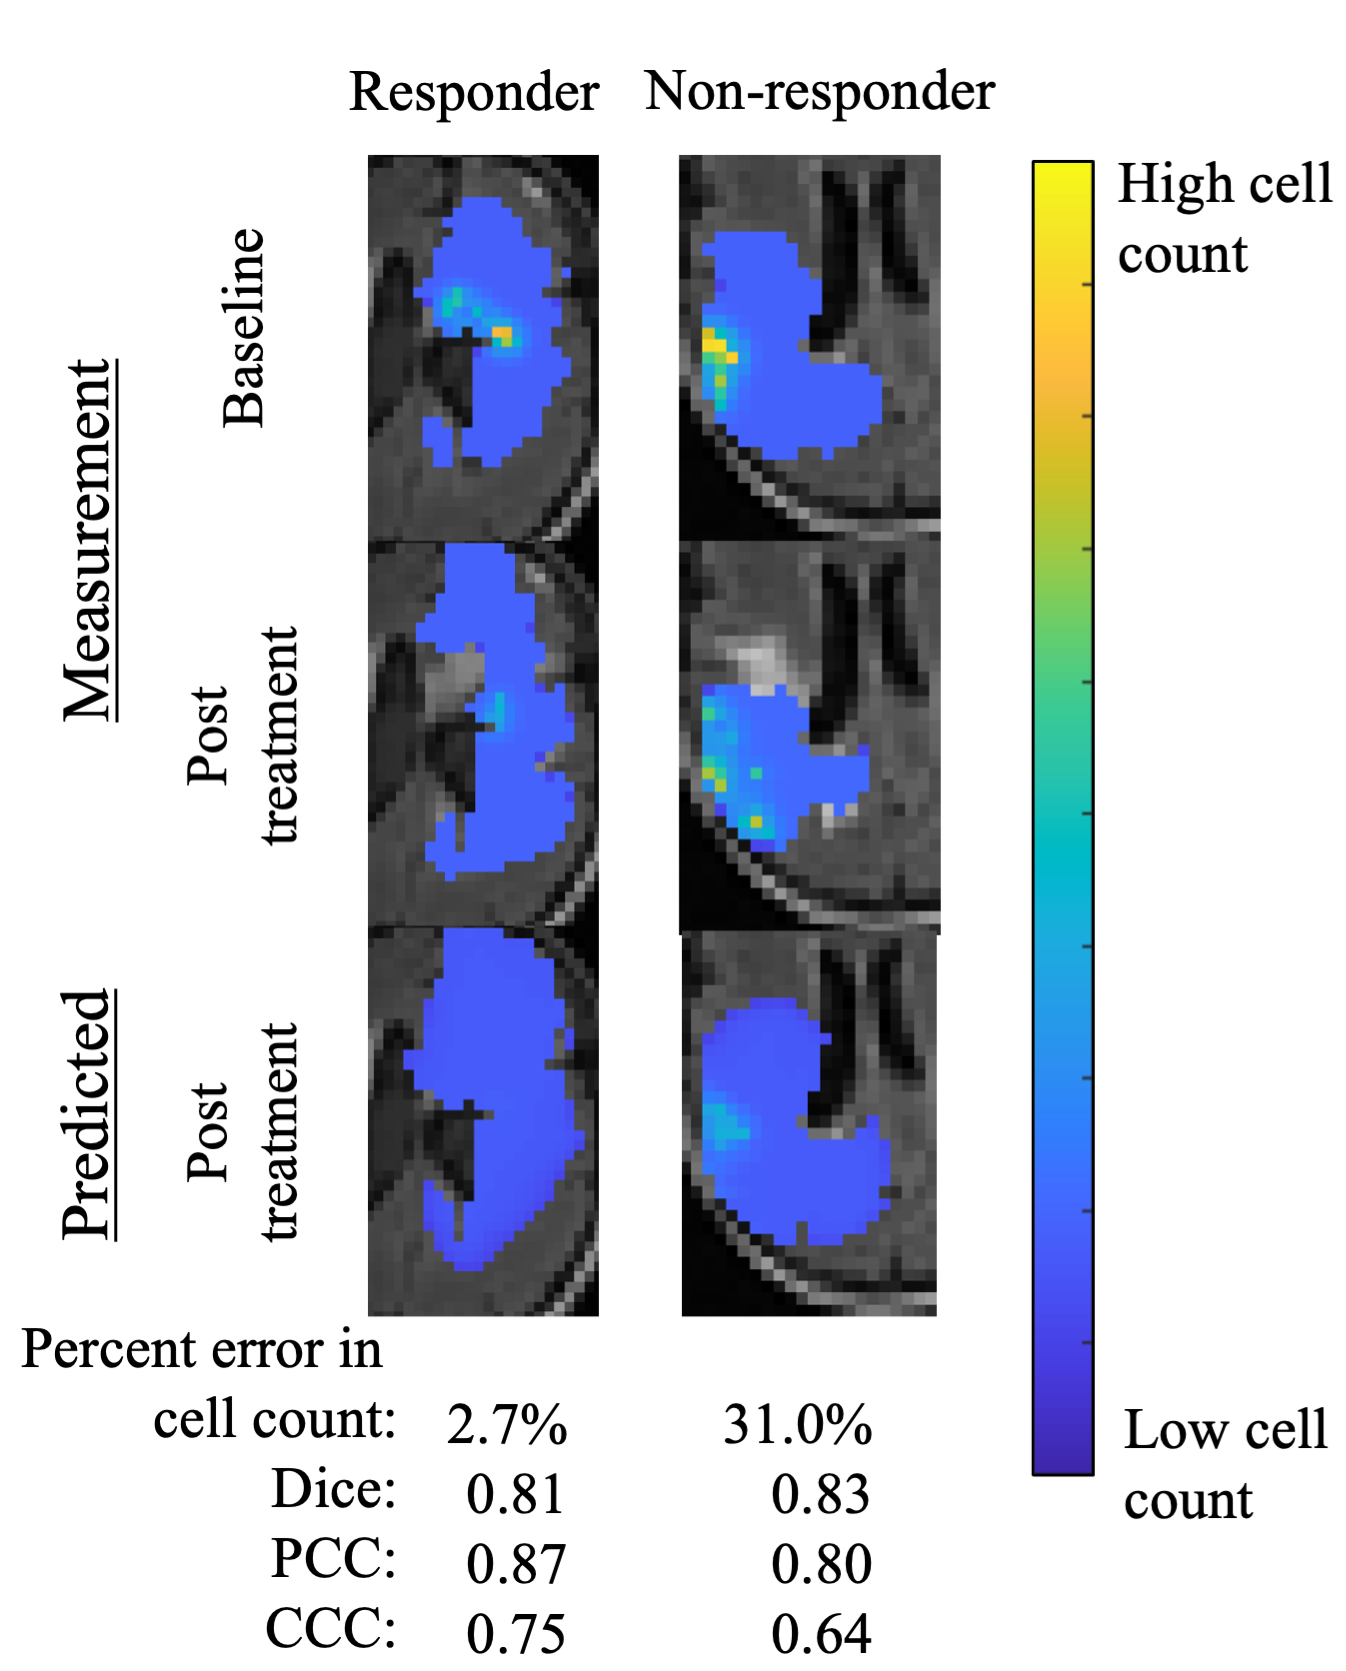
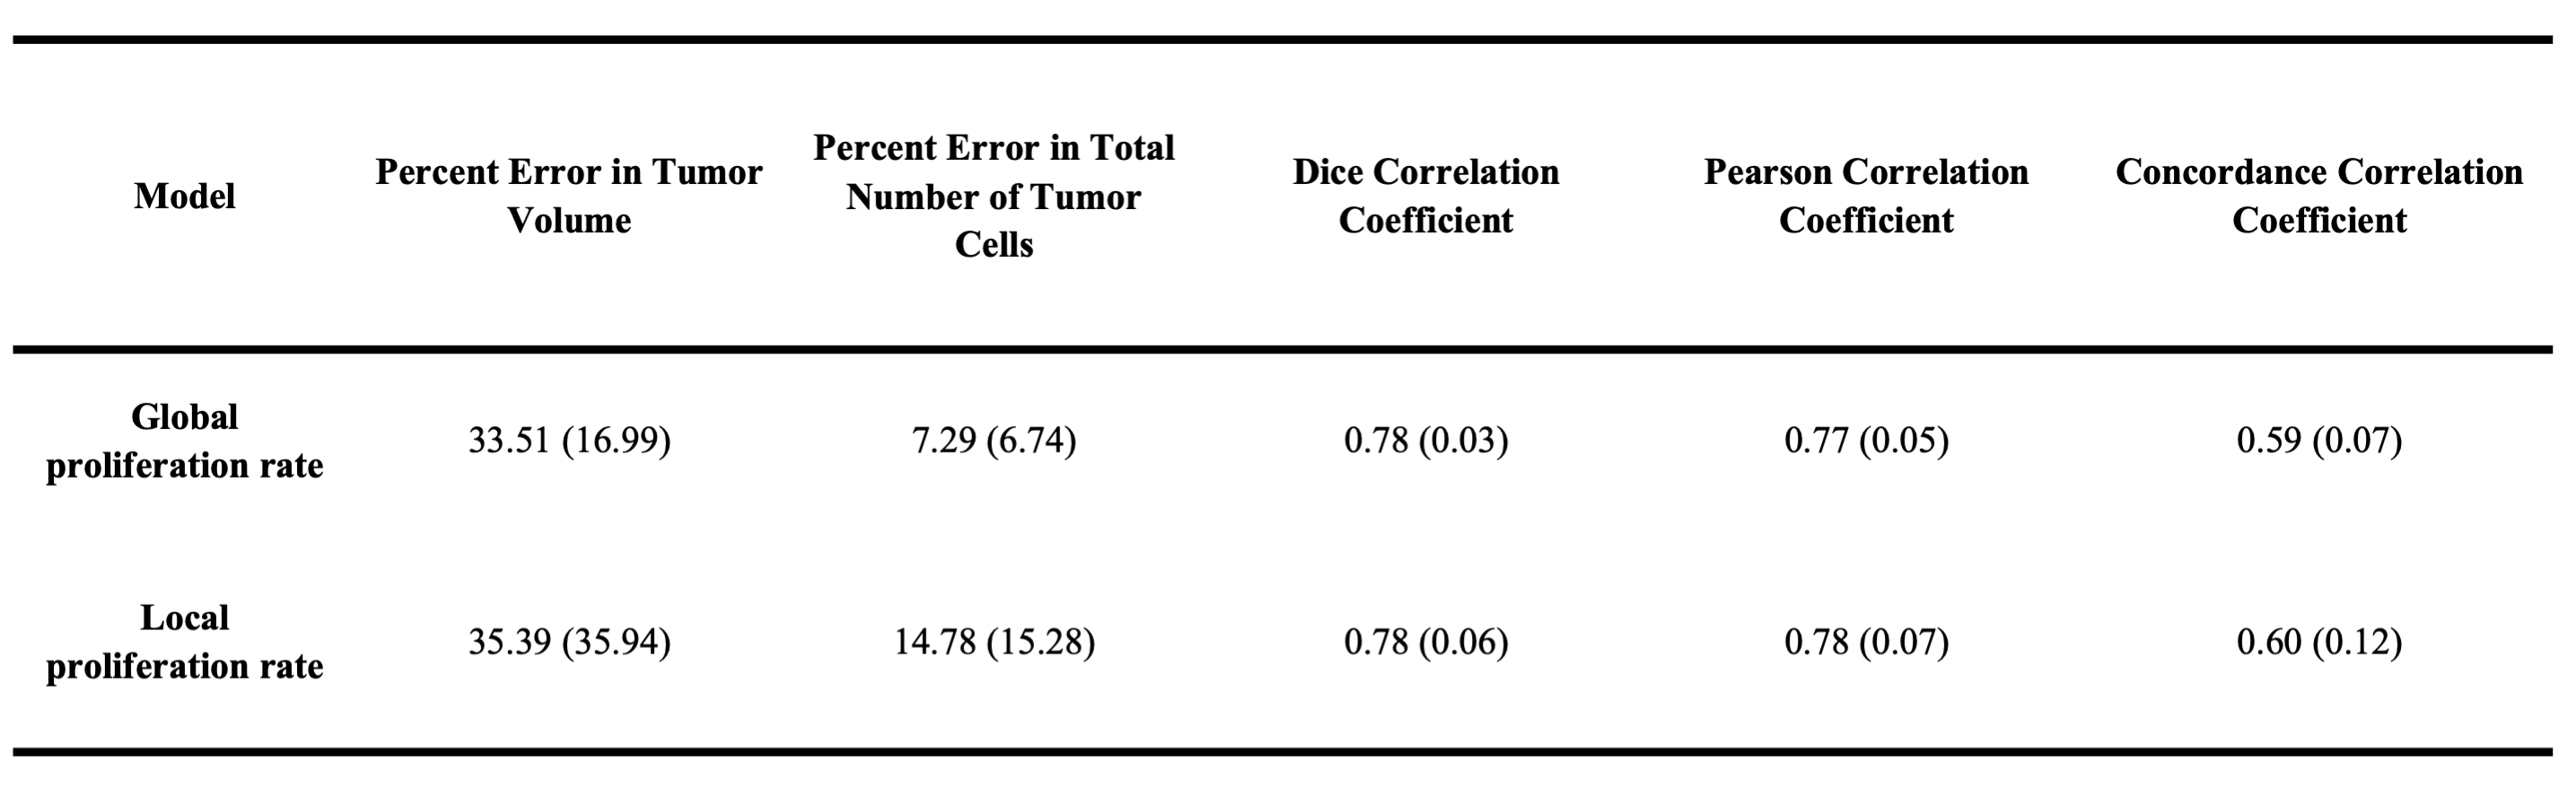
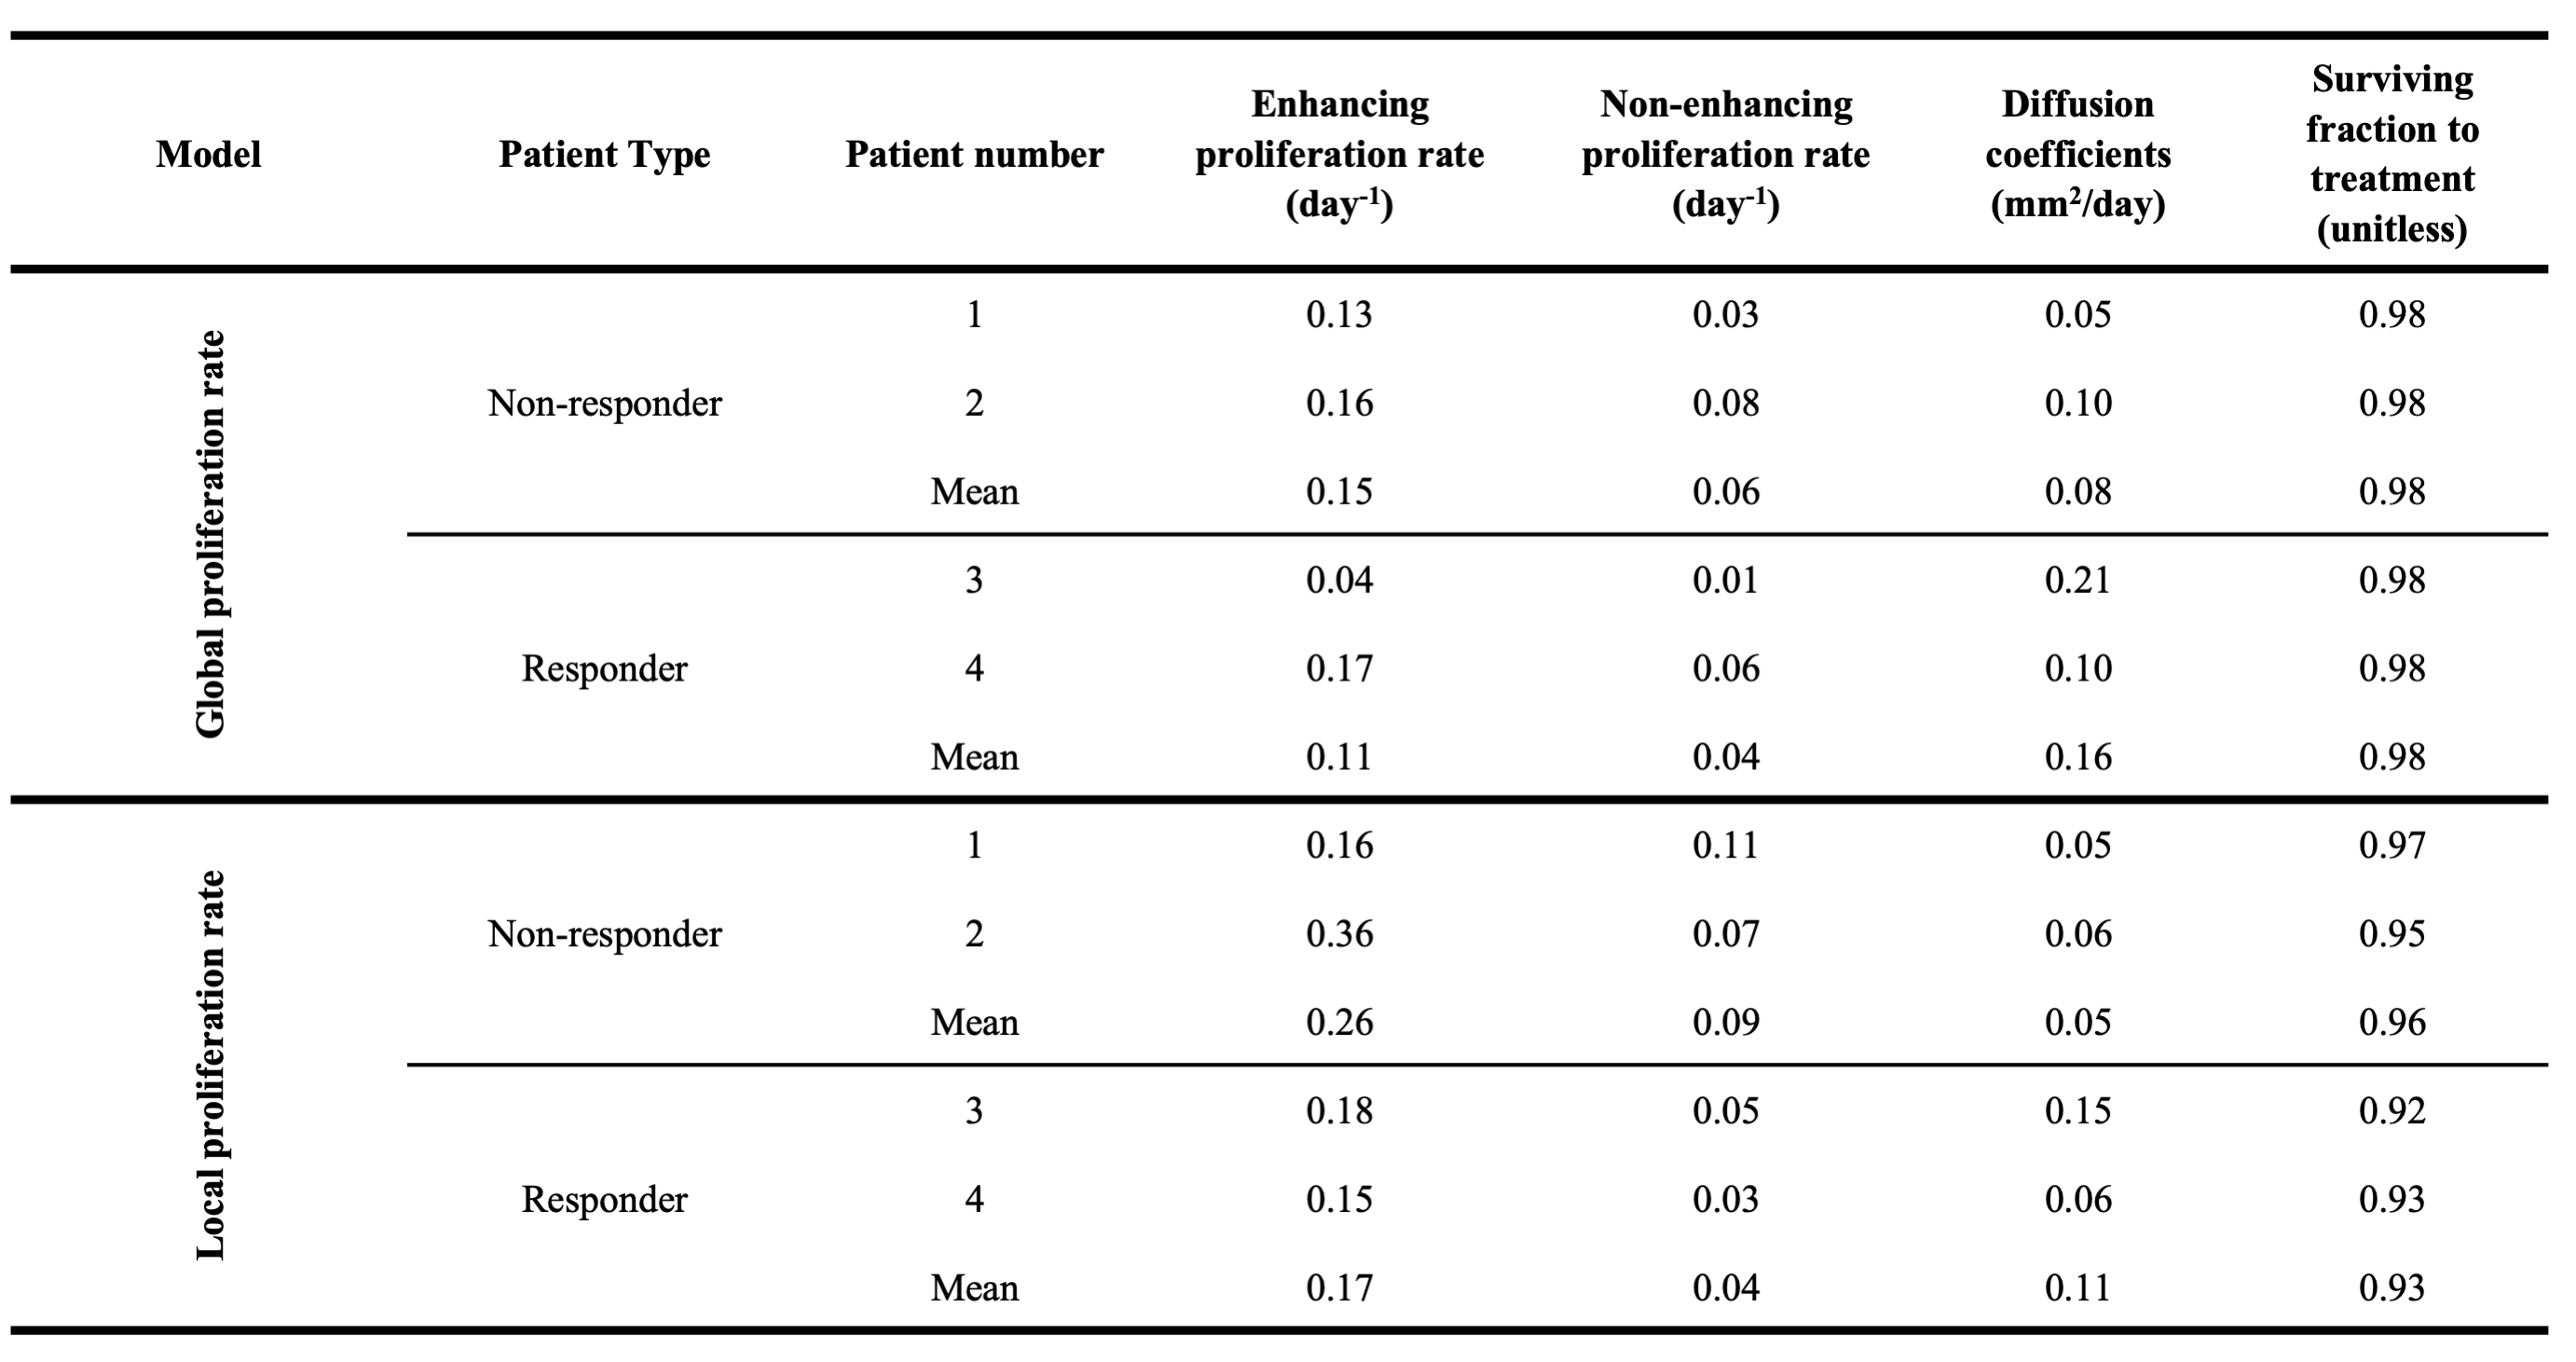
Figure 2 shows the predicted tumor cell count for a responder and non-responder at the final imaging visit, while Table 1 summarizes the results for the entire cohort at 6 months post-calibration. Low errors in predicted cell number ( 14.78%) and spatial overlap ( Dice > 0.78) were observed for both model variations. The model with a local proliferation rate had increased PCCs (0.78 ± 0.07) and CCCs (0.60 ± 0.12) compared to the global proliferation rate model (0.77 ± 0.05 and 0.59 ± 0.07, respectively). Both models resulted in high error in tumor volume predictions (> 33.5%). Table 2 reports the model parameters for each patient where it was observed that non-responding patients had 1.5× higher proliferation rates than the responder patient for the global proliferation model. For the local proliferation model, surviving fraction of cells due to treatment was 1.03× higher for the non-responder than the responders.Discussion
In this preliminary study we have developed an approach to personalize tumor growth models with quantitative imaging to predict patients with recurrent glioblastoma response to anti-angiogenic treatment. We have assessed and compared the limits of the predictive accuracy of two distinct mathematical models composed of globally and locally defined proliferation rates and found that the locally defined proliferation rate model results in improved predictions at the voxel level.Conclusion
The proposed framework demonstrates the potential predictive strength of integrating imaging and biology-based mathematical models to predict treatment response to bevacizumab. Future studies will apply this methodology on a larger patient cohort and investigate optimizing treatment regimens.Acknowledgements
Moncrief Undergraduate Summer Internship, CPRIT RR160005, NCI R01CA235800, Oncological Data & Computational Sciences 2020-21 Pilot Project.References
[1] Schmainda KM, Zhang Z, Prah M, Snyder BS, Gilbert MR, Sorensen AG, Barboriak DP, Boxerman JL. 2015; Dynamic susceptibility contrast MRI measures of relative cerebral blood volume as a prognostic marker for overall survival in recurrent glioblastoma: results from the ACRIN 6677/RTOG 0625 multicenter trial. Neuro Oncol. 17 8 1148–56.
[2] Hormuth II DA, Feghali KA Al, Elliott AM, Yankeelov T, Chung C. 2021; Image‑based personalization of computational models for predicting response of high‑grade glioma to chemoradiation. Sci Rep. 11 1–14.
[3] Kinahan PE, Muzi M, Bialecki B, Coombs L. 2018. Data from ACRIN-FMISO-Brain. The Cancer Imaging Archive. http://doi.org/10.7937/K9/TCIA.2018.vohlekok
Figures